

Abstract
Anatomical and physiological studies have shown that anteroventral cochlear nucleus (AVCN) neurons receive glycinergic and GABAergic inhibitory inputs. In this study, changes in the temporal responses of AVCN neurons to pure tones and complex sounds after blocking inhibition were analyzed. Blocking inhibition influenced the temporal responses of each type of AVCN neuron. Choppers showed more chopping peaks and shortened chopping cycles after blocking inhibition. Sustained and slowly adapting choppers showed increased regularity throughout the response duration after blocking inhibition, whereas most transient choppers showed increased regularity in the early part of the response. Diverse changes in temporal response patterns were observed in neurons with primary-like and unusual responses, with several neurons showing a large decrease in the first-spike latency after blocking inhibition. This result disagreed with previous findings that onset responses are less affected than sustained responses by manipulating inhibition. Although blocking inhibition had a greater effect on spontaneous activity than that on tone-evoked activity, the change in spontaneous activity was less significant because of larger variability. In addition, for relatively high level masker noises, blocking inhibition had similar effects on responses to noise-alone and noise-plus-tone stimuli, in contrast with previous studies with low-level background noise. In general, inhibition had an enhancing effect on temporal contrast only for responses to amplitude-modulated tones, for which envelope synchrony was enhanced. Results of this study contribute new information about the characteristics, functional roles, and possible sources of inhibitory inputs received by AVCN neurons.
INTRODUCTION
The cochlear nucleus (CN) sends major inputs to higher levels of the auditory pathway. Understanding the response properties and information-processing mechanisms of CN neurons can aid the study of higher-level neurons. Established models of auditory-nerve fibers (ANFs; Giguère and Woodland 1994; Robert and Eriksson 1999; Zhang et al. 2001; Zilany and Bruce 2006) provide useful tools to simulate the responses of CN neurons caused by excitatory ANF inputs. However, it is difficult to understand the role of inhibitory inputs because the source of inhibition remains unclear for specific neurons or neuron types.
All principal cell types in the anteroventral cochlear nucleus (AVCN) receive inputs that stain for glycine (Wenthold et al. 1988) and γ-aminobutyric acid (GABA; Saint Marie et al. 1989). Possible glycinergic inputs include projections from the tuberculoventral (vertical) neurons in the dorsal cochlear nucleus (DCN) and D-stellate neurons in the posteroventral cochlear nucleus (PVCN) and AVCN (Arnott et al. 2004; Oertel and Wickesberg 1993; Smith and Rhode 1989; Wickesberg and Oertel 1988, 1990). Vertical cells respond actively to characteristic frequency (CF) tones and weakly to broadband noise (Gibson et al. 1985), whereas D-stellate cells respond weakly to CF tones but actively to broadband noise (Rhode and Greenberg 1994). A third source of glycinergic inhibition is the descending input from the superior olivary complex (SOC). A study in guinea pig using retrograde labeling combined with immunocytochemistry reports glycinergic projections from the lateral (LNTB) and ventral (VNTB) nuclei of the trapezoid body and the dorsal periolivary nucleus to the CN. Most of these projections are ipsilateral (Ostapoff et al. 1997). There are reciprocal connections between the CN and the posteroventral periolivary nucleus (PVPO): the only known input to the PVPO is the ascending projection from the CN and the only known output of the PVPO is the descending glycinergic projection to the same area of the CN (guinea pig: Helfert et al. 1989; Thompson and Schofield 2000). There are also commissural glycinergic projections from the contralateral CN to the ipsilateral CN (Babalian et al. 2002; Wenthold 1987).
Sources of GABAergic inhibition to the AVCN are less clear. The major source of GABAergic inhibition is presumably the descending projection from the SOC. Most of these GABAergic neurons are bilaterally located in the VNTB (Ostapoff et al. 1997). Although there are GABAergic inhibitory interneurons located in the DCN, no connections between these neurons and the VCN have been found. Golgi cells in the superficial granule cell domain are GABAergic (Kolston et al. 1992). It is likely that some AVCN neurons have distal dendrites that receive inputs from these cells (Ferragamo et al. 1998b), since these cells do not project to the VCN itself, but to regions overlying the VCN. However, inhibition is not expected to have a strong effect when the inputs synapse on the distal dendrites of the target neurons. This assumption is confirmed by the fact that GABAergic inhibitory postsynaptic potentials (IPSPs) are insignificant during brain-slice recording (Ferragamo et al. 1998a; Oertel 1983), when inputs from outside the CN are absent.
Early studies that used off-CF tones to detect inhibitory sidebands (Goldberg and Brownell 1973; Martin and Dickson 1983; Rhode and Greenberg 1994) might have yielded misleading results because excitatory and inhibitory areas overlapped in the frequency responses of AVCN neurons. A more direct approach to study the response properties of inhibitory inputs is to make intracellular recordings of IPSPs. The in vivo intracellular study by Paolini et al. (2005) suggested that the difference in discharge regularity between transient and sustained choppers might originate from the relative amount of overlap between excitatory and inhibitory response areas. More specifically, transient choppers have inhibitory response areas that closely match excitatory areas, and this match results in declined firing rate and regularity compared with sustained choppers. Sustained choppers have more lateral inhibition that is less effective in altering the firing rate and regularity in response to CF tones (Paolini et al. 2005). However, the dominance of excitatory postsynaptic potentials (EPSPs) in response to sound stimuli makes it difficult to detect the presence of IPSPs at any time other than after the tone offset. Moreover, if IPSPs were caused by shunting inhibition, they would be hard to detect because the reversal potential of shunting inhibition is close to the membrane resting potential.
Iontophoretically applying inhibitory receptor agonists or antagonists provides a better test of the effect of inhibition. Caspary et al. (1979, 1994) injected glycine/GABA-receptor agonists/antagonists in the AVCN and DCN and found that inhibition alters the maximum response or near-CF response for the majority of AVCN neurons, which is consistent with findings in the PVCN (Palombi and Caspary 1992) and the inferior colliculus (IC) (Palombi and Caspary 1996), but inconsistent with the hypothesis of lateral inhibition. Unfortunately, because sustained choppers were not differentiated from transient choppers in Caspary et al. (1994), it is not clear whether this finding agrees or disagrees with that of Paolini et al. (2005), who reported that sustained choppers receive lateral inhibition.
In addition to changes in average rate and frequency response, previous studies also focused on changes in the “temporal contrast” caused by inhibitory inputs. Several features have been observed related to the temporal contrast. First, spontaneous activity is reported to be more suppressed by inhibitory inputs than is sound-evoked activity (Caspary et al. 1979; Ebert and Ostwald 1995a,b). Second, sustained activity is reported to be more suppressed by inhibitory inputs than are onset responses (Ebert and Ostwald 1995a,b; Kopp-Scheinpflug et al. 2002). Third, activity evoked by low-level background noise is reported to be more suppressed by inhibitory inputs than is tone-evoked activity (Ebert and Ostwald 1995a). Fourth, inhibition enhances synchronization to the stimulus envelope in the PVCN and DCN, especially at low- and mid-modulation frequencies (Backoff et al. 1999). All these findings suggest that inhibition enhances the temporal contrast of CN responses to simple and complex sounds.
The present study explored the effect of blocking glycinergic and GABAergic1 inhibition on AVCN responses to short tones, tones in noise, and amplitude-modulated tones. Numerous repetitions of short tones were used in a detailed analysis of the changes in temporal responses. Relatively high level noise was used to examine the temporal contrast for stimuli at levels similar to those used in psychophysical studies of detection in noise (Costalupes 1983; Zheng et al. 2002). Moreover, the present study injected inhibitory receptor antagonists, whereas some of the observations described earlier were based on the injection of inhibitory receptor agonists. As pointed out by Ebert and Ostwald (1995b), the steady injection of agonists creates a source of tonic inhibition, which can be qualitatively different from sound-evoked inhibition received by the target neuron. In addition to revealing information about the influence of inhibition on temporal contrast, changes in the responses to tones in noise when blocking inhibition can also help identify the source of the inhibitory inputs. As mentioned earlier, vertical cells and D-stellate cells respond differently to noise and to tones. Therefore the different effects of inhibition on responses to tones and noise might provide clues about the types of neurons that provide inhibition to different AVCN response types.
METHODS
Animal preparation
Details of the surgical procedure are described in Gai and Carney (2006). Briefly, Mongolian gerbils (Meriones unguiculatus),2 to 4 mo of age, were anesthetized with ketamine and xylazine and placed in a double-walled soundproof booth. A patch of skin was removed from the top of the animal’s head and the skull was glued to a head bar mounted in a stereotaxic instrument (model 900, Kopf Instruments) using dental acrylic to ensure long-duration single-unit recordings. A plastic sound-delivery tube was coupled to the left meatus after the pinna was removed. A hole in the dorsal and caudal bulla was made to expose the temporal bone, in which a second small hole was made for electrode penetration through the dura to the AVCN. The surgical procedures were approved by the Syracuse University Institutional Animal Care and Use Committee.
Sound stimuli
Sound stimuli were created digitally with Matlab and converted to analog signals with a programmable Tucker Davis Technologies System III. Linear compensation of levels for frequencies from 70 Hz to 10 kHz was performed for each sound stimulus, based on a calibration table generated at the beginning of each experiment with an ER-7C probe microphone (EtymMtic Research). Neurons with CFs outside the range of 0.3 to 9 kHz were not studied.
The sound stimuli were short tones, 100% sinusoidally amplitude modulated (SAM) tones, and tones in broadband noise. The CF, threshold, and spontaneous rate (SR) were measured using an automated tuning curve (Liberman 1978). Rate-level functions of short tones at CF (25-ms duration, 5-ms cosine-squared ramps, repeated every 100 ms at several levels with a 10- or 15-dB step size) were most frequently used to monitor the iontophoretic effect on neural responses. One hundred repetitions were obtained at each tone level for the categorization of response types according to Blackburn and Sachs (1989) and for the study of details of the temporal responses to tones. The frequency-response area was studied by varying the frequency and level of 25-ms tones (10 repetitions, 15- or 20-dB step size). At each tone level, the tone frequency swept from below CF to above CF (e.g., 2 octaves below and 1 octave above) in half-octave steps, except when limited by the frequency range of the calibration. Three or four tone levels were studied for each neuron, with one level slightly above threshold, one level at 70 or 80 dB SPL, and one or two intermediate levels.
The carrier frequency of the SAM tone was set at the neuron’s CF. The level of the carrier was about 20 dB above the neuron’s pure-tone threshold. The SAM tone had a duration of 600 ms and had 5-ms cosine-squared ramps, and was repeated every second for six to eight trials at each of several modulation frequencies, which were arranged from low to high (e.g., from 16 to 1,024 Hz) in 1-octave steps.
The tone-in-noise stimulus was either a broadband Gaussian noise (0.1-10 kHz) or the noise plus a CF tone at various tone levels (20-80 dB SPL, 10- or 15-dB step size). The noise spectrum level was 30 dB SPL (overall level of 70 dB SPL). The tone-in-noise stimulus had a duration of 250 ms and had 10-ms cosine-squared ramps and was repeated every 475 s for 20 to 50 repetitions. Tone levels were randomly arranged in each repetition. The noise was randomly created and frozen for each data set and thus varied across tests (and before and after blocking inhibition). After each tone-in-noise trial, the same tone was repeated without the noise.
Recording and iontophoresis
Neural recordings were amplified by an AC preamplifier (Grass P55) through a high-impedance input module (Grass HZP). A voltage-crossing criterion was used to discriminate spikes from background noise, and the times of the peaks of spikes were marked as spike times with a resolution of 1 μs. Only bipolar action potentials were studied, to limit recordings to AVCN cells rather than fibers of passage (Rhode 1998).
Single-neuron extracellular recordings and iontophoretic injections were made with six-barrel piggyback electrodes (Havey and Caspary 1980). The recording electrode (15-50 MΩ) was attached with epoxy to the injecting barrels, protruding 10-25 μm to their tip. The injecting five-barrel electrode (1.2 mm OD × 0.68 mm ID, 10 cm in length; World Precision Instruments) was pulled to a tip; the tip was then manually broken to achieve a diameter of 10-20 μm. Each injecting barrel contained one of the following chemicals: strychnine-HCl (10 -20 mM, pH 3-3.5), a glycine-receptor antagonist; bicuculline methiodide (10 mM, pH 3-3.5), a γ-aminobutyric acid type A (GABAA)-receptor antagonist; gabazine (3-5 mM, pH 3-3.5), a GABAA-receptor antagonist; glycine (500 mM, pH 3.5-4); or GABA (500 mM, pH 4-4.5). Injecting currents (+20-35 nA per barrel; one or two barrels with the same chemical were used at a time) were generated and monitored by a four-channel current generator (NeuroPhore BH-2, Harvard Apparatus); a negative holding current (-15 nA) was maintained for each barrel when no injections were being made. To avoid the buildup of net charge due to injected current, a balancing barrel (the center barrel of the five-barrel electrode) continuously injected a current that was equal to the sum of the currents in the other barrels with inverse polarity. The balancing barrel and the attached recording barrel were filled with 1 M sodium acetate (Kopp-Scheinflug et al. 2002). Sodium was used to be consistent with extracellular ionic concentrations; acetate was chosen to reduce diffusion and transport number during application of hyperpolarizing current (Müller 1992). Occasionally, one of the injecting barrels was filled with 1 M sodium acetate as a control barrel to test the possible effect of electrical current alone.
The multibarrel electrode was advanced by a manual micropositioner through the dura and cerebellum to the AVCN. Each penetration was constrained within a small range of stereotaxic angles that resulted in penetration of the AVCN (this range of angles was verified in pilot studies to result in recording sites limited to the AVCN), as determined in Gai and Carney (2006). After recording from a neuron, the electrode was moved by ≥150 μm and a delay of ≥30 min was imposed before recording from another neuron.
Data analysis
Neuron response types were categorized based on Blackburn and Sachs (1989): 1) primary-likes (PLs), 2) primary-like-with-notches (PLNs), 3) choppers (including different chopping types), 4) onset, and 5) unusual response types. Unusual response types were those that did not satisfy the criteria for any of the other response categories.
During injections, the SR was computed based on spikes within a 50- to 100-ms window after the onset of the 25-ms tones at the lowest level used for the rate-level function. (The sound-evoked response was always within 40 ms of tone onset and the lowest tone level was always below threshold.) The SR obtained with this method agreed with the SR computed from the tuning curve program, which was run when each neuron was first encountered.
First-spike latency (FSL) is difficult to measure because of the presence of spontaneous activity. Young et al. (1988) set a cursor by hand at the beginning of sound-evoked activity based on visual examination of the poststimulus time histogram (PSTH) and discarded all activity before the cursor. Chase and Young (2007) provided a binless algorithm that was used here; this algorithm determines the starting time of the sound-evoked activity by computing the probability of an instantaneous firing rate that can or cannot be generated by spontaneous activity. Specifically, the algorithm first searches for the time when at least five spikes (combined across all stimulus repetitions) have occurred. Then the probability of generating a number of spikes in a certain time interval by spontaneous firing is calculated for a set of intervals between the present spike and each previous spike. The shortest interval includes the previous five spikes and the longest interval includes all previous spikes. When the minimum probability across different lengths of intervals is below a certain criterion (i.e., 10-6), the time is marked as the start of tone-evoked activity; otherwise, the time point moves to the next spike. In this study, the starting point was used to exclude spontaneous spikes that occurred before the sound-evoked response. The mean FSL was then computed based on the remaining spikes. A t-test was used to test the significance of rate changes in response to CF tones after blocking inhibition and t values were compared across neuron types. In this study, the reported t value is the maximum t value across tone levels unless otherwise specified.
Analysis of drug effects
In the following text, “positive effect” (Caspary et al. 1994) refers to consistently increased neural responses to CF tones based on the rate-level functions, frequently repeated during iontophoresis. “Drug effect” (Caspary et al. 1994) refers to an effect on neural responses that was presumably caused by the inhibitory receptor antagonists or agonists, rather than by other unknown factors (e.g., current injection, mechanical effects of the electrode on the neuron, or change in pH). The rate-level function was frequently obtained (approximately every 5 min) to monitor the change of average firing rate and to check the stability of action potentials, which ensured that recordings were from the same neuron over time.
Neurons that showed unchanged rate were counted as negative-effect neurons if one of the two following conditions was met: 1) the injecting and recording tips of the electrode remained close (<25 μm) to each other after the recording session, as judged with a ×100 microscope after the recording session; 2) during the same penetration, there were other positive-effect neurons. If neither of these conditions was met, the neuron was not included in the results presented here.2 In other words, a neuron that showed no change in rate was counted as a negative-effect neuron only if a given electrode was known to function properly.
A neuron was considered to show a positive effect only when it satisfied the following two criteria: 1) average rate significantly increased (t-test, P < 0.05) for at least one superthreshold level (≥10 dB above threshold) and 2) the rate increase remained significant until the end of the injection and did not disappear immediately on termination of the injection. (The maximum effect commonly occurred some time after termination of the injection current.) Some neurons occasionally showed significant rate increases during the injection, but the increase disappeared before or immediately after the injection terminated; these were considered to be negative-effect neurons.
Recovery of the drug effect was indicated when the average discharge rate consistently decreased after termination of the injection by ≥10% of the maximum rate. The recovery process was highly variable across neurons and across inhibitory receptor antagonists. For neurons that did not show signs of recovery within the holding time (between 3 min and 4 h), the positive effects were still considered drug effects if the preceding two criteria were met.
RESULTS
Responses to short tones at CF
Responses of 89 neurons in 38 gerbils are presented. Table 1 lists neurons that showed positive effects to inhibitory receptor antagonists. Fifty-four of 89 neurons showed positive effects after injection of either glycine (21/59) or GABA (33/73) receptor antagonists. Of these 54 neurons, 12 were tested with both types of antagonists; these neurons showed a positive effect and full recovery to whichever inhibitory receptor antagonist was tested first for that neuron. Two neurons (2/12, one sustained chopper and one unusual response type) showed positive effects for both antagonists. In general, larger rate changes were observed after blocking GABAergic inhibition than after blocking glycinergic inhibition. (The maximum t values for changes in sound-evoked rate averaged across all neurons were 13.8 and 9.9, respectively.)
TABLE 1. Summary of positive effects for all recorded neurons.
| Cell Type | PL | PLN | Chp-S | Chp-T | Chp-SA | Unusual | Onset | Overall |
|---|---|---|---|---|---|---|---|---|
| Strychnine | ||||||||
| n | 25 | 3 | 8 | 5 | 8 | 9 | 1 | 59 |
| Positive effect | 7 | 3 | 2 | 2 | 1 | 6 | 0 | 21 (35%) |
| >10% recovery | 2 | 0 | 1 | 1 | 1 | 2 | 0 | 7 (33%) |
| Bicuculline | ||||||||
| n | 15 | 0 | 3 | 3 | 3 | 2 | 1 | 27 |
| Positive effect | 7 | 3 | 3 | 2 | 1 | 1 | 17 (63%) | |
| >10% recovery | 3 | 2 | 0 | 2 | 1 | 0 | 8 (47%) | |
| Gabazine | ||||||||
| n | 14 | 0 | 10 | 4 | 8 | 8 | 2 | 46 |
| Positive effect | 4 | 3 | 1 | 2 | 5 | 1 | 16 (35%) | |
| >10% recovery | 2 | 1 | 1 | 1 | 0 | 0 | 5 (31%) | |
PL, primary-like; PLN, primary-like-with-notch; Chp-S, sustained chopper; Chp-T, transient chopper; Chp-SA, slowly adapting chopper.
Thirty of 37 negative-effect neurons were tested with both types of inhibitory receptor antagonists and the other 7 negative-effect neurons were tested with only one type of antagonist. As stated earlier, negative-effect neurons sometimes showed significant but temporary rate increases; however, the increased rate either disappeared before or immediately after termination of the injection.
There were 29 to 47% of positive-effect neurons that showed recovery for different inhibitory receptor antagonists (Table 1). Although the percentage of neurons that showed full or partial recovery did not differ substantially for different antagonists (Table 1), it was commonly observed that recovery after injection of bicuculline was relatively quick and complete as compared with the other two antagonists.
Glycine and GABA were injected only during recordings from two and three neurons, respectively. A chopper that showed a positive effect to bicuculline did not change responses in the presence of glycine (a strychnine injection was not available for this neuron). An unusual response type that showed different positive effects to strychnine and bicuculline had a decreased rate after glycine injection (this neuron will be subsequently described in detail). One PL and one chopper showed positive effects to bicuculline but negative effects to GABA. The responses of the last neuron, a PL, did not change after injection of strychnine, bicuculline, or GABA.
Figures 1-5 show examples of different response types in response to the injection of inhibitory receptor antagonists. Figure 6 shows all 54 positive-effect neurons. General observations for each response type follow.
FIG .1.

A: pure-tone responses of a primary-like (PL) response type (g396u1) before and after injection of bicuculline. Total duration of bicuculline injection was 15 min. Left column: rate-level functions for characteristic-frequency (CF) tones (CF = 1,808 Hz). Middle and right columns: poststimulus time histograms (PSTHs) and mean interspike intervals (ISIs) as a function of time in response to a 70 dB SPL tone at CF. Top row: responses before injection. Middle and bottom rows: responses after injection. CV, coefficient of variation (Blackburn and Sachs 1989). B: PL, g342u4; total duration of strychnine injection was 54 min. CF = 1,103 Hz (same format as that in A). Note the appearance of early peaks in the middle panels of the bottom 2 rows.
FIG. 5.

Unusual response type, g368u2; total duration of drug injection was 23, 60, and 7 min for bicuculline, strychnine, and glycine, respectively. CF = 3,544 Hz (same format as that in Fig. 1). Note the early peaks in the middle column, 2nd, 4th, and 5th rows.
FIG. 6.

Rate-level functions (odd-numbered columns) and PSTHs (even-numbered columns) in response to CF tones for all neurons before and after blocking glycinergic (Gly) or GABAergic (Gab) inhibition. In the rate-level plots, thick lines are average rates before injection and thin lines are maximum average rates during or after injection. In the PSTH plots, top panels are PSTHs before injection and bottom panels are PSTHs for responses with maximum average rates during or after injection. All PSTHs are responses to the highest-level CF tones studied (60-80 dB SPL).
PRIMARY-LIKES (PLS) AND PRIMARY-LIKE-WITH-NOTCHES (PLNS)
Figure 1 shows changes in rate-level functions (left column), PSTHs (middle columns), and interspike intervals (ISIs) versus time (right columns) for two PLs caused by injecting bicuculline and strychnine, respectively. The PSTHs and interval plots were obtained at the highest tone level (70 or 80 dB SPL). The first neuron showed a maximum change 61 min after the 15-min injection of bicuculline ended; the positive effect was highly reduced 166 min after the injection ended. For the second neuron, the maximum change occurred 108 min after termination of the 54-min injection of strychnine.
The first PL (Fig. 1A) did not show a change in the shape of the PSTH, consistent with most PLs. The onset gradually became earlier and sharper for the second PL (Fig. 1B)as the average rate increased. Other neurons also showed this “early peak” during or after injection; this phenomenon will be subsequently discussed in more detail. The coefficient of variation (CV; Blackburn and Sachs 1989) is shown in the right columns (Fig. 1) to quantify the discharge regularity. The CV of the first PL did not change, whereas the CV of the second PL decreased as the onset peak moved earlier.
Since both PLs had CFs between 1 and 2 kHz, they phase-locked to the tone frequency. No change in the synchronization coefficient was observed with drug injection. In general, blocking inhibition did not vary the synchronization to tone frequency or the phase of the synchronized response for PLs. Diverse effects of inhibition were observed when comparing the rate-level functions and PSTHs for all 18 PLs and 3 PLNs (Fig. 6, the first 21 groups of panels). For example, the shape of the rate-level function and the first-spike latency changed in different ways across neurons.
CHOPPERS
Figure 2 shows changes in tone responses after gabazine injection for a transient chopper (Chp-T). In addition to an increased average discharge rate, a systematic change in the PSTH was observed. Before the injection of gabazine, three clear chopping cycles could be identified (Fig. 2, top row, middle column). During the injection, a distinct fourth peak was observed (Fig. 2, middle row, middle column). This neuron showed full recovery 18 min postinjection (Fig. 2, bottom row, middle column); the average rate decreased and the fourth peak disappeared. The right column shows the mean ISIs over time that were used to classify chopper types. The intervals were computed over ≤20 ms to avoid end effects (Blackburn and Sachs 1989; Young et al. 1988). This neuron was classified as a transient chopper [also called a transiently adapting chopper (Blackburn and Sachs 1989)] because the intervals increased abruptly over the early part of the response and then slightly decreased later (Fig. 2, top row, right column). During the injection of gabazine, the abrupt increase of intervals at the beginning of the response disappeared (Fig. 2, middle row, right column). This neuron did not show a positive effect to strychnine injection.
FIG .2.

Transient chopper (Chp-T), g387u12; total duration of gabazine injection was 11 min. CF = 2,362 Hz (same format as that in Fig. 1). Note the extra cycles in the middle column, 2nd row.
Figure 3 shows changes in response to GABA-receptor antagonist injection for two slowly adapting choppers (Chp-SAs). These examples, one for gabazine and the other for bicuculline, are presented to show that some basic observations obtained with these two types of GABA-receptor antagonists were generally consistent, except the recovery process was usually faster after a bicuculline injection. These two neurons were classified as Chp-SAs since their ISIs increased with time. However, when GABA-receptor antagonists were injected, the ISIs became relatively constant with time so that the two slowly adapting choppers indeed became sustained choppers. The CV decreased from 0.26 to 0.09, and from 0.25 to 0.15 for the two choppers, respectively. The change of regularity can also be observed in the PSTHs (middle columns) because a larger number of distinct chopping cycles appeared during drug injection. The chopping cycles also decreased correspondingly. The second Chp-SA was also tested with strychnine injection but did not show a positive effect.
FIG .3.

A: slowly adapting chopper (Chp-SA), g381u2; total duration of gabazine injection was 12 min. CF = 1,547 Hz. B: Chp-SA, g362u2; total duration of bicuculline injection was 23 min. CF = 543 Hz (same format as that in Fig. 1). Note the faster chopping and extra cycles in A, 2nd row, middle and in B, 2nd row, middle.
Figure 4 shows changes after bicuculline injection for a sustained chopper (Chp-S). The ISIs of sustained choppers are nearly constant over time (Blackburn and Sachs 1991). In the present study, various changes to the sustained properties were observed. In the ISI plots (Fig. 4, top row, right column), before blocking inhibition, intervals slightly increased as a function of time. Nevertheless, this neuron was classified as a Chp-S because the increase was substantially smaller than that for Chp-SA response types (Chp-S responses had CVs ≤0.2 and Chp-SA responses had CVs >0.2). After bicuculline was injected, the intervals became more invariant over time. Similar to the Chp-SA response, more chopping cycles with a faster chopping rate were observed in the PSTH (Fig. 4, middle column) of the Chp-S response. This neuron did not show a positive effect to strychnine injection.
FIG. 4.

Sustained chopper (Chp-S), g362u1; total duration of bicuculline injection was 16 min. CF = 1,476 Hz (same format as that in Fig. 1). Note the faster chopping in the 2nd row, middle panel.
As shown in the population plot (Fig. 6), the change in discharge rate in response to on-CF tones after the injection of inhibitory receptor antagonists was smaller for Chp-S response types (Fig. 6, #22-29) than for Chp-SA (Fig. 6, #36-40) and Chp-T (Fig. 6, #30-35) response types. Previous studies also suggested that Chp-S response types may not receive strong inhibition (Banks and Sachs 1991; Hewitt and Meddis 1993) or that Chp-S response types mainly receive off-CF inhibition (Paolini et al. 2005). However, since Chp-S response types had more regular discharges, the variance in rate was smaller (confirmed by this study), and thus the same amount of rate change can be more meaningful compared with the other two chopper types. Therefore the t value was used to quantify the significance of changes in discharge rate. In fact, the maximum t values of Chp-S responses across tone levels were comparable to the values of other response types (not shown); it was thus concluded that Chp-S responses to CF tones were also affected by inhibitory inputs.
As shown by the two Chp-SA types and one Chp-S type, the regularity of choppers could be affected by inhibitory inputs. Figure 7 shows the CV values before and after the injection of inhibitory receptor antagonists for all choppers that showed positive effects (small CV values indicate regular discharges). The CV is traditionally computed based on discharges in the time window of 12 to 20 ms (Blackburn and Sachs 1989), as shown in Fig. 7 (left). Chp-SA response types (Fig. 7, left, plus symbols) showed the greatest change in CV after blocking inhibition (three of five responses actually became sustained choppers). Six of eight Chp-S response types (Fig. 7, left, right triangles) also showed decreased CV. Although one Chp-T became a Chp-S after injection of GABAergic antagonists, no systematic change in regularity was observed for the other five Chp-T response types (Fig. 7, left, downward triangles). However, as illustrated by the Chp-T in Fig. 2, the change in ISIs primarily occurred before 12 ms, which was excluded by the traditional 12- to 20-ms CV time window. Figure 7 (right) shows the CV based on discharges that occurred between 0 and 12 ms after stimulus onset. All Chp-T response types showed decreased regularity within this time window (Fig. 7, right, downward triangles). In summary, irregular chopping patterns can be generated from regular chopping patterns by inhibitory inputs; however, inhibitory inputs do not necessarily account for all irregular chopping patterns. (This finding is revisited in the discussion.)
FIG. 7.

Coefficients of variation (CVs) computed based on activity in different time windows (left, 12-20 ms; right, 0-12 ms) for choppers before (x-axis) and after (y-axis) blocking inhibition. Responses to both glycinergic and GABAergic receptor antagonists are included.
UNUSUAL AND ONSET RESPONSE TYPES
Two onset and 12 unusual response types are presented here. A higher percentage of these neurons showed positive effects compared with the two major response types (Table 1). Four unusual response types showed chopper-like or multimodal patterns, but they did not satisfy the one-spike-per-peak criterion required for categorization as choppers (Blackburn and Sachs 1989).
Figure 5 shows responses of an unusual response type to bicuculline (second row), strychnine (fourth row), and glycine (bottom row), respectively. In response to CF tones, this neuron had a relatively broad peak at the response onset, followed by low activity that built up in time (top row, middle column). After injecting bicuculline, both onset and sustained activity increased (second row, middle column) and ISIs decreased (second row, right column). The activity increase was maximal during the latter portion of the response and minimal right after onset. This neuron recovered by 64 min postinjection (third row). Similar to the Chp-T response type illustrated in Fig. 2, the recovered average rate was slightly lower than the control rate at high tone levels (Fig. 5, third row, left column). This “overrecovery” was reflected in the PSTHs as a less distinct onset and lower activity at the end of the response.
The most interesting change in response to strychnine injection was the appearance of a precisely timed early peak (Fig. 5, fourth row, middle column). This peak was 4.7 ms earlier than the broad peak seen in the original response (top row, middle column). There was also a 1- to 1.5-ms-wide notch after the early peak. The sustained activity showed less increase and was constant over time. The average rate recovered 31 min postinjection (fifth row, left column). The early peak decreased by half, but did not totally disappear (fifth row, middle column). The last row shows the response of this neuron after injection with glycine. Both the early peak and sustained activity decreased drastically, confirming the presence of glycinergic inhibition.
The effects of inhibition on the 11 unusual and 2 onset response types were diverse (Fig. 6, bottom three rows; #42 and 47 were the same neuron shown earlier). Besides the unusual response type described earlier, another neuron (Fig. 6, #50) showed highly isolated early peaks at times when no discharges were present in the control responses. One example (Fig. 6, #48) showed an enhanced, but not earlier, onset compared with the control responses. Another example (Fig. 6, #52) had multiple peaks, similar to a chopper (this cell was not characterized as a chopper because it failed the one-spike-per-peak criterion). After blocking inhibition, the timing of these peaks did not change, but an early peak appeared, and the interval between this extra peak and the second peak was approximately the same as the later intervals. On the other hand, two neurons (Fig. 6, #41 and 51) had a distinct extra chopping peak after the primary chopping peaks, but other parts of the response were essentially unchanged.
FIRST-SPIKE LATENCY (FSL) AND EARLY INHIBITION
Figure 8 shows the mean (A and B) and SD (C and D) of the FSL for all types of responses before and after blocking inhibition. (Glycinergic and GABAergic inhibitions are not differentiated in the plots because no difference was observed between the two types of inhibition.) The FSL was computed using responses to the highest tone level tested (60-80 dB SPL). The mean FSL decreased significantly for 31 neurons (P < 0.05), increased significantly for 8 neurons (P < 0.05), and remained unaffected for 15 neurons (Fig. 8A). Figure 8B amplifies the shaded area of Fig. 8A to provide a better view of short FSLs. These two plots show that the mean FSLs of choppers (circles) did not vary substantially after blocking inhibition. The filled symbols in these two plots represent 13 cells that had FSLs that decreased by >0.8 ms after blocking inhibition (14 symbols are filled in the plots of Fig. 8 because one cell showed FSL decrease of >0.8 ms for both inhibitory receptor antagonists); all of them were PL, unusual, or onset response types. These units accounted for 44% of all PLs, unusual, and onset types.
FIG. 8.

Mean (top row) and SD (bottom row) of first-spike latency (FSL) before and after blocking glycinergic or GABAergic inhibition. A and C show all cells; B and D show the cells within the left-bottom shaded areas of A and C, respectively. Filled symbols are cells for which mean FSL decreased >0.8 ms after blocking inhibition.
Figure 8, C and D shows SDs of the FSL. All but two of the neurons that had FSLs that decreased by >0.8 ms (filled symbols) had also decreased SDs (Fig. 8C). The FSL SD for all choppers and PLNs was <1 ms (Fig. 8C, bottom left corner, and Fig. 8D); the FSL SD for all PLs was >1 ms (Fig. 8C).
The inhibition associated with cells that showed FSL decreases of >0.8 ms after injecting inhibitory receptor antagonists was called early inhibition. [Note that the 0.8-ms criterion was arbitrarily chosen since no clear boundary existed between early inhibition and later inhibition (Fig. 8, A and B).] When applying a t-test to the changes in FSL on blocking inhibition, all FSL decreases were significant for cells with early inhibition. As shown in the mean FSL figure (Fig. 8, A and B), there were different degrees of early inhibition. The mean FSLs of some neurons were shortened by about 0.8 ms, whereas much larger time changes were observed for others. It was unclear whether a single underlying mechanism accounted for the large range of FSL shifts. Four of 13 cells that showed early inhibition required >30 min postinjection time to show the maximum effect and only one showed recovery during the holding time. It should also be noted that blocking glycinergic and GABAergic inhibitions both caused large changes in FSLs, although the sources of these two types of inhibitions are presumably different. Potential mechanisms for the influence of early inhibition will be subsequently discussed.
SOUND-EVOKED RATE AND SPONTANEOUS RATE
As shown in Table 1, some neurons within each response type showed a positive effect, whereas others did not. Because a positive effect was always associated with an increased discharge rate, the possibility that positive effects were associated with relatively low baseline rates (due to the presence of inhibition) compared with negative effects was examined (not shown). A large range of discharge rates (from ∼50 to 600 spikes/s) was observed for both positive- and negative-effect neurons. The five neurons (all of which were choppers) that had the highest rates (>450 spikes/s) did not show positive effects to either glycine- or GABA-receptor antagonists. However, for neurons that had average rates lower than these choppers, positive effects were observed for both high- and low-rate responses. It can thus be concluded that variations in excitatory inputs determined the range of discharge rates across neurons and inhibitory inputs modulated the rate only within a limited range.
Of the 54 positive-effect neurons (i.e., those for which the increase of sound-evoked rate was significant), 7 showed decreased SR, 16 showed unchanged SR (12 of the 16 had SR = 0), and 31 showed increased SR. Figure 9A shows the mean values of SR before and after blocking inhibition for both positive-effect (filled symbols) and negative-effect (open symbols) neurons. One interesting observation was that neurons with SR >45 spikes/s before blocking inhibition, which were all PLs or PLNs, never showed positive effects.
FIG.9.

A: spontaneous rate (SR) before and after blocking glycinergic or GABAergic inhibition. B: percentage of increase of SR vs. percentage of increase of the maximum sound-evoked rate across tone levels after blocking inhibition. Only neurons with control SR >5 spikes/s are plotted. C and D: change in spontaneous rate compared with change in sound-evoked rate after blocking inhibition in terms of t values. D is the shaded area in C. Open/filled symbols indicate neurons with negative/positive effects.
Ebert and Ostwald (1995a) computed the percentage of decrease of SR and sound-evoked rate by injecting GABA in the VCN. They found that the SR was significantly more reduced than the sound-evoked rate. In the present study, of the 31 neurons that showed increased SR after blocking inhibition, 27 showed a larger increase of SR than of sound-evoked activity. Figure 9B shows the percentage of SR increase versus the percentage of maximum sound-evoked-rate increase. Only cells with control SR >5 spikes/s are plotted, for consistency with Ebert and Ostwald (1995a). Based on this result, which does not take the variance of rate into account, it seemed that inhibitory inputs had a stronger effect on spontaneous activity than on tone-evoked activity.
Statistical tests of changes in SR incorporate the variability in rate. Figure 9, C and D shows t values based on changes in SR versus t values based on changes in tone-evoked rate after blocking glycinergic or GABAergic inhibition for both positive-effect (filled symbols) and negative-effect (open symbols) neurons (D amplifies the shaded area in C). Because the variance of SR was generally larger than the variance of sound-evoked rate, the t values for the change in SR were smaller than the t values for the change in sound-evoked rate for 91% of neurons with positive effects. Therefore based on this result, inhibitory inputs had a more significant effect on tone-evoked activity than on spontaneous activity.
Although the increase of SR for 33% of positive-effect neurons was significant (t >1.96, P < 0.05), one must be cautious when evaluating the drug effect on spontaneous activity for three reasons. First, the SRs of some negative-effect neurons also changed (27% showed significantly increased SR and 13% showed significantly decreased SR). Second, it was observed in at least three positive-effect neurons that SR already varied substantially before the injection of inhibitory receptor antagonists. Third, the recovery of SR was not correlated with the recovery of sound-evoked rate (not shown).
FREQUENCY-RESPONSE AREA
The response area was used to evaluate whether the frequency tuning of inhibitory inputs was aligned with that of excitatory inputs. Caspary et al. (1994) found that there are more cells with on-CF inhibition than off-CF inhibition for both primary-likes and choppers. In general, the present study also observed more on-CF inhibition (including broad inhibition) than off-CF inhibition (25 on-CF or broad inhibition cells compared with 16 off-CF inhibition cells). A unique finding here was that most of the off-CF inhibition was exhibited by PLs or PLNs (n = 9), as shown by the example in Fig. 10A. The majority of choppers (12/14) showed on-CF (especially broad) inhibition, as shown by the example in Fig. 10B. The hypothesis in Paolini (2005) that sustained choppers receive lateral inhibition and transient choppers receive on-CF inhibition was not supported by the present study. Four and 2 of 6 sustained choppers received on-CF and off-CF inhibition, respectively; 4 of 4 transient choppers received on-CF inhibition.
FIG. 10.
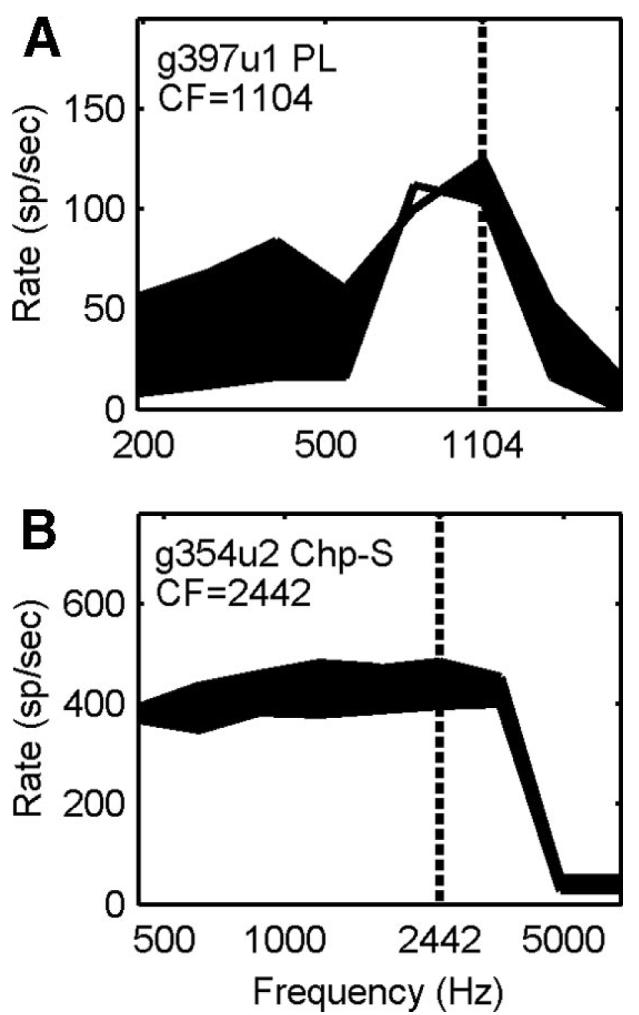
Frequency-response areas for a PL (A) and a Chp-S (B). The tone level was 80 and 70 dB SPL for the two neurons, respectively. Shaded areas indicate rate increase after blocking GABAergic inhibition with gabazine. The vertical dotted lines indicate neuron CFs.
Responses to complex sounds
RESPONSES TO SINUSOIDALLY AMPLITUDE MODULATED (SAM) TONES
Forty-eight positive-effect (based on pure-tone responses) neurons were further tested with SAM-tone stimuli (19 and 30 neurons for glycine- and GABA-receptor antagonists, respectively). Figure 11 shows changes in the rate (r-MTF) and sync (s-MTF) modulation-transfer functions after blocking inhibition for different response types. PLs (n = 17) and PLNs (n = 2) generally showed flat r-MTFs and relatively flat s-MTFs. Choppers showed low-pass (n = 9), high-pass (n = 6), band-pass (n = 2), or flat (n = 1) r-MTFs. Of course, these shapes can depend on the range of modulation frequency tested with respect to the neuron’s individual characteristics (and the choice of the range of modulation frequency was limited by the frequency boundaries in the calibration table). Half of the choppers showed band-pass s-MTFs and the other half showed low-pass s-MTFs, with maximum synchronies higher than those of primary-likes. The r-MTFs and s-MTFs of unusual and onset response types had more diverse shapes than the basic shapes described earlier (Fig. 11).
FIG. 11.

Rate (odd-numbered columns) and synchrony (even-numbered columns) modulation transfer functions (MTFs) for all neurons before and after blocking glycinergic (Gly) or GABAergic (Gab) inhibition. For rate MTFs, shaded areas indicate increased average rate after blocking inhibition. For sync MTFs, shaded areas indicate decreased synchronization to modulation frequency after blocking inhibition. The y-axis of the rate plots was from 0 to a value slightly greater than the maximum rate.
After blocking glycinergic or GABAergic inhibition, 16 of 19 and 28 of 30 neurons showed significantly increased rate (P < 0.05; Fig. 11, shaded areas in r-MTFs). Different degrees of synchrony reduction were observed (Fig. 11, shaded areas in s-MTFs; neurons were not classified into decreased or unchanged synchrony groups because it was difficult to test the significance of synchrony reduction). For example, the first two examples in Fig. 11 had large rate increases but relatively small reductions in synchrony, compared with the second neuron in the second row, which had a smaller change in rate but a large reduction in synchrony. For the 18 choppers, the correlation coefficient between maximum rate increase and maximum synchrony decrease was significant (0.70, P < 0.05); the correlation was insignificant for the 19 PLs/PLNs and the 12 unusual/onset response types (0.16 and 0.27, respectively). Blocking GABAergic inhibition generally had a greater effect on synchrony than blocking glycinergic inhibition when the effect on average rate was the same (not shown).
Changes in the phase of the phase-locked response to the SAM envelope after blocking inhibition can indicate the temporal relationships between excitatory and inhibitory inputs. Figure 12 shows the change in phase at fm = 32 Hz, a relatively low modulation frequency, for all neurons studied. Cells that showed increased phase after blocking inhibition received inhibition that affected the later part of the response more than the early part of the response in each cycle. In Fig. 12A, filled symbols indicate phase changes after blocking glycinergic inhibition and open symbols indicate phase changes after blocking GABAergic inhibition. After injection of GABA-receptor antagonists, all 12 choppers showed increased phase (open circles, increase of 0.38 -31.0°); other neurons showed mixtures of increased and decreased phase.
FIG. 12.

Change of phase vs. change of rate for sinusoidally amplitude modulated (SAM) tones with fm = 32 Hz. The x-axis is the maximum t value for a change in rate across all modulation frequencies. The y-axis is the increase of phase in degrees. In A, filled symbols indicate changes after blocking glycinergic inhibition and open symbols indicate changes after blocking GABAergic inhibition. In B, filled symbols indicate cells with early inhibition (see Fig. 10). The vertical dotted line indicates the significance criterion for t (P < 0.05).
Of the 13 neurons that showed early inhibition (an increase of FSL >0.8 ms), 11 were tested with SAM tones. Figure 12B marks the phase changes for cells with early inhibition with filled symbols (glycinergic and GABAergic inhibition were not differentiated here). Eight of the 12 filled symbols (one unusual response type was tested for both inhibitory receptor antagonists) showed decreased phase after blocking inhibition. Thus for these neurons, the inhibitory response generally discharged earlier than the excitatory response throughout the sustained response to the SAM tones. Four neurons with this early inhibition showed invariant or increased SAM phase after blocking inhibition. For these four cells, the early inhibition affected the onset, but inhibition later in the response did not necessarily precede excitation within each modulation cycle.
Inhibition that was stronger at certain stimulus phases than at others within a modulation cycle was referred to as phasic inhibition. Relatively constant inhibition was referred to as tonic inhibition. Note that tonic inhibition did not necessarily mean that the inhibitory interneuron discharged constantly all the time. Inhibitory inputs were likely to be tuned and phase-locked to the modulation frequency since, at low modulation frequencies (e.g., fm = 32 Hz), the phase of the SAM-tone responses changed after blocking inhibition for about 85% of cells studied (Fig. 12). However, for cells that receive dendritic inhibitory inputs, the dendrites of the target neuron may have smoothed the phase-locked inhibition enough to obscure a phasic effect. An intracellular study by White et al. (1994) characterized the low-pass-filtering effect of dendrites for VCN choppers. Based on the extracellularly recorded spike times in the present study, no clear low-pass-filtering property could be identified.
To further explore the tonic or phasic effects of inhibition, simulated tonic inhibition was added to the SAM-tone responses recorded after blocking inhibition. Specifically, a constant value was subtracted from a period histogram so that the remaining number of spikes was equal to the number of spikes before blocking inhibition for a particular modulation frequency. Note that this simulation approach assumed that the effect of inhibition was linear on firing rate, which has been suggested to describe somatic shunting inhibitory inputs (Koch 1999). Although this may not be strictly the case in reality, the simulation provides insight concerning the rate changes that were observed. Because the rate increase caused by blocking inhibition can differ across modulation frequencies, the subtracted constant value was varied with modulation frequency, based on the assumption that the tonic inhibition was tuned to modulation frequency. Figure 13A shows the SAM-tone responses of a PL before (thin solid line) and after (thin dotted line) blocking GABAergic inhibition. After subtracting out a simulated tonic inhibition, the rate difference disappeared, whereas the synchrony difference remained (Fig. 13A, middle, thick dotted line). Thus constant inhibition did not predict the observed change in synchrony for this PL neuron. In contrast, for the chopper in Fig. 13B, constant inhibition predicted most of the difference in synchrony except at high modulation frequencies (Fig. 13B, middle, thick dotted line). Comparing the period histograms at fm = 32 Hz (Fig. 13, bottom row), it was clear that the shape of the period histogram for the PL changed after blocking inhibition, whereas the period histogram for the chopper had parallel shifts in rate without a shape change in the period histogram. Of course, this simulated tonic inhibition can also create an increase in synchrony (eight cells), as shown in Fig. 13C; the increase in synchrony was also an effect of phasic inhibition.
FIG. 13.

Responses to SAM tones of 3 neurons before and after blocking GABAergic (A and B) and glycinergic (C) inhibition. Top and middle rows: rate (r-MTF) and sync (s-MTF) modulation-transfer function, respectively. Bottom row: the period histogram at fm = 32 Hz (2 identical cycles are shown for the purpose of illustration). The thin solid and dashed lines represent responses before and after blocking inhibition. The thick dotted line represents responses with simulated tonic inhibition (the r-MTF with simulated tonic inhibition is the same as the r-MTF of the control). CF = 1,031, 1,476, and 1,103 Hz for the neurons in A, B, and C, respectively.
Figure 14 shows the effect of adding simulated tonic inhibition on the difference of synchrony between control responses and responses after blocking inhibition. Note that the maximum synchrony change could occur at either low or high modulation frequencies; thus by using the maximum synchrony, the result can be biased depending on the corresponding best modulation frequency . Therefore in Fig. 14, the difference of synchrony was the average value at all modulation frequencies <. Symbols close to the diagonal indicate neurons for which there was little or no change of synchrony by adding simulated tonic inhibition. Symbols under the diagonal indicate neurons for which the simulated tonic inhibition was able to more or less account for the synchrony difference.
FIG. 14.

Synchrony decrease with simulated tonic inhibition vs. synchrony decrease after blocking inhibition. First, the modulation frequency that resulted in a maximal decrease in synchrony after blocking inhibition was identified. Then the average change of synchrony at all modulation frequencies ≤ was computed. Filled symbols indicate responses studied after application of glycine antagonists; open symbols indicate application of γ-amino-butyric acid (GABA) antagonists.
For all but one chopper, the difference of synchrony between control responses and those after inhibition was blocked can be more or less accounted for by subtracting constant activity, especially for choppers injected with GABA-receptor antagonists (open circles). Combining the results from Fig. 14 with Fig. 12A, which shows increased phase at fm = 32 Hz for all choppers after blocking GABAergic inhibition, the following conclusions can be made. GABAergic inhibition received by choppers was smoothed and probably delayed. (The “delay” could be either a synaptic delay or a smoothing effect.) At very low modulation frequencies, phasic properties were observed. At mid- and high-modulation frequencies, the inhibition appeared to be tonic. The effect of glycinergic inhibition on choppers was unclear because the sample size was small (n = 6) and the observations were varied. For PL, PLN, unusual, and onset types, the symbols are closer to the diagonal (with some exceptions of unusuals) (Fig. 14).
RESPONSES TO TONES IN NOISE
Forty-seven neurons that showed positive effects were further tested with tone-in-noise stimuli (n = 19 and 30 for glycine- and GABA-receptor antagonists, respectively; 2 of 47 showed positive effects for both inhibitory receptor antagonists). The example shown in Fig. 15A represented the observations made for most AVCN neurons: after blocking inhibition, the average rate increased by a similar amount in response to different tone levels in the presence of a 30-dB SPL (spectrum level) noise (thick lines). This consistent change in the response across tone levels was called a “parallel change” (Caspary et al. 1993). Filled squares indicate that, at a given tone level, the difference in average rate between the response to the tone-plus-noise and that of the noise alone had a d’ >1 (Gai and Carney 2006). For the chopper illustrated in Fig. 15A, the detection threshold (lowest tone level for which d’ = 1) based on the neural responses was 70 dB SPL both before and after blocking GABAergic inhibition. Occasionally, the detection threshold based on average rate changed, as shown in Fig. 15B.
FIG. 15.

A and B: average discharge rates for tones in noise (T + N) and same-duration tones (T) before and after blocking GABAergic inhibition for 2 choppers. Small shifts were added to the plotted tone levels to avoid overlap of error bars. The responses to noises alone are marked as X on the abscissa. The filled squares indicate increases of average rate compared with the response to noise alone with d’ >1 (Gai and Carney 2006). C: percentage of rate increase for the maximum tone-alone responses across tone level (T) vs. percentage of rate increase for noise alone (N). Filled symbols indicate responses studied with application of glycine antagonists; open symbols indicate application of GABA antagonists. One unusual response that showed 237% (504%) rate increase to T (N) and one chopper that showed 254% (279%) rate increase to T (N) are not plotted because the numbers of rate changes were so large (both were injected with bicuculline). CF = 1,476 and 1,579 Hz for the neurons in A and B, respectively.
Ten of 49 neurons showed changes in detection threshold.3 Specifically, after blocking inhibition, 4 of 31 PL, PLN, unusual, and onset response types showed threshold increases from the highest level tested to unmeasurable thresholds; 5 of 18 choppers showed thresholds decrease from the unmeasurable thresholds to the highest level tested; and one of 18 choppers showed a threshold increase from 60 to 70 dB SPL. Because of the small sample size, it was not possible to determine whether the difference in direction of the response changes for different response types was a general result.
Figure 15, A and B also shows the average rate in response to long-duration pure tones (250 ms; thin lines). If an inhibitory interneuron responded actively to broadband noise but weakly to tones (as expected for D-stellate cells; Rhode and Greenberg 1994), blocking inhibition should increase responses to noise more than to tones. On the contrary, if an inhibitory interneuron responded weakly to broadband noise but actively to tones (as expected for vertical cells; Gibson et al. 1985), blocking inhibition should increase responses to tones more than to noise. Because tone responses were recorded at several tone levels, the maximum response was used for comparison to noise-alone responses. Figure 15C shows rate increases to noise-alone (N) versus to tone-alone (T) stimuli after blocking glycinergic (filled symbols) or GABAergic inhibition (open symbols). Twenty-four neurons (49%) showed an increase in rate of ≥10% in response to noise after blocking inhibition (above the diagonal), 2 (4%) showed stronger responses to tones (below the diagonal), and 23 (47%) showed <10% rate increase for either stimulus (close to the diagonal). No obvious difference was observed for different types of antagonists. For glycinergic inhibition, the results suggested a higher possibility of these neurons receiving inhibitory projections from D-multipolar neurons (neurons that respond more strongly to noise than to tones). This issue is subsequently discussed further.
Gai and Carney (2006) tested several temporal metrics (related to stimulus fine structure or envelope and to discharge reliability) on tone-in-noise responses of AVCN neurons and made comparisons to changes in the average discharge rate and to psychophysical detection thresholds. In the present study, detection thresholds based on these temporal metrics were not consistently altered by blocking inhibition (not shown).
DISCUSSION
Average discharge rate in response to CF tones
Although all neurons with positive effects showed significant increases in average rate for at least one sound level, blocking GABAergic inhibition generally had a greater effect on average rate than that of blocking glycinergic inhibition. Whether a neuron received inhibitory inputs was unrelated to its maximum tone-evoked rate, similar to findings in the IC (Le Beau et al. 1996). An interesting finding was that the presence or absence of inhibition was more related to the original SR (Fig. 9A); neurons that had an original SR >45 spikes/s, which were all PLs or PLNs, never showed a positive effect after blocking inhibition.
Although rate saturation was frequently observed for PL response types (Fig. 6), all control rate-level functions monotonically increased with tone level, whereas Kopp-Scheinpflug et al. (2002) reported nonmonotonic rate-level functions for half of their neurons with prepotentials (five of ten units). After blocking inhibition, that study reports that rate-level functions for two of the five units became monotonic, whereas the others remained nonmonotonic. In the present study, the shape of rate-level functions for PLs did not change as dramatically as observed in their study. Because a change in the shape of the rate-level function was also not observed for long-duration tones (250 ms, interleaved with the tone-plus-noise stimuli), the difference between the two studies was not caused by different stimulus durations (tone duration was 100 ms in the previous study). The difference between studies may have been caused by different recording sites. All recordings in Kopp-Scheinpflug et al. (2002) had prepotentials, whereas prepotentials were never observed for the neurons included in the present study. This difference suggested that the recording sites in the present study were relatively caudal in the AVCN and did not include the rostral region where bushy cells receive large endbulbs of Held (Pfeiffer 1966; Shofner and Young 1985).
Inhibition influences temporal responses of choppers
Changes in the temporal response patterns in the PSTH after blocking inhibition were observed for AVCN choppers and some of the observations agreed with the findings reported for 15 PVCN choppers and 4 AVCN choppers after injecting GABA (Ebert and Ostwald 1995b). For example, the presence of inhibition reduced the number of chopping cycles and slowed the chopping frequency. Ebert and Ostwald described results for 50-ms-tone bursts, including the regularity for the first 20 ms and the last 20 ms. The regularity of sustained choppers decreases most during the last 20 ms and the sustained choppers become more similar to transient choppers. The regularity of transient choppers, whose chopping patterns exist within the first 20 ms only, decreases most during the first 20 ms; i.e., transient choppers become more transient.
Based on these findings, Ebert and Ostwald concluded that (delayed) inhibitory inputs might be responsible for creating the transient pattern, which supports the hypothesis in a modeling study of choppers (Banks and Sachs 1991). However, as briefly mentioned in the INTRODUCTION, the use of inhibitory receptor agonists to study inhibitory inputs may have some shortcomings, which might be the major cause of different conclusions between that study and the present study. The injected constant (tonic) inhibition can differ from the actual inhibition received by the neuron and the effect of the “excessive” inhibition can differ from that of the actual inhibition. Also, the modeling study of Hewitt and Meddis (1993) showed that by varying the parameters of excitatory synapses (e.g., location and strength), transient chopping patterns can be created without inhibitory inputs. Therefore although adding more inhibition to transient choppers can further reduce the chopping regularity at the early part of the response, the possibility that the later part of the irregular response was created by excitatory inputs cannot be ruled out. Using a more direct method of injecting inhibitory receptor antagonists, the present study showed that for all but one transient chopper, blocking inhibition extended the chopping for only several milliseconds. For these neurons, excitatory inputs were presumably responsible for creating the transient pattern. Only one transient chopper became a sustained chopper after blocking inhibition. In fact, slowly adapting choppers were more likely to be generated by sustained choppers receiving inhibition; three of five slowly adapting choppers became sustained choppers after blocking inhibition. Therefore the present study concluded that although inhibitory inputs are sometimes able to convert chopping response types, excitatory inputs determine the basic chopping patterns.
Changes in mean FSL for choppers were small (<0.8 ms), although this change was sometimes significant due to the small variation in FSL for choppers. Palombi and Caspary (1992) reported that 75% of PVCN neurons (mostly choppers) have decreased FSL with an average change of 0.5 ms after blocking GABAergic inhibition. In the IC, a small number of sustained and unclassified neurons also show FSL reduction (Le Beau et al. 1996). The present study found both increased and decreased FSLs for choppers after blocking inhibition (Fig. 8). For choppers, the FSL is related to the integration time across a large number of inputs (van Gisbergen et al. 1975; Young et al. 1988). The presence of inhibition can delay only the integration time; therefore the variation of FSL by inhibition is limited. To account for the decreased FSL by blocking inhibition, one possibility was that the inhibition arrived at the same time as, or earlier than, the excitation. This conclusion was counterintuitive since, in previous brain-slice studies, electrically shocking ANFs always caused delayed IPSPs (e.g., Ferragamo et al. 1998a; Oertel 1983). Other possibilities include some source of spontaneously active inhibition that was present for the in vivo experiments, such as inputs from outside the CN, and inhibition that had a lower threshold than that of the excitation.
Labeling studies have shown that both glycinergic and GABAergic endings tend to be located on the dendrites of stellate cells (Saint Marie et al. 1989; Wenthold et al. 1988) and on the somas of bushy cells. Correspondingly, as stated earlier, the effect of inhibition on chopper responses was expected to be smooth as a function of time. Prolonged chopping cycles in the presence of inhibition indicated that the temporal summation of many small EPSPs to reach discharge threshold was delayed by a relatively constant hyperpolarization. This hyperpolarization might build up over time to change sustained choppers into slowly adapting choppers. The SAM-tone responses of the choppers also supported this hypothesis. The enhancement of inhibition for these choppers could be largely predicted by simulated tonic inhibition (Fig. 14), especially for synchrony changes caused by blocking GABAergic inhibition.
In addition, changes in the frequency-response area after blocking inhibition indicate that all chopping response types were dominated by on-CF or broad inhibition. This observation was not consistent with the hypothesis by Paolini et al. (2005) that the regularity of choppers is determined by the overlap of excitatory and inhibitory areas and that sustained choppers thus receive lateral inhibition.
Inhibition influences temporal responses of PL, PLN, unusual, and onset types
More diverse changes in the short-tone PSTHs were observed for PL, PLN, unusual, and onset types after blocking inhibition. Some neurons exhibited relatively constant inhibition over time and others changed more dramatically at certain time points. It was difficult to describe a general effect of inhibitory inputs for these neurons.
Neurons such as spherical bushy cells receive relatively fewer excitatory and inhibitory inputs and their membrane properties prevent temporal summation (Manis and Marx 1991; Oertel 1983). As mentioned earlier, when neurons exhibited phase-locking to tone frequency, blocking inhibition did not significantly change the phase of the response. Therefore temporal summation must have been minimal in these neurons and the role of inhibition was not to influence integration time, which is the short time required for the membrane potential to reach the firing threshold. Instead, the inhibition was more likely to suppress individual postsynaptic spikes than to delay their timing. The observed diversity in the changes of responses caused by blocking inhibition also indicated that the role of inhibition might be quite different from neuron to neuron even within the same cell type.
The SAM-tone responses of the PL, PLN, unusual, and onset types showed that both increases and decreases in phase occurred at low-modulation frequencies after blocking inhibition. In contrast, choppers were more frequently observed to have increased phase. Moreover, results with simulated tonic inhibition suggested that the change of synchrony after blocking inhibition for these neuron types was less likely to be explained by smooth inhibition (hyperpolarization) compared with choppers (Fig. 14). Combined with the minimal temporal summation described earlier, the effect of inhibition on bushy cells was less uniform over time.
Cells that showed a decrease in FSL of >0.8 ms were categorized in this study as having early inhibition. These long FSLs have not been explicitly reported in previous studies. Blocking inhibition sometimes revealed a precisely timed early onset that was not present in the control response. A strong, constant (tonic) inhibition was not likely to account for this phenomenon because it would have also blocked most of the later responses. Changes in membrane potentials and ionchannel activity may have also affected the FSL. For example, in vitro intracellular recordings from DCN principal cells show that the FSL can be highly varied by changing the steady hyperpolarization (Manis 1990). That is, holding the membrane potential hyperpolarized before a depolarizing current occurred increased the FSL of a cell in response to the depolarizing current. In the present study, if an AVCN neuron had similar membrane properties and the hyperpolarization was related to inhibitory channels, blocking the inhibitory receptors could have contributed to the decrease of FSL. Future in vitro study is required to test whether a similar phenomenon would be observed for AVCN PL/unusual neurons. However, our present extracellular study was inadequate to identify the specific mechanism that accounted for the change of FSL.
Another general difference between PL/unusual neurons and choppers was that more than half of neurons in the first group showed off-CF inhibition, whereas the majority of choppers showed on-CF inhibition. If one possible role of inhibition was to enhance frequency contrast, then this role was more prominent for PL/unusual neurons.
AVCN bushy cells (PLs and PLNs) send major ascending inputs to the binaural nuclei. At low and mid CFs, bushy cells generally show enhanced synchronization to tone frequency (Joris et al. 1994) compared with ANFs, which is reasonable since fine-timing information is critical for the low-frequency binaural system. However, findings related to FSL in the present study suggest that at least some bushy cells might possess a more complex information-processing mechanism.
Inhibition and temporal contrast
The present study did not find global enhancement of temporal contrast in AVCN responses. First, although spontaneous activity had a larger change than tone-evoked activity in terms of percentage of rate change, the significance of the change (t values) in spontaneous activity was generally smaller than the significance of the change in tone-evoked activity. More important, the change in spontaneous activity was weakly correlated to the drug effect. Second, blocking inhibition did not always have a greater effect on sustained activity than on onset activity. On the contrary, the FSL for a number of neurons varied substantially. Instead of showing a less distinct onset peak after blocking inhibition, as suggested by previous studies (Ebert and Ostwald 1995a,b; Kopp-Scheinpflug et al. 2002), a number of neurons showed a more distinct onset. Palombi and Caspary (1992) also reported that the mean value and variability of the FSL are reduced after application of bicuculline for PVCN neurons. Although the underlying mechanism for changing the FSL was unclear, inhibitory inputs did seem to affect the onset activity more than the sustained activity for some AVCN neurons.
Third, in the presence of a relatively high level background noise, inhibitory inputs did not have a stronger suppressive effect on responses to noise alone than on responses to tones plus noise. After blocking inhibition, the majority of cells had rate increases that were similar in size for noise-alone and noise-plus-tone stimuli at different tone levels. When comparing responses to noise-alone and tone-alone stimuli, the majority of AVCN neurons showed greater rate changes in response to noise stimuli than in response to pure tones (Fig. 15C). That is, inhibition seemed to have a stronger effect on noise responses than on pure-tone responses. However, this differential effect was not strong enough to facilitate the detection of tones in noise based on discharge rate. The finding by Ebert and Ostwald (1995a) that inhibition has a strong suppressive effect on background-noise activity but a minimal effect on responses to a tone added to the noise might be related to the low noise level they used. (The tone level was ∼25 dB above discharge threshold; the overall noise level was 10 dB below the tone level, e.g., 0 -10 dB SPL spectrum level; and the noise bandwidth was ∼20 kHz.) Moreover, that study injected inhibitory receptor agonists. As mentioned earlier, applying inhibitory receptor agonists creates a source of constant inhibition, which presumably differs from the actual inhibition received by neurons. For example, if an inhibitory interneuron does not respond actively to noise, no suppression of the background-noise activity of the target neuron should be observed. On the contrary, applying inhibitory receptor antagonists might generate more “meaningful” responses (i.e., the behavior of a neuron with only excitatory inputs). Applying inhibitory receptor antagonists removes the effect of inhibition only when the inhibition is active.
Instead, the present study agrees with the findings of Caspary et al. (1993), who compared broadband-noise responses at different noise levels to CF-tone responses at different tone levels for spherical bushy cells using inhibitory receptor antagonists and agonists. They reported that inhibition has similar effects on noise responses and pure-tone responses, which did not support the idea of inhibition enhancing temporal contrast. (Tone-in-noise stimuli were not used in that study.)
Finally, analysis of responses to the SAM tones in the present study agrees with previous reports in the PVCN and DCN (Backoff et al. 1999) that inhibitory inputs generally enhance the synchronization to AM and thereby enhance the temporal contrast. However, the enhancement did not always exist because different degrees of synchrony reduction were observed for different neurons after blocking inhibition. The present study also found that GABAergic inhibition was more effective in enhancing synchrony than glycinergic inhibition. Enhanced synchronization was not always caused by a cycle-by-cycle shaping effect of the inhibition (phasic inhibition), but was also caused by a constant reduction of activity (tonic inhibition). Although tonic and phasic inhibition were analytically separated in this study, in reality there may not be a clear boundary between these two inhibitory profiles. In fact, it was hypothesized that most inhibitory interneurons were synchronized to AM, since 85% of AVCN neurons showed changes in phase at low-modulation frequencies after blocking inhibition. However, the smoothing effect of dendrites that received inhibitory inputs may have prevented observation of synchrony in the inhibition, especially at mid- and high-modulation frequencies where the smoothing was effectively longer than a modulation cycle. By analyzing phase changes after blocking inhibition in responses to SAM stimuli with a low modulation frequency (32 Hz), it was found that the majority of choppers with positive effects in response to inhibitory receptor blockers showed increased phase after blocking GABAergic inhibition. This result indicates that the inhibition was synchronized to AM and was effectively delayed with respect to excitation (Fig. 12).
Possible sources of inhibition
By comparing the effect of inhibition on responses to broad-band noise and pure tones, this study provides useful information about the identity of inhibitory neurons that projected to AVCN neurons. In this study, 49% of cells showed stronger responses to noise after blocking inhibition, whereas only 4% showed stronger responses to tones. This result suggested that for glycinergic inhibition, there were possibly fewer vertical neurons (which respond more strongly to tones) than D-stellate neurons (which respond more strongly to noise) that projected to the AVCN neurons studied here. However, for the 47% of cells that showed similar increases in rate for noise-alone and tone-alone stimuli, it was likely that a mixture of inputs from D-stellate and vertical neurons compromised each other’s effects. This result represents a challenge for models of AVCN neurons because of the difficulty in determining the proportions or strength of inhibitory inputs from each type of inhibitory neurons. For bushy cells, different types of models with different sources and functions of inhibitory inputs would be required to explain the observed diversity in the PSTHs. In contrast, models for stellate cells can be relatively homogeneous because the general effect of inhibition was similar to a constant hyperpolarization.
Commissural inhibition from the other cochlear nucleus was not considered a major source of glycinergic inhibitory activity in the present study because sound was not delivered to the contralateral ear. In addition, Wenthold (1987) showed that neurons in the contralateral CN with commissural projections are large stellate cells, which usually have low or medium spontaneous activity (Blackburn and Sachs 1989; Smith and Rhode 1989). Therefore even if there were commissural projections to the neurons described in the present study, these inputs would not have provided significant sound-driven or spontaneous IPSPs.
Response properties of other inhibitory interneurons, especially those located in the SOC, are unclear. Neurons in the SOC that project bilaterally to the IC receive descending inputs from the IC and descending pathways from other high auditory levels to the CN also exist (Schofield and Cant 1999). As stated in the introduction, the major GABAergic inputs were assumed to come from the SOC. GABAergic inhibition generally had greater effects on both average rate and temporal responses of AVCN neurons; therefore descending GABAergic inputs apparently play an important role in information processing by AVCN neurons. Identification of the inhibitory inputs from the SOC and knowledge of their response properties would facilitate future studies of the effects of inhibition on responses of AVCN neurons.
ACKNOWLEDGMENTS
We thank D. Caspary for the generous contribution of advice, expertise, and instruction in the application of the iontophoresis technique; S. Chase for providing an efficient algorithm for computing the first-spike latency; S. Kuwada and L. Pawson for advice and assistance with the piggyback electrodes; S. Early for editorial assistance; and K. Abrams, B. Dossert, and the staff of the LAR for help with the animals and experimental setup.
GRANT
This study was supported by National Institute on Deafness and Other Communication Disorders Grant DC-01641.
Footnotes
The GABAergic inhibition described here refers only to GABAA-receptor-mediated inhibition, not GABAB, although both are present in the VCN (Altschuler et al. 1986). Ebert and Ostwald (1995a) reported that injecting GABAA-receptor antagonist muscimol had significant effects on neurons that responded to GABA injection, whereas injecting the GABAB-receptor antagonist baclofen on the same neurons showed small effects that were not consistent with the GABA effect.
The ×100 microscope became available after the first nine positive-effect neurons (from experiments g340-g354) had been studied. Before the introduction of the microscope, neurons without a positive effect were excluded from this study unless the same penetration yielded other positive-effect neurons.
One PL showed a threshold increase from 70 to 75 dB SPL. This was not considered to be a real threshold increase, since the testing tone levels were mistakenly offset by 5 dB after blocking inhibition.
The costs of publication of this article were defrayed in part by the payment of page charges. The article must therefore be hereby marked “advertisement” in accordance with 18 U.S.C. Section 1734 solely to indicate this fact.
REFERENCES
- Altschuler RA, Betz H, Parakkal MH, Reeks KA, Wenthold RJ. Identification of glycinergic synapses in the cochlear nucleus through immunocytochemical localization of the postsynaptic receptor. Brain Res. 1986;369:316–320. doi: 10.1016/0006-8993(86)90542-1. [DOI] [PubMed] [Google Scholar]
- Arnott RH, Wallace MN, Shackleton TM, Palmer AR. Onset neurons in the anteroventral cochlear nucleus project to the dorsal cochlear nucleus. J Assoc Res Otolaryngol. 2004;5:153–170. doi: 10.1007/s10162-003-4036-8. [DOI] [PMC free article] [PubMed] [Google Scholar]
- Babalian AL, Jacomme AV, Doucet JR, Ryugo DK, Rouiller EM. Commissural glycinergic inhibition of bushy and stellate cells in the anteroventral cochlear nucleus. Neuroreport. 2002;13:555–558. doi: 10.1097/00001756-200203250-00038. [DOI] [PubMed] [Google Scholar]
- Backoff PM, Palombi PS, Caspary DM. γ-Aminobutyric acidergic and glycinergic inputs shape coding of amplitude modulation in the chinchilla cochlear nucleus. Hear Res. 1999;134:77–88. doi: 10.1016/s0378-5955(99)00071-4. [DOI] [PubMed] [Google Scholar]
- Banks MI, Sachs MB. Regularity analysis in a compartmental model of chopper units in the anteroventral cochlear nucleus. J Neurophysiol. 1991;65:606–629. doi: 10.1152/jn.1991.65.3.606. [DOI] [PubMed] [Google Scholar]
- Blackburn CC, Sachs MB. Classification of unit types in the anteroventral cochlear nucleus: PST histograms and regularity analysis. J Neurophysiol. 1989;62:1303–1329. doi: 10.1152/jn.1989.62.6.1303. [DOI] [PubMed] [Google Scholar]
- Caspary DM, Backoff PM, Finlayson PG, Palombi PS. Inhibitory inputs modulate discharge rate within frequency receptive fields of anteroventral cochlear nucleus neurons. J Neurophysiol. 1994;72:2124–2133. doi: 10.1152/jn.1994.72.5.2124. [DOI] [PubMed] [Google Scholar]
- Caspary DM, Havey DC, Faingold CL. Effects of microiontophoretically applied glycine and GABA on neuronal response patterns in the cochlear nuclei. Brain Res. 1979;172:179–185. doi: 10.1016/0006-8993(79)90909-0. [DOI] [PubMed] [Google Scholar]
- Caspary DM, Palombi PS, Backoff PM, Helfert RH, Finlayson PG. GABA and glycine inputs control discharge rate within the excitatory response area of primary-like and phase-locked AVCN neurons. In: Merchán MA, Juiz JM, Godfrey RA, Mugnaini E, editors. The Mammalian Cochlear Nuclei: Organization and Function. Plenum Press; New York: 1993. pp. 239–252. [Google Scholar]
- Chase SM, Young ED. First-spike latency information in single neurons increases when referenced to population onset. Proc Natl Acad Sci USA. 2007;104:5175–5180. doi: 10.1073/pnas.0610368104. [DOI] [PMC free article] [PubMed] [Google Scholar]
- Costalupes JA. Broadband masking noise and behavioral pure tone thresholds in cats. I. Comparison with detection thresholds. J Acoust Soc Am. 1983;74:758–764. doi: 10.1121/1.389863. [DOI] [PubMed] [Google Scholar]
- Ebert U, Ostwald J. GABA can improve acoustic contrast in the rat ventral cochlear nucleus. Exp Brain Res. 1995a;104:310–322. doi: 10.1007/BF00242016. [DOI] [PubMed] [Google Scholar]
- Ebert U, Ostwald J. GABA alters the discharge pattern of chopper neurons in the rat ventral cochlear nucleus. Hear Res. 1995b;91:160–166. doi: 10.1016/0378-5955(96)83100-5. [DOI] [PubMed] [Google Scholar]
- Ferragamo MJ, Golding NL, Oertel D. Synaptic inputs to stellate cells in the ventral cochlear nucleus. J Neurophysiol. 1998a;79:51–63. doi: 10.1152/jn.1998.79.1.51. [DOI] [PubMed] [Google Scholar]
- Ferragamo MJ, Golding NL, Oertel D. Golgi cells in the superficial granule cell domain overlying the ventral cochlear nucleus: morphology and electrophysiology in slices. J Comp Neurol. 1998b;400:519–528. [PubMed] [Google Scholar]
- Gai Y, Carney LH. Temporal measures and neural strategies for detection of tones in noise based on responses in anteroventral cochlear nucleus. J Neurophysiol. 2006;96:2451–2464. doi: 10.1152/jn.00471.2006. [DOI] [PMC free article] [PubMed] [Google Scholar]
- Gibson DJ, Young ED, Costalupes JA. Similarity of dynamic range adjustment in auditory nerve and cochlear nuclei. J Neurophysiol. 1985;53:940–958. doi: 10.1152/jn.1985.53.4.940. [DOI] [PubMed] [Google Scholar]
- Giguère C, Woodland PC. A computational model of the auditory periphery for speech and hearing research. I. Ascending path. J Acoust Soc Am. 1994;95:331–342. doi: 10.1121/1.408366. [DOI] [PubMed] [Google Scholar]
- Goldberg JM, Brownell WE. Discharge characteristics of neurons in anteroventral and dorsal cochlear nuclei of cat. Brain Res. 1973;64:35–54. doi: 10.1016/0006-8993(73)90169-8. [DOI] [PubMed] [Google Scholar]
- Havey DC, Caspary DM. A simple technique for constructing “piggy-back” multibarrel microelectrodes. Electroencephalogr Clin Neurophysiol. 1980;48:249–251. doi: 10.1016/0013-4694(80)90313-2. [DOI] [PubMed] [Google Scholar]
- Helfert RH, Bonneau JM, Wenthold RJ, Altschuler RA. GABA and glycine immunoreactivity in the guinea pig superior olivary complex. Brain Res. 1989;501:269–286. doi: 10.1016/0006-8993(89)90644-6. [DOI] [PubMed] [Google Scholar]
- Hewitt MJ, Meddis R. Regularity of cochlear nucleus stellate cells: a computational modeling study. J Acoust Soc Am. 1993;93:3390–3399. doi: 10.1121/1.405694. [DOI] [PubMed] [Google Scholar]
- Joris PX, Carney LH, Smith PH, Yin TC. Enhancement of neural synchronization in the anteroventral cochlear nucleus. I. Responses to tones at the characteristic frequency. J Neurophysiol. 1994;71:1022–1036. doi: 10.1152/jn.1994.71.3.1022. [DOI] [PubMed] [Google Scholar]
- Koch C. Biophysics of Computation: Information Processing in Single Neurons. Oxford Univ. Press; New York: 1999. Synaptic input to a passive tree; pp. 423–426. [Google Scholar]
- Kolston J, Osen KK, Hackney CM, Ottersen OP, Storm-Mathisen J. An atlas of glycine- and GABA-like immunoreactivity and colocalization in the cochlear nuclear complex of the guinea pig. Anat Embryol (Berl) 1992;186:443–465. doi: 10.1007/BF00185459. [DOI] [PubMed] [Google Scholar]
- Kopp-Scheinpflug C, Dehmel S, Dörrscheidt GJ, Rübsamen R. Interaction of excitation and inhibition in anteroventral cochlear nucleus neurons that receive large endbulb synaptic endings. J Neurosci. 2002;22:11004–11018. doi: 10.1523/JNEUROSCI.22-24-11004.2002. [DOI] [PMC free article] [PubMed] [Google Scholar]
- Le Beau FE, Rees A, Malmierca MS. Contribution of GABA- and glycine-mediated inhibition to the monaural temporal response properties of neurons in the inferior colliculus. J Neurophysiol. 1996;75:902–919. doi: 10.1152/jn.1996.75.2.902. [DOI] [PubMed] [Google Scholar]
- Liberman MC. Auditory-nerve response from cats raised in a low-noise chamber. J Acoust Soc Am. 1978;63:442–455. doi: 10.1121/1.381736. [DOI] [PubMed] [Google Scholar]
- Manis P. Membrane properties and discharge characteristics of guinea pig dorsal cochlear nucleus neurons studied in vitro. J Neurosci. 1990;10:2338–2351. doi: 10.1523/JNEUROSCI.10-07-02338.1990. [DOI] [PMC free article] [PubMed] [Google Scholar]
- Manis PB, Marx SO. Outward currents in isolated ventral cochlear nucleus neurons. J Neurosci. 1991;11:2865–2880. doi: 10.1523/JNEUROSCI.11-09-02865.1991. [DOI] [PMC free article] [PubMed] [Google Scholar]
- Müller Ch-M. Intracellular microelectrodes. In: Kettenmann H, Grantyn R, editors. Practical Electrophysiological Methods. Wiley-Liss; New York: 1992. pp. 183–188. [Google Scholar]
- Oertel D. Synaptic responses and electrical properties of cells in brain slices of the mouse anteroventral cochlear nucleus. J Neurosci. 1983;3:2043–2053. doi: 10.1523/JNEUROSCI.03-10-02043.1983. [DOI] [PMC free article] [PubMed] [Google Scholar]
- Oertel D, Wickesberg RE. Glycinergic inhibition in the cochlear nuclei: evidence for tuberculoventral neurons being glycinergic. In: Merchán MA, Juiz JM, Godfrey RA, Mugnaini E, editors. The Mammalian Cochlear Nuclei: Organization and Function. Plenum Press; New York: 1993. pp. 411–420. [Google Scholar]
- Ostapoff EM, Benson CG, Saint Marie RL. GABA- and glycine-immunoreactive projections from the superior olivary complex to the cochlear nucleus in guinea pig. J Comp Neurol. 1997;381:500–512. doi: 10.1002/(sici)1096-9861(19970519)381:4<500::aid-cne9>3.0.co;2-6. [DOI] [PubMed] [Google Scholar]
- Palombi PS, Caspary DM. GABAA receptor antagonist bicuculline alters response properties of posteroventral cochlear nucleus neurons. J Neurophysiol. 1992;67:738–746. doi: 10.1152/jn.1992.67.3.738. [DOI] [PubMed] [Google Scholar]
- Palombi PS, Caspary DM. GABA inputs control discharge rate primarily within frequency receptive fields of inferior colliculus neurons. J Neurophysiol. 1996;75:2211–2219. doi: 10.1152/jn.1996.75.6.2211. [DOI] [PubMed] [Google Scholar]
- Paolini AG, Clarey JC, Needham K, Clark GM. Balanced inhibition and excitation underlies spike firing regularity in ventral cochlear nucleus chopper neurons. Eur J Neurosci. 2005;21:1236–1248. doi: 10.1111/j.1460-9568.2005.03958.x. [DOI] [PubMed] [Google Scholar]
- Rhode WS. Neural encoding of single-formant stimuli in the ventral cochlear nucleus of the chinchilla. Hear Res. 1998;117:39–56. doi: 10.1016/s0378-5955(98)00002-1. [DOI] [PubMed] [Google Scholar]
- Rhode WS, Greenberg S. Encoding of amplitude modulation in the cochlear nucleus of the cat. J Neurophysiol. 1994;71:1797–1825. doi: 10.1152/jn.1994.71.5.1797. [DOI] [PubMed] [Google Scholar]
- Robert A, Eriksson JL. A composite model of the auditory periphery for simulating responses to complex sounds. J Acoust Soc Am. 1999;106:1852–1864. doi: 10.1121/1.427935. [DOI] [PubMed] [Google Scholar]
- Saint Marie RL, Morest DK, Brandon CJ. The form and distribution of GABAergic synapses on the principal cell types of the ventral cochlear nucleus of the cat. Hear Res. 1989;42:97–112. doi: 10.1016/0378-5955(89)90120-2. [DOI] [PubMed] [Google Scholar]
- Schofield BR, Cant NB. Descending auditory pathways: projections from the inferior colliculus contact superior olivary cells that project bilaterally to the cochlear nuclei. J Comp Neurol. 1999;409:210–223. doi: 10.1002/(sici)1096-9861(19990628)409:2<210::aid-cne3>3.0.co;2-a. [DOI] [PubMed] [Google Scholar]
- Smith PH, Rhode WS. Structural and functional properties distinguish two types of stellate cells in the ventral cochlear nucleus. J Comp Neurol. 1989;282:596–616. doi: 10.1002/cne.902820410. [DOI] [PubMed] [Google Scholar]
- Thompson AM, Schofield BR. Afferent projections of the superior olivary complex. Microsc Res Tech. 2000;51:330–354. doi: 10.1002/1097-0029(20001115)51:4<330::AID-JEMT4>3.0.CO;2-X. [DOI] [PubMed] [Google Scholar]
- van Gisbergen JAM, Grashuis JL, Johannesma PIM, Vendrik AJH. Neurons in the cochlear nucleus investigated with tone and noise stimuli. Exp Brain Res. 1975;23:387–406. doi: 10.1007/BF00238022. [DOI] [PubMed] [Google Scholar]
- Wenthold RJ. Evidence for a glycinergic pathway connecting the two cochlear nuclei: an immunocytochemical and retrograde transport study. Brain Res. 1987;415:183–187. doi: 10.1016/0006-8993(87)90285-x. [DOI] [PubMed] [Google Scholar]
- Wenthold RJ, Parakkal MH, Oberdorfer MD, Altschuler RA. Glycine receptor immunoreactivity in the ventral cochlear nucleus of the guinea pig. J Comp Neurol. 1988;276:423–435. doi: 10.1002/cne.902760307. [DOI] [PubMed] [Google Scholar]
- White JA, Young ED, Manis PB. The electrotonic structure of regular-spiking neurons in the ventral cochlear nucleus may determine their response properties. J Neurophysiol. 1994;71:1774–1786. doi: 10.1152/jn.1994.71.5.1774. [DOI] [PubMed] [Google Scholar]
- Wickesberg RE, Oertel D. Tonotopic projection from the dorsal to the anteroventral cochlear nucleus of mice. J Comp Neurol. 1988;268:389–399. doi: 10.1002/cne.902680308. [DOI] [PubMed] [Google Scholar]
- Wickesberg RE, Oertel D. Delayed, frequency-specific inhibition in the cochlear nuclei of mice: a mechanism for monaural echo suppression. J Neurosci. 1990;10:1762–1768. doi: 10.1523/JNEUROSCI.10-06-01762.1990. [DOI] [PMC free article] [PubMed] [Google Scholar]
- Young ED, Robert JM, Shofner WP. Regularity and latency of units in ventral cochlear nucleus: implications for unit classification and generation of response properties. J Neurophysiol. 1988;60:1–29. doi: 10.1152/jn.1988.60.1.1. [DOI] [PubMed] [Google Scholar]
- Zhang X, Heinz MG, Bruce IC, Carney LH. A phenomenological model for the responses of auditory-nerve fibers: I. Nonlinear tuning with compression and suppression. J Acoust Soc Am. 2001;109:648–670. doi: 10.1121/1.1336503. [DOI] [PubMed] [Google Scholar]
- Zheng L, Early SJ, Mason CR, Idrobo F, Harrison JM, Carney LH. Binaural detection with narrowband and wideband reproducible noise maskers: II. Results for rabbit. J Acoust Soc Am. 2002;111:346–356. doi: 10.1121/1.1423930. [DOI] [PubMed] [Google Scholar]
- Zilany MS, Bruce IC. Modeling auditory-nerve responses for high sound pressure levels in the normal and impaired auditory periphery. J Acoust Soc Am. 2006;120:1446–1466. doi: 10.1121/1.2225512. [DOI] [PubMed] [Google Scholar]