Abstract
Insulin resistance is a major cause of muscle wasting in patients with ESRD. Uremic metabolic acidosis impairs insulin signaling, which normally suppresses proteolysis. The low pH may inhibit the SNAT2 l-Glutamine (L-Gln) transporter, which controls protein synthesis via amino acid–dependent insulin signaling through mammalian target of rapamycin (mTOR). Whether SNAT2 also regulates signaling to pathways that control proteolysis is unknown. In this study, inhibition of SNAT2 with the selective competitive substrate methylaminoisobutyrate or metabolic acidosis (pH 7.1) depleted intracellular L-Gln and stimulated proteolysis in cultured L6 myotubes. At pH 7.1, inhibition of the proteasome led to greater depletion of L-Gln, indicating that amino acids liberated by proteolysis sustain L-Gln levels when SNAT2 is inhibited by acidosis. Acidosis shifted the dose-response curve for suppression of proteolysis by insulin to the right, confirming that acid increases proteolysis by inducing insulin resistance. Blocking mTOR or phosphatidylinositol-3-kinase (PI3K) increased proteolysis, indicating that both signaling pathways are involved in its regulation. When both mTOR and PI3K were inhibited, methylaminoisobutyrate or acidosis did not stimulate proteolysis further. Moreover, partial silencing of SNAT2 expression in myotubes and myoblasts with small interfering RNA stimulated proteolysis and impaired insulin signaling through PI3K. In conclusion, SNAT2 not only regulates mTOR but also regulates proteolysis through PI3K and provides a link among acidosis, insulin resistance, and protein wasting in skeletal muscle cells.
There is now strong evidence that, even in patients without diabetes, insulin resistance in ESRD is a major cause of muscle wasting1,2 with its attendant morbidity and increased risk for mortality. An important contributor to this clinically serious problem is uremic metabolic acidosis,3 suggesting that low pH has a significant impact on insulin signaling in uremic muscle.
The SNAT2 amino acid transporter in the plasma membrane of mammalian cells is strongly inhibited by low extracellular pH.4 We previously showed, using cultured skeletal muscle cells (L6 myotubes), that inhibition of SNAT2 rapidly depletes intracellular amino acids and thereby strongly impairs insulin signaling to protein synthesis through mammalian target of rapamycin (mTOR), which is a key sensor of amino acid availability.5 Although this provides a plausible explanation for the inhibition of muscle protein synthesis that occurs during acute metabolic acidosis in humans,6 the response of muscle to chronic uremic metabolic acidosis in renal patients usually involves increased proteolysis.7,8 A possible rationale for this chronic proteolysis is that it is an adaptation to the initial amino acid depletion, whereby amino acids are harvested from muscle protein to restore intracellular amino acid levels,9 thereby minimizing impairment of protein synthesis but at the expense of chronically elevated proteolysis.
The stimulation of proteolysis by low pH in L6 myotubes has been attributed to a defect in insulin signaling through insulin receptor substrate 1 (IRS-1)-associated phosphatidylinositol-3-kinase (PI3K), leading to impaired activation of protein kinase B (PKB),10 and a similar defect has been demonstrated in acidotic and uremic rat skeletal muscle in vivo.11 Unlike mTOR signaling, type I PI3K signaling to PKB is not traditionally regarded as an amino acid–sensitive pathway, suggesting that inhibition of SNAT2 by acidosis is not responsible for this effect; however, a type III PI3K has been implicated in amino acid sensing by mTOR.12 There is also evidence from amino acid–starved L6 myotubes that extracellular amino acid concentration is sensed through SNAT2, which acts as a signaling protein in its own right—a so-called “transceptor”13 that signals to SNAT2 gene expression.13 This signal is blunted by inhibitors of PI3K,13 suggesting that coupling exists between SNAT2 and this enzyme. It is not known, however, whether such coupling influences PI3K signaling to PKB and proteolysis.
The aims of this study were, first, to determine whether the effect of metabolic acidosis or SNAT2 inhibition on amino acid levels in L6 myotubes shows an adaptive response consistent with compensatory harvesting of amino acids by proteolysis; second, to determine whether metabolic acidosis or SNAT2 inhibition in the presence of insulin activates proteolysis by signaling through mTOR or PI3K; and, third, to determine whether coupling between SNAT2 and PI3K/PKB signaling is detectable when the activity or expression of SNAT2 is impaired.
RESULTS
Time Course of Intracellular l-Glutamine Depletion by SNAT2 Inhibition
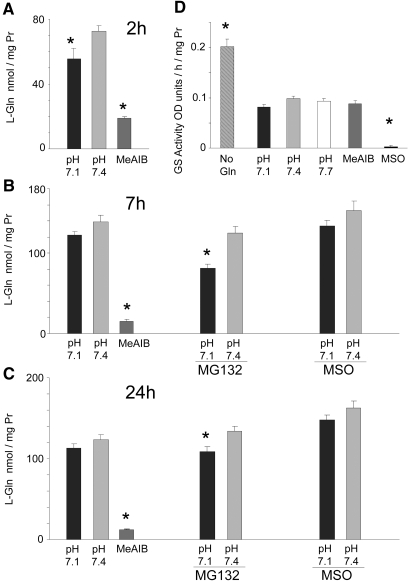
As demonstrated previously,5 the 40% inhibition of the activity of the SNAT2 transporter that occurs on lowering the pH to 7.15 leads within 2 h to a fall in the concentration of many amino acids in L6-G8C5 myotubes, most notably a 25% fall in the large l-Glutamine (L-Gln) pool (Figure 1A); however, in longer incubations of 7 or 24 h, the L-Gln–depleting effect of low pH was blunted, no longer achieving statistical significance (Figure 1, B and C). When amino acid influx through SNAT2 was completely inhibited with a saturating competing dose of the SNAT2 substrate methylaminoisobutyrate (MeAIB), strong L-Gln depletion was observed at 2 h5 (Figure 1A), but no subsequent recovery occurred (Figure 1, B and C). The cells therefore apparently possess mechanism(s) to bolster L-Gln levels in the face of partial SNAT2 inhibition in chronic acidosis but not when SNAT2 is saturated with MeAIB.
Figure 1.
(A through C) Time course of the effect of low pH or MeAIB (10 mM) on the intracellular concentration of L-Gln in L6-G8C5 myotubes, with MG132 (10 μM) or methionine sulfoximine (MSO; 1 mM). Media were based on MEM and contained 2 mM L-Gln with 2% dialyzed FBS. Pooled data from three independent experiments are shown (with at least three replicate culture wells for each treatment). In 24-h incubations, MG132 and MSO were present only for the last 7 h. (D) l-Glutamine synthetase catalytic activity in lysates from L6-G8C5 myotubes incubated for 48 h at pH 7.4 without L-Gln or with 2 mM L-Gln at the specified pH or with 2 mM L-Gln at pH 7.4 with 10 mM MeAIB or 1 mM MSO. Fresh medium of the same composition was added after 24 h. Pooled data from five independent experiments are shown (with at least three replicate culture wells for each treatment). *P < 0.05 versus the corresponding control value at pH 7.4.
Role of SNAT2 Upregulation and L-Gln Synthetase in Restoring L-Gln Levels during Acidosis
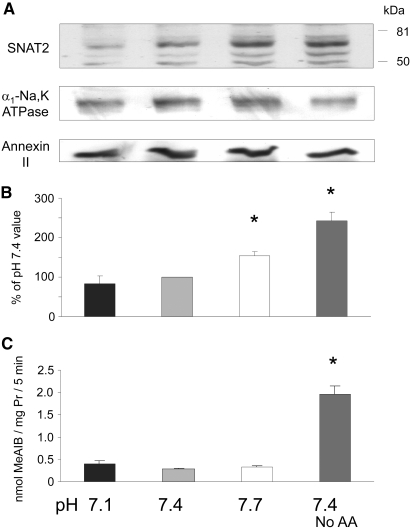
Complete amino acid starvation of L6 myotubes leads within a few hours to upregulation of SNAT2.13 A possible explanation therefore for the apparent L-Gln adaptive response to acidosis (and its failure on complete SNAT2 inhibition with MeAIB) is that intracellular amino acid depletion during acidosis upregulates SNAT2, thereby increasing L-Gln influx; however, no significant increase in expression of the SNAT2 protein was detected in response to 6 h at low pH, even though a clear increase was observed on complete amino acid starvation (Figure 2, A and B). SNAT2 transporter activity across the plasma membrane was also strongly activated by amino acid starvation (Figure 2C), but, again, no significant increase was observed in response to 6 h of exposure to acid when transport was assayed immediately after restoring the pH from 7.1 to 7.4 (Figure 2C).
Figure 2.
Effect of 6 h of incubation in MEM with 2% dialyzed FBS at the specified pH or at pH 7.4 with no amino acids (No AA), on SNAT2 expression in L6-G8C5 myotubes. (A) Immunoblots of proteins separated by SDS-PAGE from a 170,000 × g membrane preparation, probing with SNAT2-specific antibody (or α1-Na,K-ATPase antibody or Annexin II antibody as loading controls). (B) Quantification by densitometry of the principal 65-kD SNAT2 band in blots as in A. Pooled data are presented from four independent experiments. (C) Assay of SNAT2 transporter activity. After 6 h of incubation, cultures were rinsed with HEPES-buffered balanced salt solution (at pH 7.4 for all cultures), and uptake of 14C-labeled MeAIB was measured at 25°C (see the Concise Methods section). Representative assay from three independent experiments. *P < 0.05 versus the pH 7.4 control value.
Complete removal of L-Gln from the extracellular medium activates the enzyme L-Gln synthetase in these cells (Figure 1D); however, no such effect occurred in response to partial depletion of L-Gln with acid or MeAIB (Figure 1D). The L-Gln synthetase inhibitor methionine sulfoximine, at a dosage that abolishes activity of the enzyme (Figure 1D), also gave no detectable depletion of intracellular L-Gln during acidosis (Figure 1, B and C), confirming that L-Gln synthesis is not a major factor sustaining L-Gln levels in acidosis.
Proteolysis Maintains Intracellular L-Gln Levels during Acidosis
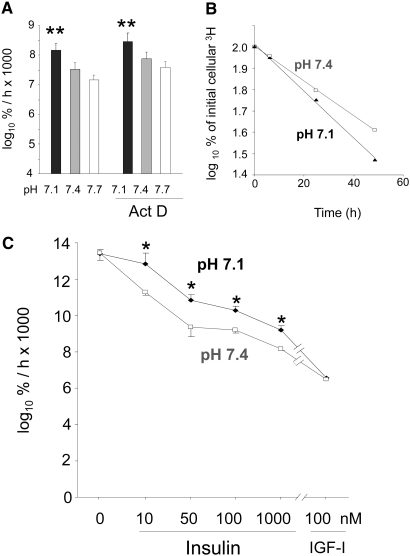
Increased global proteolysis is readily demonstrable in L6-G8C5 myotubes after as little as 7 h of exposure to medium at pH 7.114 (Figure 3A), and this pH dependence is still observed in the presence of Actinomycin D (Figure 3A), suggesting that its initiation requires only posttranscriptional events. This increased degradation coincides with the time at which the L-Gln depletion effect is blunted (Figure 1, B and C). Blockade of proteolysis with the proteasome inhibitor MG132 enhanced the L-Gln–depleting effect of low pH, prolonging it to 7 and 24 h (Figure 1, B and C), demonstrating that the stimulation of proteolysis by acidosis has a significant role in maintaining intracellular L-Gln levels at these time points.
Figure 3.
(A) Effect of 1 μM Actinomycin D (Act D) on proteolysis rate in L6-G8C5 myotubes during 7-h incubations at the specified pH in MEM + 2 mM L-Phe + 2% dialyzed FBS. Pooled data from four independent experiments are shown (with three replicate culture wells for each treatment). Proteolysis was assessed from the rate of release of radioactivity into the medium from cultures prelabeled with 3H-L-Phe and is expressed as the logarithm of the percentage of the total initial cellular radioactivity per hour (log10 %/h × 1000; see the Concise Methods section). (B) Typical delabeling time course of 3H-L-Phe–prelabeled cells incubated in serum-free MEM + 2 mM L-Phe at the specified pH with 100 nM insulin. Linear regression slopes of plots of this type are presented in A and C and Figure 4. (C) Effect of pH, insulin, and high-dosage IGF-1 on the rate of proteolysis (delabeling) expressed as log10 %/h × 1000 in L6-G8C5 myotubes. Pooled data from three independent experiments are shown (with three replicate culture wells for each treatment). *P < 0.05 versus the corresponding pH 7.4 control value; **P < 0.05 versus the corresponding pH 7.7 value.
Increased Proteolysis in Response to Acid Involves Insulin Resistance and SNAT2
If, as proposed elsewhere,10 proteolysis induced by acidosis arises from insulin resistance, then the dose-response curve for suppression of proteolysis by insulin or IGF-I should be right-shifted by acid, with the effect of acid disappearing both in insulin-free medium and when excess insulin or IGF-I is added to overcome the resistance. In serum-free medium with insulin or IGF-I as the sole anabolic factor, this hypothetical right shift was clearly observed (Figure 3, B and C). No pH effect was observed in serum-free medium alone, and the effect of pH was abolished with high-dosage IGF-I.
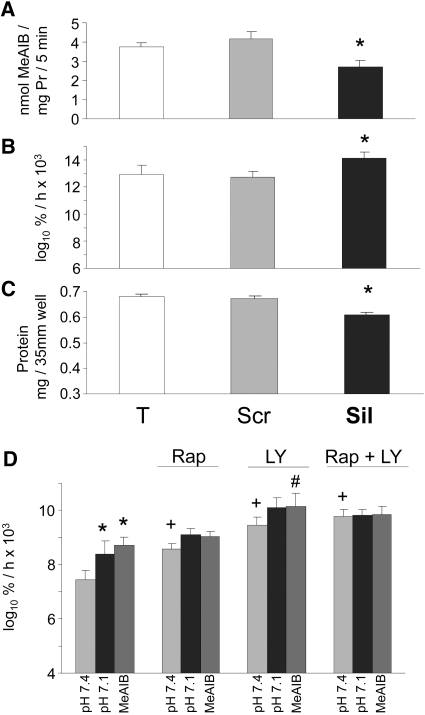
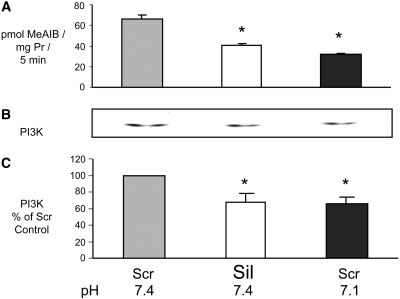
The effect of selective inhibition of SNAT2 on proteolysis was tested by selective silencing of SNAT2 expression using a small interfering RNA (siRNA) that we characterized previously.5 Treatment of myotubes with the silencing siRNA reduced SNAT2 transporter activity by 35% (Figures 4A and 5A), a reduction comparable in magnitude to that observed on lowering extracellular pH to 7.15 (Figure 5A). This gave a clear stimulation of global proteolysis (Figure 4B), and, as predicted, the increase in proteolysis was similar in magnitude to that induced by acidosis (Figure 3C) and yielded net protein wasting (Figure 4C) like that previously observed in acid-treated myotubes.5,14 Furthermore, the previously reported stimulation of proteolysis when the amino acid influx through SNAT2 was blocked with MeAIB5,14 was also observed in serum-free medium with insulin (Figure 4D).
Figure 4.
(A through C) Effect of siRNA silencing of SNAT2 in L6-G8C5 myotubes. Pooled data from three independent experiments are shown (with three replicate culture wells for each treatment). T, cultures incubated with calcium phosphate transfection blank; Scr, scrambled control siRNA; Sil, SNAT2 silencing siRNA. Transfection was followed by an 8-h incubation in DMEM + 10% FBS followed by 16 h in MEM + 2% dialyzed FBS. All measurements were then made in parallel as follows: SNAT2 transporter activity (A) and proteolysis rate during 24 h in MEM + 2 mM L-Phe + 2% dialyzed FBS at pH 7.4 (B). Cultures were prelabeled by incubating with 3H-L-Phe for 72 h (including the transfection incubation) before the delabeling measurements. (C) Protein content of the cultures in B. *P < 0.05 versus Scr control. (D) Effect of 100 nM rapamycin (Rap) and 12.5 μM LY294002 (LY) on proteolysis rate in L6-G8C5 myotubes as in Figure 3B during incubation at pH 7.1, pH 7.4, or pH 7.4 with 10 mM MeAIB in serum-free MEM with 100 nM insulin. *P < 0.05 versus the corresponding pH 7.4 control value; +P < 0.05 versus cultures at pH 7.4 without Rap or LY; #P < 0.05 versus cultures with 10 mM MeAIB without LY. Pooled data from four independent experiments are shown (with three replicate culture wells for each treatment).
Figure 5.
Comparison of the effects of siRNA silencing of SNAT2 and of acidosis on PI3K activity in L6-G8C5 myotubes. Transfection (see Figure 4) was followed by 24 h in DMEM + 10% FBS. Cells were subjected to an additional 2-h incubation in serum-free MEM, at the specified pH with 100 nM insulin before preparing lysates for PI3K assay. (A) SNAT2 transporter activity assayed at the specified pH. (B) Representative autoradiograph of thin-layer chromatography plate showing 32P-labeled phosphatidylinositol-3-phosphate generated by the PI3K lipid kinase reaction (see the Concise Methods section). (C) Quantification by densitometry of data pooled from three independent experiments performed as in B, expressed as percentage of the pH 7.4 Scr control value. *P < 0.05 versus the pH 7.4 Scr control.
Involvement of mTOR and PI3K Signaling in Acid-Induced Proteolysis
In the presence of insulin, the stimulatory effects of acid or MeAIB on proteolysis were mimicked when insulin signaling through mTOR and PI3K was inhibited with rapamycin and LY294002, respectively (Figure 4D). In the presence of the stimulatory effect on proteolysis of rapamycin or LY294002 alone, the stimulatory effect of acid or MeAIB no longer reached statistical significance (Figure 4D). In the presence of rapamycin plus LY294002 combined, acidosis or MeAIB exerted no further stimulatory effect (Figure 4D), consistent with the idea that low pH, acting through SNAT2, signals to proteolysis by impairing insulin signaling to mTOR and/or PI3K.
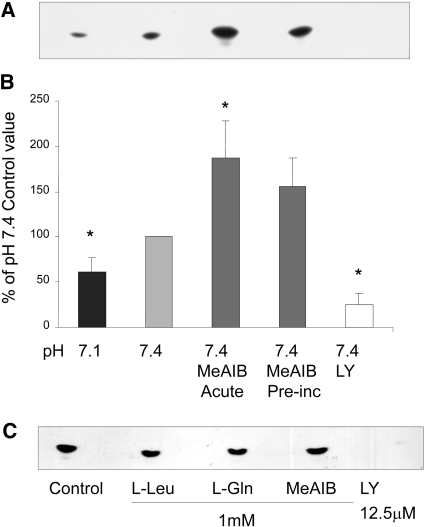
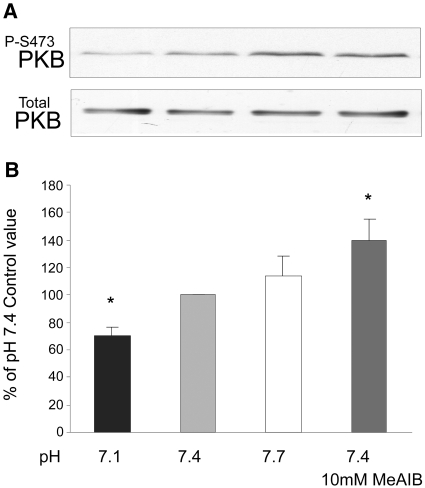
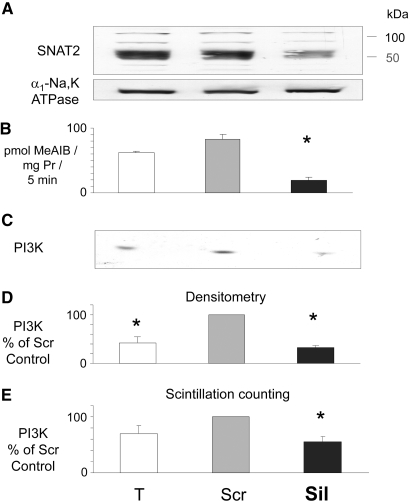
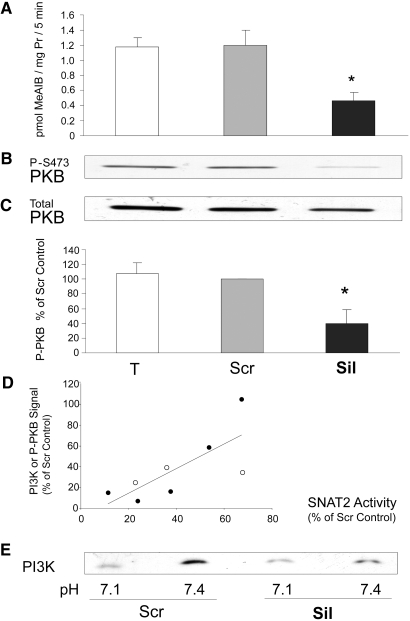
Low pH or selective inhibition of SNAT2 is already known to impair mTOR signaling in these cells.5 Inhibition by low pH of PI3K and PKB also was reported previously10 and was confirmed in myotubes in this study (Figures 5C; 6, A and B; and 7). The effect of selective SNAT2 inhibition on insulin signaling to PI3K and PKB was investigated by silencing SNAT2 expression with siRNA in myoblasts that efficiently reduced SNAT2 protein expression (Figure 8A) and SNAT2 transporter activity (Figures 8B and 9A). Consistent with the effects of acidosis, silencing of SNAT2 alone significantly impaired both PI3K lipid kinase activity (Figure 8, C through E) and PKB activation (Figure 9, B and C). The weaker silencing of SNAT2 obtained in myotubes (Figures 4A and 5A; similar in magnitude to the impairment of SNAT2 activity observed with acid [Figure 5A]) also gave an impairment of PI3K signaling similar to that observed with acid (Figure 5, B and C), consistent with the similar stimulation of proteolysis observed in myotubes with SNAT2 silencing (Figure 4B) and acid (Figure 3C).
Figure 6.
(A and B) Effect on PI3K activity in L6-G8C5 myotubes of 2-h incubations at the specified pH with or without 10 mM MeAIB or 12.5 μM LY294002. All media contained serum-free MEM with 100 nM insulin. Acute, cultures in which MeAIB was present during the 2-h incubation; Preinc, cultures in which MeAIB was absent during the 2-h incubation but had been present in the preceding 4 h in MEM with 2% dialyzed FBS. (A) Representative PI3K assay autoradiograph. (B) Pooled quantification data obtained by densitometry of six independent experiments performed as in A, expressed as percentage of the control value at pH 7.4. *P < 0.05 versus the pH 7.4 control. (C) Effect of incubation of PI3K immunoprecipitates with amino acids or LY294002 only during the kinase assay incubation with 32P-ATP. Representative autoradiograph from one of two experiments.
Figure 7.
Effect on PKB activation in L6-G8C5 myotubes of 2-h incubations at the specified pH with or without 10 mM MeAIB as in Figure 6. All media contained serum-free MEM with 100 nM insulin. (A) Representative immunoblot showing PKB activation assessed from phosphorylation of PKB at Ser 473. (B) Pooled quantification data from 18 independent experiments performed as in A expressed as percentage of the control value at pH 7.4. *P < 0.05 versus the pH 7.4 control.
Figure 8.
Effect of siRNA silencing of SNAT2 on PI3K activity as in Figure 5 but with L6-G8C5 myoblasts. (A) Confirmation by immunoblotting of SNAT2 silencing. Proteins from a 170,000 × g membrane preparation separated by SDS-PAGE were probed with SNAT2-specific antibody (or α1-Na,K-ATPase antibody as a loading control). Experiments in B through E were run in parallel on the same cells. Pooled data from three independent experiments are presented. (B) SNAT2 transporter activity. (C) Representative autoradiograph of PI3K assay thin-layer chromatography plate. (D) Quantification of pooled experiments performed as in C. (E) Quantification by liquid scintillation counting of 32P spots scraped from the plates in D. *P < 0.05 versus the Scr control.
Figure 9.
(A through C) Effect of siRNA silencing of SNAT2 on PKB activation in L6-G8C5 myoblasts as in Figure 8. Experiments were run in parallel on the same cells. Pooled data from five independent experiments are presented. (A) SNAT2 transporter activity. (B) Representative immunoblot showing PKB activation assessed from phosphorylation of PKB at Ser 473. (C) Quantification by densitometry of pooled experiments performed as in B, expressed as percentage of the Scr control value. *P < 0.05 versus the Scr control. (D) Correlation between the degree of silencing of SNAT2 and the accompanying degree of inhibition of the P-PKB and PI3K signals. Data are plotted from the five PKB experiments in A and C (•) and the three PI3K experiments in Figure 8, B and D (○). Spearman rank correlation coefficients: All data R = 0.74, P < 0.04; PKB data only R = 0.90, P < 0.04. (E) Representative experiment showing the effect of pH on the residual PI3K activity in myoblasts in which SNAT2 had been silenced as in Figure 8, but the ensuing 2-h incubation with 100 nM insulin was performed either at pH 7.1 or at pH 7.4.
When the myoblast signaling data from Figures 8D and 9C were plotted against the degree of SNAT2 silencing in those eight experiments, signaling was found to decline approximately in proportion to the extent of SNAT2 silencing (Figure 9D). Consequently, in strongly SNAT2-silenced myoblasts, there is little residual PI3K signal on which low pH can exert an inhibitory effect (Figure 9E); therefore, at least in myoblasts, inhibition by low pH of SNAT2-independent contributors to PI3K/PKB signaling seems unlikely to be a major contributor to the effect of acid on PI3K/PKB.
Mechanism of SNAT2 Effects on PI3K and PKB
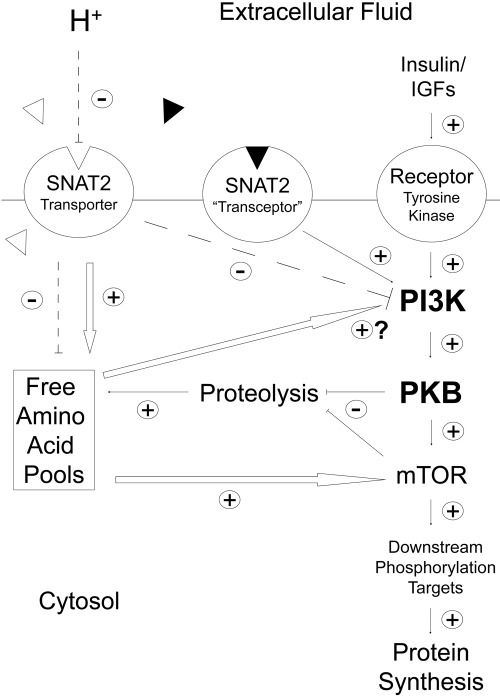
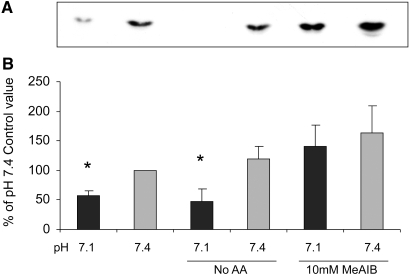
The SNAT2 protein is thought to be able to signal in L6 skeletal muscle cells by two mechanisms (Figure 10): Through SNAT2 acting as a transporter, influencing intracellular amino acid concentration5 (which might then act directly on PI3K), or through the recently proposed SNAT2 “transceptor” mechanism, in which a signal is generated by a SNAT2/amino acid substrate complex13 acting independent of intracellular amino acid levels. In principle, these two mechanisms can be distinguished by saturating SNAT2 with its synthetic substrate MeAIB, which should competitively inhibit the first mechanism and stimulate the second (Figure 10). The observed stimulation of both PI3K and PKB by MeAIB (Figures 6 and 7) suggests that the second mechanism rather than the first predominates. This conclusion of acidosis inhibiting PI3K through SNAT2 by a pathway independent of the amino acid influx through SNAT2 is further supported by the failure of amino acids to exert any acute stimulatory effect on the catalytic activity of immunoprecipitated PI3K (Figure 6C), the failure of extracellular amino acid starvation to block pH sensitivity of PI3K (Figure 11), and the apparent blunting of pH sensitivity of PI3K when SNAT2 is saturated with MeAIB (Figure 11).
Figure 10.
Proposed scheme whereby the pH-sensitive SNAT2 amino acid transporter and the putative SNAT2/amino acid substrate “transceptor” complex influence amino acid signaling and global proteolysis in L6-G8C5 rat skeletal muscle cells. Dashed lines denote the inhibitory effect of low extracellular pH on the SNAT2 transporter and the resulting inhibition of PI3K and depletion of intracellular free amino acid pools. White arrows indicate known or suspected effects of amino acids whose intracellular concentrations are directly (e.g., L-Gln) or indirectly (e.g., L-Leu) regulated by SNAT2 transporter activity. ▵, Naturally occurring metabolizable amino acid substrates of SNAT2; ▴, synthetic nonmetabolizable SNAT2 substrate MeAIB.
Figure 11.
Influence of amino acid starvation (No AA) or saturation of SNAT2 with 10 mM MeAIB on the pH sensitivity of PI3K lipid kinase activity in L6-G8C5 myotubes. Cells were incubated for 2 h at the specified pH with or without amino acids or MeAIB. All media contained serum-free MEM with 100 nM insulin. For No AA cultures, this 2-h incubation was preceded by 2 h in MEM without amino acids and with 2% dialyzed FBS. (A) Representative PI3K assay autoradiograph. (B) Pooled quantification data obtained by densitometry of three independent experiments performed as in A. *P < 0.05 versus the corresponding pH 7.4 control.
DISCUSSION
SNAT2 Regulates mTOR, PI3K, PKB, and Proteolysis
This study is the first to demonstrate that the acidosis-sensitive SNAT2 transporter is coupled to PI3K, PKB, and proteolysis in skeletal muscle cells. Viewed in conjunction with our previous report of regulation of mTOR and protein synthesis by SNAT2,5 this strongly suggests that this transporter is a key player in the acid-induced insulin resistance that is regarded as a prime cause of cachexia in patients with acidosis and uremia.
In this study (Figure 4), 35% silencing of SNAT2 activity in myotubes using siRNA led to a reproducible 11% stimulation of global proteolysis. We showed previously that a similar degree of silencing also leads to a 12% decrease in global protein synthesis.5 Together, these effects impose negative nitrogen balance on the cells, leading to a significant but nontoxic decline in the protein content of the cultures5,14 (Figure 4C). From 11C-MeAIB positron emission tomography of skeletal muscle in vivo, SNAT2 transport activity in patients with chronic renal failure has been estimated to be 23% lower than in healthy control subjects.15 The effects reported here therefore seem comparable to those in vivo and are of sufficient magnitude to contribute to uremic cachexia.
Linkage between Protein Synthesis and Degradation during Acidosis
Evidence from inhibition of proteolysis with MG132 (Figure 1) suggests that the previously reported5 SNAT2-mediated depletion of intracellular amino acids (leading to impaired mTOR signaling and impaired protein synthesis during acidosis) may be blunted by amino acids generated by subsequent degradation of cell protein (Figure 10). Such a mechanism may explain why impaired protein synthesis is observed in response to acute metabolic acidosis in humans6 but not during prolonged acidosis (e.g., in chronic renal failure) in which degradation of large myofibrillar protein pools and, hence, liberation of amino acids in the cytosol is chronically stimulated.8
This raises the important mechanistic question of whether proteolysis during metabolic acidosis is stimulated exclusively by intracellular amino acid depletion triggered by inhibition of SNAT2 activity5 (which might therefore be amenable to amino acid supplementation therapy) or through some other mechanism for sensing of low extracellular pH (e.g., through effects of pH on SNAT2 other than inhibition of the amino acid influx through the transporter). Evidence from this and the previous study5 suggests that both mechanisms may contribute as follows (Figure 10).
SNAT2 Signaling to Proteolysis through Amino Acid Depletion
The inhibitor studies in Figure 4D suggest that both mTOR signaling and PI3K signaling are involved in the regulation of proteolysis in these cells. Inhibition of SNAT2 leads to significant intracellular depletion of L-Gln and also indirectly to depletion of the branched-chain amino acids L-Leu, L-Ile, and L-Val,5 which are well established as activators of mTOR signaling in skeletal muscle cells, including L6.16 Although mTOR signaling is probably an important contributor, other amino acid–sensing pathways also possibly contribute, for example, the recently described L-Leu suppressible activation of proteolysis in muscle that occurs through the double-stranded RNA-dependent protein kinase PKR.17 The involvement of pathways other than PI3K/PKB in regulation of proteolysis is also shown by the effect of MeAIB, which clearly activates proteolysis5,14 (Figure 4D), even though it fails to inhibit PI3K and PKB (Figures 6 and 7). This failure of MeAIB to generate one of the potentially catabolic signals that are generated by low pH, leading to a disproportionately small generation of amino acids from proteolysis, presumably explains the failure of MeAIB-induced proteolysis to rectify L-Gln depletion during treatment with MeAIB in Figure 1, B and C.
Selective silencing of SNAT2 with siRNA led to significant impairment of PI3K and PKB activation in the presence of insulin (Figures 5, 8, and 9). Near-complete silencing of SNAT2 was achieved only in myoblasts (Figures 8 and 9), but a proportionate decrease in PI3K activity was also observed with the partial silencing of SNAT2 achieved in myotubes (Figure 5). Unlike mTOR, PI3K and PKB are not routinely regarded as responsive to amino acids. Nevertheless, precedents do exist for amino acid effects on PI3K. Activation of the type III PI3K hVps34 by amino acids is well documented,12 and, under PI3K assay conditions such as those described in this study, PI3K activity in L-Leu–starved L6 cells was strongly activated in response to 2 mM L-Leu.18 Even though L-Leu is a poor SNAT2 substrate, the L-Leu effect was short-lived, and no PKB activation resulted from it,16,18 the previous report is relevant to this study because L-Leu loading of L-Leu–starved L6 cells is a potent activator of SNAT2.18
SNAT2 Signaling Independent of Amino Acid Transport
Although the intracellular amino acids supplied through SNAT2 may have a role in the coupling between SNAT2 and PI3K, this is unlikely to be the full explanation. Direct addition of amino acids did not activate immunoprecipitated PI3K (Figure 6C), blocking amino acid influx through SNAT2 with MeAIB did not inhibit PI3K (Figure 6), and amino acid starvation in intact cells has consistently failed to inhibit insulin signaling to PKB19,20 (the last possibly because of the strong countervailing upregulation of SNAT2 that occurs on complete amino acid starvation13 [Figure 2]). This leads to the interesting possibility that the SNAT2 protein signals to PI3K and PKB through a pathway independent of intracellular amino acid levels (Figure 10), analogous to the mechanisms that have been postulated to explain signal generation by the Ssy1 protein in yeast,21 signaling from the Path amino acid transporter to dTOR in Drosophila,22 and sensing of amino acid availability in L6 myotubes.13 Of particular relevance is the last study, which proposed that part of the signal that suppresses SNAT2 gene expression, when SNAT2 amino acid substrates are added to L6 cells, arises not from amino acids carried into the cell by SNAT2 but from the SNAT2/amino acid substrate complex. Signaling through such a complex (Figure 10) may explain why PI3K and PKB in this study were inhibited by siRNA silencing of SNAT2 (Figures 5, 8, and 9) but activated when the cells were saturated with SNAT2 substrate MeAIB (Figures 6 and 7). A further relevant finding is that System A–type transporters (which include SNAT2) associate with integrin α3β123 and therefore possibly co-localize with adhesion kinases that are potent activators of PI3K.24
In conclusion, the SNAT2 amino acid transporter is a major acute determinant of insulin sensitivity in cultured skeletal muscle cells and exerts functionally significant effects on both protein synthesis and proteolysis. In view of its sensitivity to acidosis and its reported inhibition in uremia, it is an important target for further research in uremic cachexia. In particular, it will be of interest to determine whether the effects of SNAT2 inhibition observed in this acute culture model are also of importance in vivo in response to chronic inhibition of SNAT2 by acidosis. It will also be interesting to know whether the dominant role of SNAT2 (and the other SNAT transporters expressed in vivo at lower level) is as net transporters of amino acids5 or as amino acid sensors13 that might exert functionally important effects even at low levels of expression.
CONCISE METHODS
Cell Culture
L6-G8C5 rat myoblasts were grown to confluence in DMEM with 10% vol/vol FBS and fused to form myotubes by culturing in MEM with 2% vol/vol FBS as described previously.14 For experiments with unfused myoblasts, cells were seeded in DMEM/10% serum at 3.4 × 10⁴/cm2, fresh medium was added after 24 h, and myoblasts were used after an additional 17 h. Unless otherwise stated, experimental incubations were performed in MEM with 2 mM l-glutamine, penicillin (105 IU/L), streptomycin (100 mg/L), and 2% vol/vol dialyzed FBS. At the end of experimental incubations, lysates for PI3K and PKB signaling studies and a 170,000 × g total membrane fraction containing SNAT2 were prepared as described previously.25,26 For determination of l-glutamine synthetase (glutamate-ammonia ligase E.C. 6.3.1.2), cultures were washed twice with PBS and stored at −80°C in 50 mM imidazole (pH 6.8) before colorimetric determination of enzyme activity with hydroxylamine as described previously.27
Proteolysis was measured by prelabeling of cell protein with l-[2,6 3H]-Phe (Amersham [Little Chalfont, UK] TRK552) and measurement of release of acid-soluble radioactivity into the medium,28 expressed as log10 of the percentage of the total initial cellular 3H per hour.28 Cell viability was monitored by measurement of release of acid-precipitable radioactivity into the medium (an indicator of intact protein leakage and cell detachment)29 and was unaffected by the culture conditions described in this study. Total cell protein was determined as described previously.14
SNAT2 transporter activity was assayed from uptake of 14C-methylaminoisobutyrate (MeAIB; NEN-Du Pont, Beaconsfield, UK) into intact myotubes during 5-min incubations30 with 10 μmol/L MeAIB at 0.5 mCi (18.5 MBq)/L. For subconfluent myoblasts, this was increased to 40 μmol/L at 2 mCi (74 MBq)/L. Other SNAT transporters capable of carrying 14C-MeAIB are not expressed in these cells.5
PI3K Activity.
PI3K lipid kinase activity was determined as described previously.31 Briefly, cells were lysed by scraping in buffer comprising 137 mM NaCl, 2.7 mm KCl, 1 mM MgCl2, 1 mM CaCl2, 1% vol/vol IGEPAL CA-630, 10% vol/vol glycerol, 1 mg/ml BSA, 20 mM Tris, 0.5 mM Na3VO4, 0.2 mM PMSF, 10 μg/ml leupeptin, 10 μg/ml antipain, 10 μg/ml pepstatin A, and 10 μg/ml aprotinin adjusted to pH 8.0 at 4°C. PI3K was immunoprecipitated from lysates using anti-phosphotyrosine antibody (Santa Cruz PY99; Santa Cruz Biotechnology, Santa Cruz, CA). Washed immunoprecipitates were then incubated for exactly 5 min at 37°C with assay substrates (γ-32P-ATP and phosphatidylinositol) followed by immediate chilling on ice and extraction of 32P-labeled lipid product into chloroform/methanol (1:2 vol/vol). 32P-labeled phosphatidylinositol-3-phosphate was then resolved by thin-layer chromatography and visualized by autoradiography of the thin-layer chromatography plate. The product was quantified by densitometry of the autoradiograph, and, in some experiments, the result was confirmed by scraping the labeled spot off the plate and quantifying the scraped 32P by liquid scintillation counting. Samples were counted until at least 1000 counts had accumulated.
Amino Acid Analysis.
Cultures on 35-mm wells were rapidly chilled on ice, rinsed three times with ice-cold 0.9% wt/vol NaCl, and deproteinized by scraping in 150 μl of 0.3 M perchloric acid. Precipitated protein was sedimented (10 min, 4°C, 3000 × g) and retained for total protein assay. Supernatant was neutralized by vortexing with an equal volume of tri-n-octylamine/1,1,2-trichloro, trifluoro-ethane (22:78 vol/vol).32 The top (neutralized aqueous) phase was stored at −80°C. Amino acids were determined on an Agilent (Wokingham, UK) 1100 high-performance liquid chromatograph with Zorbax Eclipse AAA column (4.6 × 75 mm, 3.5 μm) at 40°C with o-phthalaldehyde/3-mercaptopropionate/9-fluorenylmethylchloroformate precolumn derivatization and ultraviolet and fluorimetric postcolumn detection.
SDS-PAGE and Immunoblotting
Cell lysates or membranes (20 μg protein per lane) were subjected to SDS-PAGE, and proteins were blotted onto nitrocellulose membranes (Amersham Hybond ECL). Membranes were blocked for 1 h at room temperature with Tris-buffered saline (pH 7.6) and 5% wt/vol skim milk and 0.1% vol/vol Tween 20 detergent and then probed with primary antibodies in blocking buffer at 4°C overnight. Anti-SNAT2 rabbit polyclonal antibody (raised against the N-terminal peptide MKKTEMGRFNISPDEDSC of rat SNAT2) was used at 1:4000 dilution. Anti–α1-Na,K-ATPase mouse monoclonal (Abcam, Cambridge, UK) was used at 1:5000, and anti–Annexin II goat polyclonal (Santa Cruz Biotechnology) was used at 1:4000. Antibody against PKB phosphorylated at Ser 473 (New England Biolabs, Hitchin, UK) was used at 1:1000 dilution. Primary antibody was detected using horseradish peroxidase–conjugated goat anti-rabbit IgG or rabbit anti-mouse IgG (Dako, Ely, UK) at 1:1500 dilution for 2 h in blocking buffer at room temperature. Horseradish peroxidase–labeled bands were detected by chemiluminescence (ECL; Amersham) and quantified with a Bio-Rad GS700 densitometer using Molecular Analyst 1.4 software (Bio-Rad, Hemel Hampstead, UK).
siRNA Transfection.
As shown previously,5 efficient silencing of SNAT2 for intracellular signaling studies can be achieved by transfecting L6-G8C5 myoblasts with siRNA. Myoblasts (40% confluent) were transfected with the following double-stranded siRNA at a final concentration of 30 nM for 16 h in DMEM/10% FBS using Profection Calcium Phosphate transfection (E1200; Promega, Madison, WI): (1) SNAT2 silencing siRNA (forward sequence 5′-CUGACAUUCUCCUCCUCGUdTdT directed against base position 1095 onward in the gene sequence) and (2) scrambled control siRNA (forward sequence 5′-CGCUCUACUCUACUUGUCCdTdT) sharing the same base composition as 1) but in random sequence. After transfection, unless otherwise stated, cultures were incubated in fresh DMEM/10% FBS for 24 h before commencement of measurements. Myoblasts are unsuitable for measurements of global proteolysis because (unlike myotubes) their proteolysis rate is unaffected by acidosis5; therefore, despite the less efficient silencing of SNAT2 (Figures 4A and 5A), for proteolysis experiments, siRNA silencing was performed with confluent myotubes using exactly the same transfection procedure described previously. To observe the effect of siRNA silencing of SNAT2 on proteolysis (which was undetectable in our previous study),5 it was also found necessary to increase the duration of prelabeling of cellular proteins with 3H-L-Phe to 72 h as explained in the legend to Figure 4B.
Statistical Analysis
Data are presented as means ± SE. Statistical significance was assessed by ANOVA and post hoc testing with Duncan multiple range test, using SPSS 11.01 (SPSS, Chicago, IL). Changes were regarded as significant at P < 0.05. Correlation was expressed as the Spearman rank correlation coefficient.
DISCLOSURES
None.
Supplementary Material
Acknowledgments
We gratefully acknowledge grants from Kidney Research UK (RP26/2/2004), Wellcome Trust (059828/Z/99/Z), Jules Thorn Trust (03SC/06A), Peel Medical Research Trust (AGT.R5), and Renal Care and Research Association. K.F.E. thanks Kidney Research UK and Diabetes UK for studentship DUK ST3/2004. We thank Dr. L.M. Howells and Prof. M.M. Manson for valuable assistance in setting up the PI3K lipid kinase assay.
Published online ahead of print. Publication date available at www.jasn.org.
Supplemental information for this article is available online at http://www.jasn.org/.
REFERENCES
- 1.Siew ED, Pupim LB, Majchrzak KM, Shintani A, Flakoll PJ, Ikizler TA: Insulin resistance is associated with skeletal muscle protein breakdown in non-diabetic chronic hemodialysis patients. Kidney Int 71: 146–152, 2007 [DOI] [PubMed] [Google Scholar]
- 2.Lee SW, Park GH, Lee SW, Song JH, Hong KC, Kim MJ: Insulin resistance and muscle wasting in non-diabetic end-stage renal disease patients. Nephrol Dial Transplant 22: 2554–2562, 2007 [DOI] [PubMed] [Google Scholar]
- 3.Mitch WE: Metabolic and clinical consequences of metabolic acidosis. J Nephrol 19[Suppl 9]: S70–S75, 2006 [PubMed] [Google Scholar]
- 4.Baird FE, Pinilla-Tenas JJ, Ogilvie WL, Ganapathy V, Hundal HS, Taylor PM: Evidence for allosteric regulation of pH-sensitive System A (SNAT2) and System N (SNAT5) amino acid transporter activity involving a conserved histidine residue. Biochem J 397: 369–375, 2006 [DOI] [PMC free article] [PubMed] [Google Scholar]
- 5.Evans K, Nasim Z, Brown J, Butler H, Kauser S, Varoqui H, Erickson JD, Herbert TP, Bevington A: Acidosis-sensing glutamine pump SNAT2 determines amino acid levels and mammalian target of rapamycin signalling to protein synthesis in L6 muscle cells. J Am Soc Nephrol 18: 1426–1436, 2007 [DOI] [PubMed] [Google Scholar]
- 6.Kleger GR, Turgay M, Imoberdorf R, McNurlan MA, Garlick PJ, Ballmer PE: Acute metabolic acidosis decreases muscle protein synthesis but not albumin synthesis in humans. Am J Kidney Dis 38: 1199–1207, 2001 [DOI] [PubMed] [Google Scholar]
- 7.Du J, Hu Z, Mitch WE: Molecular mechanisms activating muscle protein degradation in chronic kidney disease and other catabolic conditions. Eur J Clin Invest 35: 157–163, 2005 [DOI] [PubMed] [Google Scholar]
- 8.Reaich D, Graham KA, Channon SM, Hetherington C, Scrimgeour CM, Wilkinson R, Goodship TH: Insulin-mediated changes in PD and glucose uptake after correction of acidosis in humans with CRF. Am J Physiol 268: E121–E126, 1995 [DOI] [PubMed] [Google Scholar]
- 9.Vabulas RM, Hartl FU: Protein synthesis upon acute nutrient restriction relies on proteasome function. Science 310: 1960–1963, 2005 [DOI] [PubMed] [Google Scholar]
- 10.Franch HA, Raissi S, Wang X, Zheng B, Bailey JL, Price SR: Acidosis impairs insulin receptor substrate-1-associated phosphoinositide 3-kinase signaling in muscle cells: Consequences on proteolysis. Am J Physiol Renal Physiol 287: F700–F706, 2004 [DOI] [PubMed] [Google Scholar]
- 11.Bailey JL, Zheng B, Hu Z, Price SR, Mitch WE: Chronic kidney disease causes defects in signaling through the insulin receptor substrate/phosphatidylinositol 3-kinase/Akt pathway: Implications for muscle atrophy. J Am Soc Nephrol 17: 1388–1394, 2006 [DOI] [PubMed] [Google Scholar]
- 12.Nobukuni T, Joaquin M, Roccio M, Dann SG, Kim SY, Gulati P, Byfield MP, Backer JM, Natt F, Bos JL, Zwartkruis FJ, Thomas G: Amino acids mediate mTOR/raptor signaling through activation of class 3 phosphatidylinositol 3OH-kinase. Proc Natl Acad Sci U S A 102: 14238–14243, 2005 [DOI] [PMC free article] [PubMed] [Google Scholar]
- 13.Hyde R, Cwiklinski EL, Macaulay K, Taylor PM, Hundal HS: Distinct sensor pathways in the hierarchical control of SNAT2, a putative amino acid transceptor, by amino acid availability. J Biol Chem 282: 19788–19798, 2007 [DOI] [PubMed] [Google Scholar]
- 14.Bevington A, Brown J, Butler H, Govindji S, Khai MK, Sheridan K, Walls J: Impaired system A amino acid transport mimics the catabolic effects of acid in L6 cells. Eur J Clin Invest 32: 590–602, 2002 [DOI] [PubMed] [Google Scholar]
- 15.Asola MR, Virtanen KA, Peltoniemi P, Nagren K, Jyrkkio S, Knutti J, Nuutila PR, Metsarinne KP: Amino acid transport into skeletal muscle is impaired in chronic renal failure [Abstract]. J Am Soc Nephrol 12: 64A, 2001 [Google Scholar]
- 16.Kimball SR, Shantz LM, Horetsky RL, Jefferson LS: Leucine regulates translation of specific mRNAs in L6 myoblasts through mTOR-mediated changes in availability of eIF4E and phosphorylation of ribosomal protein S6. J Biol Chem 274: 11647–11652, 1999 [DOI] [PubMed] [Google Scholar]
- 17.Eley HL, Russell ST, Tisdale MJ: Effect of branched-chain amino acids on muscle atrophy in cancer cachexia. Biochem J 407: 113–120, 2007 [DOI] [PMC free article] [PubMed] [Google Scholar]
- 18.Peyrollier K, Hajduch E, Blair AS, Hyde R, Hundal HS: L-leucine availability regulates phosphatidylinositol 3-kinase, p70 S6 kinase and glycogen synthase kinase-3 activity in L6 muscle cells: Evidence for the involvement of the mammalian target of rapamycin (mTOR) pathway in the L-leucine-induced up-regulation of system A amino acid transport. Biochem J 350: 361–368, 2000 [PMC free article] [PubMed] [Google Scholar]
- 19.Wang X, Campbell LE, Miller CM, Proud CG: Amino acid availability regulates p70 S6 kinase and multiple translation factors. Biochem J 334: 261–267, 1998 [DOI] [PMC free article] [PubMed] [Google Scholar]
- 20.Campbell LE, Wang X, Proud CG: Nutrients differentially regulate multiple translation factors and their control by insulin. Biochem J 344: 433–441, 1999 [PMC free article] [PubMed] [Google Scholar]
- 21.Wu B, Ottow K, Poulsen P, Gaber RF, Albers E, Kielland-Brandt MC: Competitive intra- and extracellular nutrient sensing by the transporter homologue Ssy1p. J Cell Biol 173: 327–331, 2006 [DOI] [PMC free article] [PubMed] [Google Scholar]
- 22.Goberdhan DC, Meredith D, Boyd CA, Wilson C: PAT-related amino acid transporters regulate growth via a novel mechanism that does not require bulk transport of amino acids. Development 132: 2365–2375, 2005 [DOI] [PubMed] [Google Scholar]
- 23.McCormick JI, Johnstone RM: Identification of the integrin alpha 3 beta 1 as a component of a partially purified A-system amino acid transporter from Ehrlich cell plasma membranes. Biochem J 311: 743–751, 1995 [DOI] [PMC free article] [PubMed] [Google Scholar]
- 24.Thamilselvan V, Craig DH, Basson MD: FAK association with multiple signal proteins mediates pressure-induced colon cancer cell adhesion via a Src-dependent PI3K/Akt pathway. FASEB J 21: 1730–1741, 2007 [DOI] [PubMed] [Google Scholar]
- 25.Gomez E, Powell ML, Greenman IC, Herbert TP: Glucose-stimulated protein synthesis in pancreatic beta-cells parallels an increase in the availability of the translational ternary complex (eIF2-GTP.Met-tRNAi) and the dephosphorylation of eIF2 alpha. J Biol Chem 279: 53937–53946, 2004 [DOI] [PubMed] [Google Scholar]
- 26.Hajduch E, Alessi DR, Hemmings BA, Hundal HS: Constitutive activation of protein kinase B alpha by membrane targeting promotes glucose and system A amino acid transport, protein synthesis, and inactivation of glycogen synthase kinase 3 in L6 muscle cells. Diabetes 47: 1006–1013, 1998 [DOI] [PubMed] [Google Scholar]
- 27.Santoro JC, Harris G, Sitlani A: Colorimetric detection of glutamine synthetase-catalyzed transferase activity in glucocorticoid-treated skeletal muscle cells. Anal Biochem 289: 18–25, 2001 [DOI] [PubMed] [Google Scholar]
- 28.Bevington A, Brown J, Pratt A, Messer J, Walls J: Impaired glycolysis and protein catabolism induced by acid in L6 rat muscle cells. Eur J Clin Invest 28: 908–917, 1998 [DOI] [PubMed] [Google Scholar]
- 29.Ballard FJ, Francis GL: Effects of anabolic agents on protein breakdown in L6 myoblasts. Biochem J 210: 243–249, 1983 [DOI] [PMC free article] [PubMed] [Google Scholar]
- 30.Hundal HS, Bilan PJ, Tsakiridis T, Marette A, Klip A: Structural disruption of the trans-Golgi network does not interfere with the acute stimulation of glucose and amino acid uptake by insulin-like growth factor I in muscle cells. Biochem J 297: 289–295, 1994 [DOI] [PMC free article] [PubMed] [Google Scholar]
- 31.Howells LM, Hudson EA, Manson MM: Inhibition of phosphatidylinositol 3-kinase/protein kinase B signaling is not sufficient to account for indole-3-carbinol-induced apoptosis in some breast and prostate tumor cells. Clin Cancer Res 11: 8521–8527, 2005 [DOI] [PubMed] [Google Scholar]
- 32.Khym JX: An analytical system for rapid separation of tissue nucleotides at low pressures on conventional anion exchangers. Clin Chem 21: 1245–1252, 1975 [PubMed] [Google Scholar]
Associated Data
This section collects any data citations, data availability statements, or supplementary materials included in this article.


