Abstract
Members of the Cys-loop superfamily of ligand-gated ion channels, which mediate fast synaptic transmission in the nervous system, are assembled as heteropentamers from a large repertoire of neuronal subunits. Although several motifs in subunit N-terminal domains are known to be important for subunit assembly, increasing evidence points toward a role for C-terminal domains. Using a combination of flow cytometry, patch clamp recording, endoglycosidase H digestion, brefeldin A treatment, and analytic centrifugation, we identified a highly conserved aspartate residue at the boundary of the M3-M4 loop and the M4 domain that was required for binary and ternary γ-aminobutyric acid type A receptor surface expression. Mutation of this residue caused mutant and partnering subunits to be retained in the endoplasmic reticulum, reflecting impaired forward trafficking. Interestingly although mutant and partnering wild type subunits could be coimmunoprecipitated, analytic centrifugation studies demonstrated decreased formation of pentameric receptors, suggesting that this residue played an important role in later steps of subunit oligomerization. We thus conclude that C-terminal motifs are also important determinants of Cys-loop receptor assembly.
The Cys-loop superfamily of ligand-gated ion channels, which includes γ-aminobutyric acid type A (GABAA)2 and type C (GABAC), nicotinic acetylcholine, glycine, and 5-hydroxytryptamine type 3 receptors, mediates fast synaptic transmission in the nervous system. Mutations that alter Cys-loop receptor surface density by affecting receptor biogenesis have been associated with idiopathic generalized epilepsies (1–4), congenital myasthenic syndromes (5), and psychiatric disorders (6). Unfortunately because the structural and cellular determinants of receptor biogenesis are poorly understood, development of effective treatment strategies remains a significant challenge.
A wealth of evidence suggests that Cys-loop receptors are assembled as heteropentamers from a large repertoire of neuronal subunits (7–10). Subunits share a similar topology that includes an extracellular N-terminal domain, four transmembrane domains, three loops including a large cytoplasmic loop, and a variable length extracellular C-terminal tail (7, 11). Receptor assembly is thought to occur in the endoplasmic reticulum (ER) following glycosylation and folding of de novo synthesized subunits (12–15). Assembly is closely monitored by ER quality control machinery, and consequently subunits that fail to assemble properly are retained and degraded (15–17). Although N-terminal motifs are known to be important for subunit assembly (18, 19), recent studies in nicotinic acetylcholine receptors (nAChRs) suggest that C-terminal motifs may also play a role (20).
GABAA receptors are the most abundant Cys-loop receptor in the mammalian brain and are responsible for the majority of fast inhibitory neurotransmission. Like other Cys-loop superfamily receptors, they are pentamers assembled from combinations of 16 subunit subtypes (α1–6, β1–3, γ1–3, δ, ε, θ, and π) (7). The β2 subunit, in particular, is an essential component of several widely distributed GABAA receptor isoforms (21) and is known to interact directly with several cellular regulatory proteins via its intracellular M3-M4 loop. For instance, it interacts with brefeldin A-inhibited GDP/GTP exchange factor 2 (BIG2) and GABAA receptor-interacting factor-1 (GRIF-1), which promote forward trafficking of GABAA receptors (22, 23), and with adaptor protein 2 (AP2), which participates in clathrin-mediated receptor endocytosis (24).
To better understand how C-terminal motifs regulate Cys-loop receptor biogenesis, the role of the cytoplasmic M3-M4 loop was evaluated in GABAA receptor oligomerization, assembly, and forward trafficking. Using a combination of segmental deletions of the M3-M4 loop and multiple sequence alignment of Cys-loop receptor subunits, we identified a highly conserved aspartate residue at the boundary of the M3-M4 loop and M4 domain in the GABAA receptor α1, β2, and γ2 subunits that was required for binary and ternary receptor surface expression. Results from endoglycosidase H (endo H) digestion, brefeldin A treatment, and analytic centrifugation revealed that mutation of this aspartate residue caused mutant and partnering subunits to be retained in the ER, the result of impaired higher order oligomerization. Our data thus provide evidence that C-terminal motifs are also important for receptor assembly.
EXPERIMENTAL PROCEDURES
Preparation of Complementary DNA (cDNA) Constructs—cDNAs encoding human α1, β2, and γ2S subunit polypeptides including their signal peptides were inserted into the pcDNA3.1(+) vector as described previously (17). The cDNA encoding the FLAG peptide, DYKDDDDK, was introduced between the 8th and 9th amino acids of the mature α1 subunit and the 4th and 5th amino acids of the mature β2 and γ2S subunits. Of note, murine β2 and γ2 subunits (which have sequences identical to their human counterparts) containing FLAG tags at the same position have been demonstrated previously to form receptors that are functionally indistinguishable from wild type receptors (14). Consistent with this finding, we demonstrated that insertion of the FLAG tag between the 8th and 9th amino acids of the human α1 subunit did not alter GABAA receptor current amplitude, GABA EC50, or surface expression (supplemental Fig. 1). M3-M4 loop deletions, point mutations, and restriction enzyme site insertions and removals were performed with the QuikChange site-directed mutagenesis kit (Stratagene).
To swap the M3-M4 loop between α1 and β2 subunits, the AgeI and AscI restriction enzyme sites were introduced into subunit cDNAs before the codons encoding the N-terminal portions of the M3-M4 loop and the M4 domain. The boundaries of the M3-M4 loops were predicted based on the UniProt Knowledgebase (GBRA1_HUMAN for the α1 subunit and GBRB2_HUMAN for the β2 subunit). The α1 subunit M3-M4 loop was excised by double digestion with AgeI and AscI and ligated into the β2 subunit that had been doubly digested with the same enzymes (and vice versa). Finally the restriction enzyme sites were deleted.
Cell Culture and Transfection—Human embryonic kidney cells (HEK293T) were purchased from ATCC (CRL-11268). Cells were incubated at 37 °C in humidified 5% CO2, 95% air and grown in Dulbecco's modified Eagle's medium (Invitrogen) supplemented with 10% fetal bovine serum, 100 IU/ml penicillin, and 100 μg/ml streptomycin (Invitrogen). For binary subunit coexpression, cells were cotransfected with equal amounts (by weight) of α1 and β2 subunit cDNAs using the FuGENE 6 transfection reagent (Roche Applied Science) (6 μl of reagent/2 μg of cDNA/60-mm-diameter culture dish), and for ternary subunit coexpression, cells were transfected with equal amounts of α1, β2, and γ2S subunit cDNAs (9 μl of reagent/3 μg of cDNA at a 1:1:1 cDNA ratio/60-mm culture dish). The cDNA-FuGENE 6 mixture volumes were scaled up or down proportionally to the surface areas of different sized cell culture dishes. Forty-eight hours later, transfected cells were subjected to the following experiments.
Electrophysiology—Patch clamp recordings were obtained at room temperature from lifted HEK293T cells bathed in an external solution composed of 142 mm NaCl, 1 mm CaCl2, 6 mm MgCl2, 8 mm KCl, 10 mm glucose, and 10 mm HEPES (pH 7.4, 330 mosm). Recording electrodes were pulled using a P-2000 laser puller (Sutter Instruments), fire-polished on an MF-9 microforge (Narishige), and filled with an internal solution consisting of 153 mm KCl, 1 mm MgCl2, 10 mm HEPES, 2 mm MgATP, and 5 mm EGTA (pH 7.3, 310 mosm). This combination of internal and external solutions produced a chloride equilibrium potential near 0 mV. Open tip resistances of the recording electrodes were typically 1.0–2.0 megaohms. Currents were recorded under voltage clamp mode at –20 mV using an Axopatch 200B amplifier (Molecular Devices), low pass-filtered at 2 kHz using the internal four-pole Bessel filter of the amplifier, digitized with the Digidata 1322A data acquisition system (Molecular Devices), and stored for off-line analysis. GABA (Sigma-Aldrich) was prepared as a stock solution. Working solutions were made on the day of the experiment by diluting stock solutions with external solution. GABA was applied with a rapid perfusion system consisting of pulled multibarrel square glass tubing connected to a Warner Perfusion Fast-Step system (Warner Instruments) (25). The 10–90% rise times of open electrode tip liquid junction currents were consistently <1.0 ms. Consecutive drug applications were separated by at least 45 s in external solution to allow for complete GABA unbinding.
Peak amplitudes of GABA-evoked currents were analyzed using Clampfit 9.0 (Molecular Devices). GraphPad Prism 4 (GraphPad) was used to fit the concentration-response results to a sigmoidal function using the equation I = Imax/{1 + ([EC50]/[A])Hill slope}, where I is the peak current at a given GABA concentration, [A], and Imax is the maximal peak current. Numerical data are expressed as mean ± S.E. Statistical analysis was performed using GraphPad Prism 4.
Flow Cytometry—To collect cells for flow cytometry analysis, monolayer cultures of HEK293T cells were dissociated by 37 °C trypsin (Invitrogen) for 2 min. Trypsinization then was stopped in 4 °C phosphate-buffered saline containing 2% fetal bovine serum and 0.05% sodium azide (FACS buffer). Although trypsin could cleave the extracellular N-terminal domain, thereby removing the FLAG epitope, the relative surface expression profile of FLAG-tagged subunits from cells dissociated by trypsin was similar to that of cells dissociated by protease-free cell detaching solution (2 mm EDTA in phosphate-buffered saline) (data not shown).
Following washes with FACS buffer, cells were incubated with anti-FLAG IgG directly conjugated with R-phycoerythrin (1:50 dilution; Martek) for 1 h. Cells were then washed with FACS buffer again and fixed with 2% paraformaldehyde. Samples were run on a BD Biosciences FACSCalibur system equipped with 488 nm argon ion and 635 nm red diode lasers. For each staining condition, 50,000 cells were analyzed. Nonviable cells were excluded from analysis based on forward and side scatter profiles (not shown) as determined by staining with 7-aminoactinomycin D (Invitrogen), which was excited using the 488 nm laser and detected with a 670-nm long pass filter (FL3). The R-phycoerythrin fluorophore was excited using the 488 nm laser and detected with a 585/42 bandpass filter (FL2). Data were acquired using CellQuest (BD Biosciences) and analyzed off line using FlowJo 7.1 (Treestar, Inc.). For each sample, the fluorescence index was calculated by determining the percentage of positively transfected cells (i.e. cells with a fluorescence intensity greater than 99% of mock-transfected cells) and multiplying this value by the mean fluorescence intensity of those cells. The fluorescence index of each experimental condition was then normalized to that of the control condition (i.e. α1FLAGβ2 or α1β2FLAG) for comparison. Unless otherwise specified, a one-way analysis of variance with Tukey's post-test was used to determine whether there were significant differences in surface levels among transfection conditions. Data are expressed as mean ± S.D.
Multiple Sequence Alignment—45 polypeptide sequences of human Cys-loop superfamily receptor subunits were aligned using Multalin software (26). Penalties (subtractions of alignment scores) were applied to insertion and extension of internal gaps and also to terminal gaps. This was required for proper alignment of C-terminal domains.
Immunoblotting—Membrane proteins in transfected cells were extracted in modified radioimmune precipitation assay (RIPA) buffers containing 10–50 mm Tris-HCl (pH 7.4), 150 mm NaCl, 1.0 mm EDTA, 1–2% Nonidet P-40, 0.25–0.5% sodium deoxycholate, and protease inhibitor mixture (Complete Mini, Roche Applied Science). Cell lysates were cleaned by centrifugation at 10,000 × g for 30 min. The supernatants were subjected to further experiments or directly to SDS-PAGE. Proteins in gels were transferred to polyvinylidene fluoride membranes (Millipore).
Monoclonal anti-GABAA receptor α1 subunit antibodies (final concentration, 5 μg/ml; clone BD24, Chemicon) and monoclonal anti-GABAA receptor β2/3 antibodies (4 μg/ml; clone 62-3G1, Upstate) were used to detect wild type or modified human α1 and β2 subunits, respectively. Anti-Na+/K+-ATPase antibodies (0.2 μg/ml; clone ab7671, Abcam) were used to check loading variability. Following incubation with primary antibodies, secondary goat anti-mouse IgG heavy and light chain antibodies conjugated with horseradish peroxidase were used at 1:10,000× dilution (Jackson ImmunoResearch Laboratories) for the visualization of specific bands in the enhanced chemiluminescence detection system (Amersham Biosciences).
The signals were collected in a digital ChemImager (Alpha Innotech). The integrated density volumes (IDVs; pixel intensity × mm2) were then calculated using the FluorChem 5500 software. To compare the expression levels between the same subtype subunits with different mutations, we normalized adjusted IDVs (normalized to loading control Na+/K+-ATPase IDVs) to those of control conditions (coexpression of wild type α1 and β2 subunits).
Glycosidase Digestion—Whole cell lysates obtained from 10 mm-Tris RIPA buffer (10 mm Tris-HCl, 150 mm NaCl, 1.0 mm EDTA, 1% Nonidet P-40, and 0.25% sodium deoxycholate) extraction were subjected to endo H and peptide N-glycosidase-F digestion (New England Biolabs) following the manufacturer's recommended protocol. The digestion reactions were carried out at 37 °C for 3 h and terminated by addition of sample buffer.
Brefeldin A Treatment—The forward trafficking of fully assembled GABAA receptors is a slow process. Although pentamer formation peaks 6 h after de novo synthesis, appreciable surface expression is not detected until 8 h after subunit synthesis (27). Thus, to block fully assembled receptor pentamers from trafficking beyond the ER and being expressed on the cell surface, HEK293T cells were treated with 0.5 μg/ml brefeldin A (Sigma) 6 h after transfection, and 24 h after transfection, cells were harvested. The surface and total cellular protein levels were then measured using flow cytometry and immunoblots, respectively.
Analytic Centrifugation—The use of sucrose density gradient fractionation to analyze the size of GABAA receptor subunit protein complexes has been described previously (28, 29). Membrane proteins were extracted using high detergent RIPA buffer, which consisted of 25 mm Tris-HCl (pH 7.4), 150 mm NaCl, 1 mm EDTA, 2% Nonidet P-40, and 0.5% sodium deoxycholate. Supernatants were loaded on a 5–20% sucrose density gradient in high detergent RIPA buffer with protease inhibitors. To calibrate each gradient, bovine serum albumin was added as a control marker (sedimentation coefficient of 4.3 S). Endogenous aldolase was used as a second marker (sedimentation coefficient of 7.4 S). To separate protein complexes of different sizes, gradients were centrifuged in a Beckman SW41 rotor at 33,500 rpm for 20 h at 4 °C. Each gradient was then manually fractionated at 500-μl intervals. The distributions of GABAA receptor subunits and protein markers within the sucrose density gradients were analyzed by Western blot.
Immunoprecipitation—Protein complexes containing FLAG-tagged GABAA receptor subunits were immunoprecipitated using EZview Red anti-FLAG M2 beads (Sigma) at 4 °C overnight. After three washes with extracting RIPA buffer, protein complexes were eluted with 100 μg/ml FLAG peptide (Sigma). The presence of GABAA receptor subunits was determined by Western blot.
RESULTS
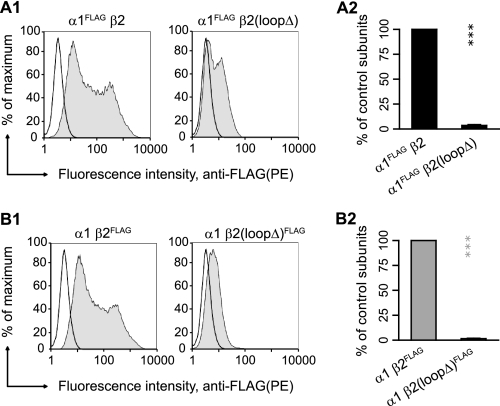
The β2 Subunit M3-M4 Loop Was Important for α1β2 Receptor Surface Expression—The β2 subunit cytoplasmic M3-M4 loop contains several important protein binding motifs (Fig. 1) (22–24). To determine how these motifs influenced GABAA receptor surface expression, a β2 subunit construct lacking the majority of the M3-M4 loop (β2K339–R451) was generated (β2(loopΔ)). Twelve amino acids at the N terminus of the loop, β2N327–Q338, were retained to link the M3 and M4 domains. To monitor surface expression of the α1, β2, and β2(loopΔ) subunits, the FLAG epitope was inserted into each subunit (see “Experimental Procedures”). FLAG-tagged subunits were then coexpressed with untagged partnering subunits (e.g. α1FLAG with β2 or β2(loopΔ) subunits and α1 with β2FLAG or β2(loopΔ)FLAG subunits), and surface FLAG levels were measured using flow cytometry (Fig. 2). For comparison, surface FLAG levels in each experimental condition (i.e. α1FLAGβ2(loopΔ) or α1β2(loopΔ)FLAG) were expressed as a percentage of surface FLAG levels in the corresponding “control” condition (i.e. α1FLAGβ2 or α1β2FLAG, respectively). Note that the α1FLAG and the β2FLAG subunits in the control conditions will subsequently be referred to as control subunits.
FIGURE 1.
Theβ2 subunit M3-M4 loop contains multiple protein binding motifs. C-terminal and N-terminal portions of β2 subunit M3 and M4 transmembrane domains, respectively, are highlighted in gray. The numbers above the sequences indicate the start and finish of the M3-M4 loop and its known protein binding motifs (underlined). The names of directly associated proteins are indicated beneath the sequence. The numbering is relative to the first amino acid of the immature polypeptide.
FIGURE 2.
Deletion of the β2 subunit M3-M4 loop, β2K339-R451Δ, substantially reduced α1β2 receptor surface expression. A1, representative distributions of R-phycoerythrin (PE) fluorescence intensities for cells coexpressing α1FLAGβ2(left panel) or α1FLAGβ2(loopΔ)(right panel) subunits and stained with a R-phycoerythrin-conjugated monoclonal anti-FLAG antibody (M2 clone) were plotted as frequency histograms. The x axis indicates the fluorescence intensity in arbitrary units (note the log scale), and the y axis indicates the percentage of the maximum cell count. Representative distributions obtained from mock-transfected cells (unfilled histograms) are overlaid with each experimental distribution (filled histograms). A2, surface α1FLAG subunit levels were quantified using the fluorescence index (see “Experimental Procedures”) and plotted as a percentage of control α1FLAGβ2 subunit coexpression. B1 and B2, as in A1 and A2 except for cells coexpressing α1β2FLAG (left panel) or α1β2(loopΔ)FLAG (right panel) subunits. Values reported are mean ± S.D. *** corresponds to p < 0.001 compared with the control subunit coexpression.
For α1β2 and α1β2(loopΔ) subunit coexpression, representative histograms of fluorescence intensity of viable cells were obtained (Fig. 2, A1 and B1). Relative to mock expression (unfilled histogram), the fluorescence intensity histograms obtained with control subunit coexpression (filled histogram) were substantially right-shifted (Fig. 2, A1 and B1, left panels). In contrast, the fluorescence intensity histograms obtained with α1β2(loopΔ) subunit coexpression (Fig. 2, A1 and B1, right panels) were less right-shifted. Quantifying the flow cytometry data (see “Experimental Procedures”) demonstrated that coexpression of α1 and β2(loopΔ) subunits yielded only 4 and 2% of control subunits, respectively (n = 5). This suggested that motifs or residues in the deleted portions of the β2 subunit M3-M4 loop, β2K339–R451, were required for GABAA receptor surface expression.
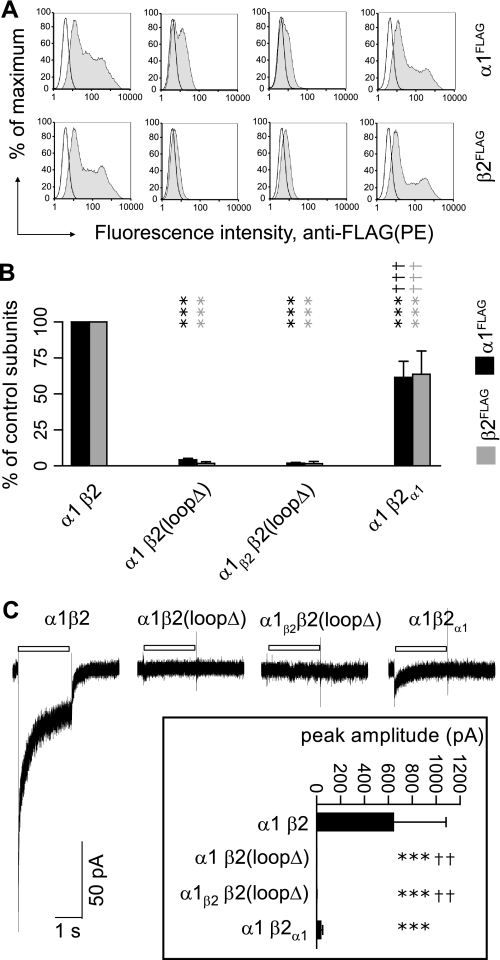
Insertion of the α1 Subunit M3-M4 Loop into the β2(loopΔ) Subunit Partially Restored α1β2 Receptor Surface Expression—Based on evidence that N-terminal domains are sufficient to mediate receptor oligomerization (18, 19), it was assumed that α1β2 pentamer assembly was not affected by the β2 subunit loop deletion. We thus hypothesized that the basis for the absence of α1β2-(loopΔ) receptor surface expression was that the β2 subunit M3-M4 loops contained a motif required for receptor forward trafficking. To test this hypothesis, the β2 subunit M3-M4 loop, β2N327–R451, was introduced into the α1 subunit (α1β2 construct), and this chimeric subunit was coexpressed with the β2(loopΔ) subunit. However, surface levels in this condition were not different from those observed with α1β2(loopΔ) subunit coexpression (for both α1 and β2 subunits, surface levels were 2% of control subunits, p < 0.001, n = 5; Fig. 3B). Therefore, failure to express surface α1β2(loopΔ) receptors was not due to absence of a forward trafficking motif in the β2 subunit M3-M4 loops. Interestingly coexpression of the β2α1 (the β2 subunit containing the α1 subunit M3-M4 loop, α1N335–R421) and α1 subunits led to surface levels that were intermediate between control and α1β2(loopΔ) surface levels (α1 and β2α1 levels were 62 and 64% of control subunits, respectively; Fig. 3B). This indicated that the α1 subunit M3-M4 loop alone could support receptor surface expression and suggested that α1 and β2 subunits shared a motif that was essential for receptor surface expression.
FIGURE 3.
Replacement of β2 subunit M3-M4 loops by α1 subunit M3-M4 loops partially rescued surface expression of α1β2 receptors. A, representative fluorescence histograms of cells with control α1β2(first column), α1β2(loopΔ) (second column), α1β2β2(loopΔ) (third column), or α1β2α1 (fourth column) subunit coexpression were generated. Upper panels indicate surface α1FLAG subunit levels; lower panels indicate surface β2FLAG subunit levels. B, surface α1FLAG (black bars) and β2FLAG (gray bars) subunit levels were quantified in each condition as a percentage of control subunit coexpression. Values reported are mean ± S.D. C, representative currents were obtained using rapid drug application from cells with control α1β2, α1β2(loopΔ), α1β2β2(loopΔ), and α1β2α1 subunit coexpression in response to a 2-s pulse of 1 mm GABA. The duration of GABA application is indicated by a white bar above the current traces. The inset shows mean peak current amplitudes of each condition. Values reported are mean ± S.E. *** indicates p < 0.001 relative to control α1β2 subunit coexpression. †† and ††† indicate p < 0.01 and p < 0.001, respectively, relative to α1β2(loopΔ) subunit coexpression. PE, R-phycoerythrin.
To determine how receptor surface levels correlated with channel function, GABA (1 mm) was applied for 2 s to cells coexpressing control, α1β2(loopΔ), α1β2β2(loopΔ), or α1β2α1 subunits. As shown previously, rapidly desensitizing currents with an average peak amplitude of 644 pA were evoked by GABA from cells coexpressing α1 and β2 subunits (Fig. 3C) (30). In addition, GABA-evoked currents were not detected from cells coexpressing α1β2(loopΔ) or α1β2β2(loopΔ) subunits, a finding consistent with measurements of subunit surface levels using flow cytometry (Fig. 3B). However, the average amplitude of currents obtained from cells expressing α1β2α1 subunits (34 pA) was only 5% of that obtained from cells expressing control receptors. Given that α1β2α1 receptor surface levels were approximately half of control receptor levels, this suggested that the β2 subunit M3-M4 loop contained motifs important for channel function and, importantly, demonstrated that changes in surface expression do not always correlate with current amplitudes. Although this finding was of interest, our primary goal was to understand the role of the M3-M4 loop in regulating receptor biogenesis, and we thus deferred further functional characterization.
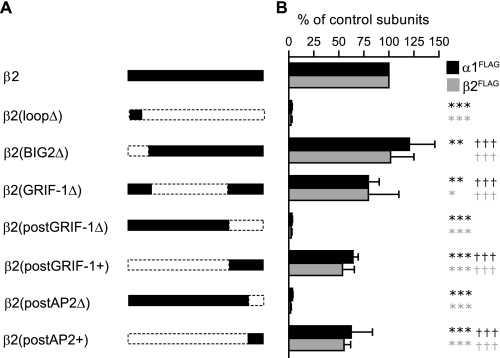
Fourteen Amino Acids at the Distal End of the β2 Subunit M3-M4 Loop Were Required for α1β2 Receptor Surface Expression—To determine the molecular mechanism for the β2(loopΔ) subunit-induced reduction of α1β2 receptor surface expression, constructs were generated with smaller portions of the β2 subunit M3-M4 loop deleted (Fig. 4A). The M3-M4 loop contains BIG2, GRIF-1, and AP2 protein binding motifs that are known to be involved in receptor trafficking or endocytosis. Thus, three β2 subunits with deletions in the M3-M4 loops were made, including deletions of BIG2 and GRIF-1 binding domains (β2(BIG2Δ and β2(GRIF-1Δ) subunits) and the 32-amino acid region C-terminal to the GRIF-1 binding motif (β2(postGRIF-1Δ) subunit) (Fig. 1). Coexpression of β2(BIG2Δ) with α1 subunits led to a small but significant increase of α1 subunit surface levels (121% of control α1 subunits, p < 0.01, n = 6) but no significant change in β2(BIG2Δ) subunit surface levels relative to control condition (Fig. 4B). With coexpression of α1 and β2(GRIF-1Δ) subunits, surface levels of both subunit types were slightly reduced (both types of subunits were 80% of control α1 and β2 levels, p < 0.01 for α1 subunits and p < 0.05 for β2(GRIF-1Δ) subunits, n = 6) (Fig. 4B). In contrast, coexpression of the β2(postGRIF-1Δ) subunit with the α1 subunit reduced receptor surface levels to those observed with α1β2(loopΔ) subunit coexpression (3 and 2% of control α1 and β2 subunit levels, respectively) (n = 7; Fig. 4B). Based on these results, we narrowed the region of interest to the C-terminal portion of the β2 M3-M4 loop. A complementary construct that contained only the postGRIF-1 region to link the M3 and M4 domains, β2(GRIF-1+) subunit was then made to determine whether the postGRIF-1 region was sufficient to support receptor surface expression. α1 and β2(postGRIF-1+) subunits were expressed with surface levels 64 and 54% of control α1 and β2 subunits (p < 0.001, n = 8) (Fig. 4B), respectively, and had higher surface levels than those observed with α1β2(loopΔ) and α1β2(postGRIF1Δ) subunit coexpression (p < 0.001, n = 8 for both subunits and both transfection conditions; Fig. 4B).
FIGURE 4.
Segmental deletions of the β2 subunit M3-M4 loop decreased α1β2 receptor surface levels. A, schematics of the β2 subunit M3-M4 loop segmental deletion constructs are shown. β2(loopΔ), β2(BIG2Δ), β2(GRIF-1Δ), β2(postGRIF-1Δ), β2(postGRIF-1+), β2(postAP2Δ), and β2(postAP2+) represent β2K339–R451Δ, β2N327–K344Δ, β2A348–L418Δ, β2R420–R451Δ, β2N327–E419Δ, β2I438–R451Δ, and β2N327–K437Δ, respectively. Retained regions of the M3-M4 loop are shown in black; deleted regions are bordered by dotted lines. B, relative surface expression levels of α1FLAG (black bars) and β2FLAG (gray bars) subunits when each of the β2 subunit deletion constructs was coexpressed with a wild type α1 subunit. Values reported are mean ± S.D. *, **, and *** indicate p < 0.05, p < 0.01, and p < 0.001, respectively, relative to control α1β2 subunit coexpression. ††† indicates p < 0.001 relative to α1β2(loopΔ) subunit coexpression.
Because the β2 subunit postGRIF-1 region contained the AP2 protein binding motif, this region was further divided into three subregions: preAP2 (residues Arg420–Lys425), AP2 (residues Lys426–Lys437), and postAP2 (residues Ile438–Arg451). Again coexpression of β2(postAP2Δ), the construct lacking the region downstream of the AP2 protein binding motif, with the α1 subunit reduced subunit surface levels to those observed with coexpression of α1 and β2(loopΔ) subunits (Fig. 4B). Additionally to determine whether this region was sufficient for α1 and β2 subunit surface expression, a construct that contained only 14 amino acids distal to the AP2 motif to link the M3 and M4 domains was made (β2(postAP2+) subunit) (Fig. 4A). Supporting the sufficiency of the postAP2 region, α1β2(postAP2+) and the α1β2(postGRIF1+) receptor surface levels were not significantly different (Fig. 4B). Taken together, these results suggested that the stretch of 14 amino acids after the AP2 binding motif played a major role in supporting surface expression of α1β2 receptors (more than 50% of control receptors; Fig. 4B).
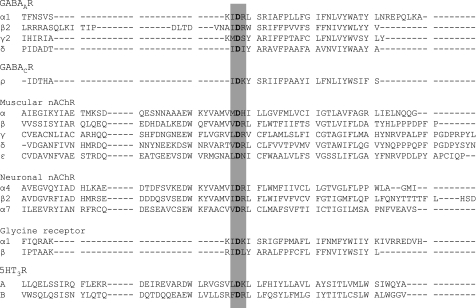
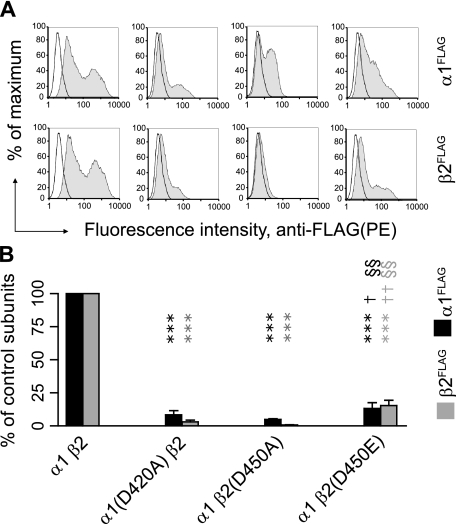
A Conserved Aspartate Residue Was Required for α1β2 Receptor Surface Expression—By comparing the α1 and β2 subunit M3-M4 loop sequences, only three amino acids, IDR, were found to be shared between α1 and β2 subunits in the β2 subunit postAP2 region (Fig. 5). Furthermore multiple sequence alignments showed that the aspartate in the IDR motif was conserved in the entire Cys-loop receptor superfamily (Fig. 5). We thus hypothesized that the loss of this residue was responsible for the observed loss in receptor surface expression. To test this hypothesis, the conserved aspartate was mutated to alanine in the α1 and β2 subunits, and the surface levels of α1(D420A)β2 and α1β2(D450A) receptors were measured using flow cytometry. Relative to the control condition, the α1(D420A) mutation caused more than a 90% reduction in surface levels of both α1(D420A) and β2 subunits, whereas the β2(D450A) mutation resulted in more than a 95% surface reduction of both subunits (n = 4) (Fig. 6, A and B), demonstrating that the conserved aspartate residue was required for receptor surface expression.
FIGURE 5.
Alignment of human Cys-loop receptor subunits revealed a conserved aspartate residue at the junction of the M3-M4 loop and the M4 domain. Partial sequences surrounding the junction of the M3-M4 cytoplasmic loop and the M4 transmembrane domain are shown for a subset of Cys-loop receptor subunits. The dashes represent gaps in the alignment. The IDR and comparable motifs are highlighted in gray, and the conserved aspartate residues are bold. Note that all 45 known human Cys-loop receptor subunits contain this residue. GABACR, GABAC receptor; GABAAR, GABAA receptor; 5HT3R, 5-hydroxytryptamine type 3 receptor.
FIGURE 6.
Mutation of the conserved M3-M4 aspartate residue in either α1 or β2 subunits markedly reduced α1β2 receptor surface levels. A, representative fluorescence histograms of cells with control α1β2(first column), α1(D420A)β2(second column), α1β2(D450A) (third column), or α1β2(D450E) (fourth column) subunit coexpression were generated. Upper panels indicate surface α1FLAG subunit levels; lower panels indicate surface β2FLAG subunit levels. B, surface α1FLAG (black bars) and β2FLAG (gray bars) subunit levels were quantified in each condition as a percentage of control subunit coexpression. Values reported are mean ± S.D. *** indicates p < 0.001 relative to control α1β2 subunit coexpression. † and †† indicate p < 0.05 and p < 0.01, respectively, relative to α1(D420A)β2 subunit coexpression. §§ indicates p < 0.01 relative to α1β2(D450A) subunit coexpression. PE, R-phycoerythrin.
To determine whether the loss of negative charge conferred by the aspartate residue was an important factor in the loss of surface expression, the conserved β2 subunit aspartate (Asp450) was mutated to glutamate, which is structurally conserved and has the same charge as aspartate. Expression of the β2(D450E) subunit, however, yielded α1β2 receptor surface levels that were still less than 10% of control levels. Although the reduction was significantly lesser than that produced by the Asp to Ala mutations (p < 0.05 for α1 subunits and p < 0.01 for β2 subunits as compared between α1(D420A)β2 and α1β2(D450E) expression; p < 0.01 for comparison between α1β2(D450A) and α1β2(D450E) expression for both subtypes of subunits; n = 4) (Fig. 6, A and B), the results nonetheless suggested that the loss of charge of the aspartate residue was not responsible for the reduction of receptor surface expression.
The α1(D420A) or β2(D450A) Subunit Mutations Reduced Total Protein Levels and Promoted ER Retention of Mutant and Partnering Subunits—There are several possible explanations for the low surface levels of α1(D420A) and β2(D450A) subunits. These include accelerated degradation, inefficient assembly, impaired forward trafficking, and decreased cell surface stability. For multimeric subunit protein complexes such as the GABAA receptor, the ER is the front line of quality control where misfolded and/or improperly assembled subunits are retained. Indeed several mutations associated with idiopathic generalized epilepsies have been shown to cause ER retention of GABAA receptor subunits (3, 4, 17, 31). We thus first determined whether the loss of α1(D420A)β2 and α1β2(D450A) receptor surface expression was associated with ER retention. To explore this possibility, we took advantage of the fact that GABAA receptor subunits are glycosylated proteins and that oligosaccharide processing in the Golgi compartment confers resistance to endo H digestion (32). As a result, GABAA receptor subunits that are ER-retained should display endo H sensitivity, and endo H digestion should reduce the ER-retained subunit molecular mass to that produced by peptide N-glycosidase-F digestion (which removes all N-linked carbohydrates).
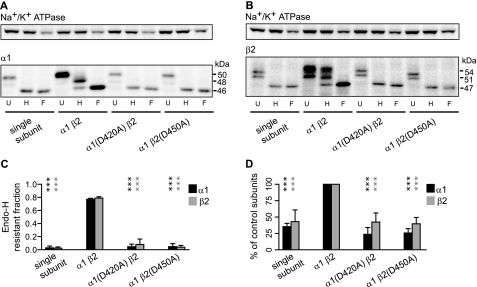
Endo H resistance was determined for α1 and β2 subunits expressed alone and also with α1β2, α1(D420A)β2, and α1β2(D450A) subunit coexpression (Fig. 7). In agreement with reports that single subunits were retained in the ER (14), expression of α1 or β2 subunits alone resulted in no visible bands with molecular masses higher than 46 kDa (for α1) or 48 kDa (for β2) after endo H digestion. Furthermore the patterns for single subunit endo H digestions showed no difference from those for peptide N-glycosidase-F digestions (Fig. 7, A and B). Quantification of the endo H-resistant fractions indicated that less than 3% of total proteins were endo H-resistant (Fig. 7C). In contrast, ∼80% of α1 or β2 subunit total proteins were endo H-resistant with control α1β2 subunit coexpression as represented by the presence of bands with molecular masses higher than 46 kDa (for α1) and 48 kDa (for β2) following endo H digestion (Fig. 7, A, B, and C). The Asp to Ala mutations resulted in receptor subunit ER retention, and no more than 8% of α1 or β2 subunit total proteins were endo H-resistant with α1(D420A)β2 and α1β2(D450A) subunit coexpression (Fig. 7, A, B, and C).
FIGURE 7.
Mutation of the conserved aspartate residue resulted in reduced subunit total protein levels and ER retention of both mutant and partnering subunits. A, 10 mm Tris-RIPA buffer-extracted proteins from expression of the α1 subunit alone (“single subunit”) or coexpression of α1β2, α1(D420A)β2, and α1β2(D450A) subunits were undigested (U) or digested with endo H (H) or peptide N-glycosidase-F (F). An equal amount of total protein was loaded in each well. The undigested α1 subunits had mobility mainly at 50 kDa with a less apparent band that migrated at 48 kDa. After endo H digestion, α1 subunits with mobility equal to that of subunits digested with peptide N-glycosidase-F (46 kDa) were considered endo H-sensitive, whereas those with a higher molecular mass were considered endo H-resistant. B, the criteria used in A were used to distinguish endo H-sensitive and -resistant populations of β2 subunits. Therefore, subunits that migrated at 54 and 51 kDa were considered to be endo H-resistant, whereas those that migrated at 47 kDa were considered to be endo H-sensitive. C, the fractions of endo H-resistant populations of total α1(black bars) or β2(gray bars) subunits in the four expression conditions were quantified by dividing the IDVs of the endo H-resistant bands by the summed IDVs of the endo H-resistant and -sensitive bands. D, total subunit levels in each of the four expression conditions were compared. IDVs of α1 or β2 subunits were normalized to those obtained with control subunit coexpression. Values reported are mean ± S.D. *** indicates p < 0.001 relative to control subunit coexpression.
Interestingly although the α1(D420A) and β2(D450A) subunit endo H-resistant fractions were significantly different from those of the control condition, they were not significantly different from those with single subunit expression. Similarly although both α1 and β2 subunit total protein levels were reduced with α1(D420A)β2 and α1β2(D450A) subunit coexpression, total subunit levels were not significantly different from those with single subunit expression (Fig. 7D). Thus, the results revealed that the majority of subunits with α1(D420A)β2 and α1β2(D450A) subunit coexpression were not distributed in compartments beyond the ER and moreover demonstrated that mutant subunits were processed similarly to individually transfected wild type subunits.
The Loss of Receptor Surface Expression Caused by the Asp to Ala Mutation Was Not Due to Impaired Forward Trafficking or Accelerated Endocytosis from the Cell Surface—The observation that mutant subunits were retained in the ER suggested that the loss of receptor surface expression was mediated either by impaired receptor assembly or, alternatively, by impaired forward trafficking of normally assembled receptors. However, the possibility also remained that receptors were normally assembled and forward trafficked but that surface levels appeared reduced because of markedly accelerated endocytosis. To distinguish between altered trafficking (either due to a decreased rate of forward trafficking or an increased rate of endocytosis) and impaired assembly, forward trafficking of receptors was blocked by brefeldin A, a compound that inhibits receptor trafficking beyond the ER by collapsing the Golgi apparatus (33). Indeed if the loss of surface expression was caused by accelerated endocytosis, then in the absence of an appreciable surface pool, total expression levels should be the same for those subunits with control and mutant subunit coexpression. Similarly if mutant subunits had impaired forward trafficking, then there should be no difference in total expression levels between wild type and mutant receptors when neither is capable of leaving the ER. In contrast, if assembly of mutant subunits was compromised, then the reduction in total expression would still be expected even when forward trafficking is blocked.
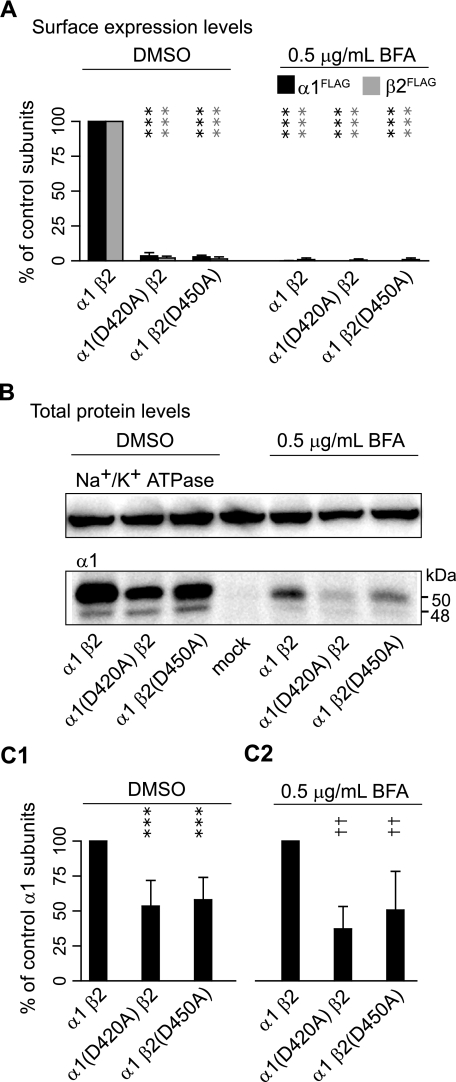
Measuring receptor subunit surface levels using flow cytometry revealed that 0.5 μg/ml brefeldin A successfully blocked cellular forward trafficking as surface levels of control subunits were similar to those observed with α1(D420A)β2 or α1β2(D450A) subunit coexpression (n = 4; Fig. 8A). Although treatment with brefeldin A decreased total expression levels for all conditions presumably due to its cellular toxicity, total protein levels were still substantially higher with control α1β2 subunit coexpression than with α1(D420A)β2 or α1β2(D450A) subunit coexpression (p < 0.01 for both conditions; n = 5) (Fig. 8, B and C2). Thus, the accumulation of mutant subunits in the ER and reduction in total subunit levels could not be attributed to impaired forward trafficking or accelerated endocytosis of mutant receptors. Instead the results suggested that mutation of the conserved aspartate residue affected early steps in receptor biogenesis.
FIGURE 8.
Control subunit total protein levels remained higher than those with α1(D420A)β2 or α1β2(D450A) subunit coexpression when retained in the ER. A, surface α1FLAG (black bars) and β2FLAG (gray bars) subunit levels were quantified in each condition as a percentage of control α1β2 subunit coexpression after applying either DMSO (left) or 0.5 μg/ml brefeldin A(BFA; right) 6 h after transfection. B, immunoblots measuring Na+/K+-ATPase (upper panel; loading control) and α1 subunit (lower panel) total protein levels with α1β2, α1(D420A)β2, or α1β2(D450A) subunit coexpression after applying either DMSO (left) or 0.5 μg/ml brefeldin A (right) 6 h after transfection. C1, normalized total α1 protein levels with DMSO treatment. C2, normalized total α1 protein levels with brefeldin A treatment. Values reported are mean ± S.D. *** indicates p < 0.001 relative to control subunit coexpression with DMSO treatment. †† indicates p < 0.01 relative to control subunit coexpression with brefeldin A treatment.
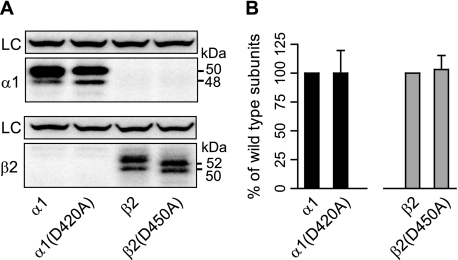
With Single Subunit Expression, Mutant α1(D420A) and β2(D450A) Subunits Had the Same Total Protein Levels as Wild Type Subunits but Different Glycosylation Patterns—We demonstrated previously that the GABAA receptor α1(A322D) mutation caused subunit misfolding that resulted in rapid ER-associated degradation of mutant subunits prior to oligomerization (15). To determine whether the total protein reductions observed with α1(D420A)β2 and α1β2(D450A) subunit expression were caused also by reductions in individual subunit availability, we compared expression of individual wild type α1 and β2 subunits with that of individual α1(D450A) and β2(D450A) subunits. Interestingly we found that total protein levels of α1 or β2 single subunits were not significantly reduced by the Asp to Ala mutations (Fig. 9, A and B), suggesting that the mutation did not cause gross subunit misfolding (which would have been expected to trigger subunit degradation) (15). Both mutant subunits, however, had altered glycosylation patterns, indicating that their cellular processing was abnormal. The β2(D450A) mutation shifted the molecular masses of the two major bands from 54 and 51 kDa to 52 and 50 kDa (Fig. 9A), and although the α1(D420A) mutation did not produce mobility shifts, it increased the population migrating at 48 kDa at the expense of the population migrating at 50 kDa (Fig. 9A).
FIGURE 9.
Single subunit total protein levels were determined using Western blot analysis. A, total proteins were extracted from cells expressing single α1, α1(D420A), β2, or β2(D450A) subunits using high detergent RIPA buffer and immunoblotted with monoclonal anti-α1(upper panels) and anti-β2(lower panels) antibodies. Note that two nonspecific bands were detected with the anti-β2 antibodies (lower panels, first two lanes). Na+/K+-ATPase was used as loading control (LC). B, total protein levels with single subunit expression were quantified. Black bars represent α1 subunit levels; gray bars represent β2 subunit levels. To control for loading variability, the specific IDVs of α1 or β2 subunits were normalized to those of Na+/K+-ATPase. To compare wild type and mutant subunits, the adjusted IDVs of mutant subunits were further normalized to those of wild type subunits. Values reported are mean ± S.D.
The α1(D420A) and β2(D450A) Mutations Impaired α1β2 Receptor Pentamer Formation—The results in the previous sections suggested that mutation of the conserved aspartate residue in α1 or β2 subunits likely affected receptor biogenesis prior to pentameric forward trafficking and did not likely affect the availability of subunits for assembly. Thus, reduction of mutant and partnering subunit surface and total proteins to levels similar to those with single subunit expression could be the result of impaired assembly. To evaluate this possibility, analytic centrifugation was conducted to investigate the mass and shape of protein complexes with single subunit expression and with α1β2, α1(D420A)β2, and α1β2(D450A) subunit coexpression.
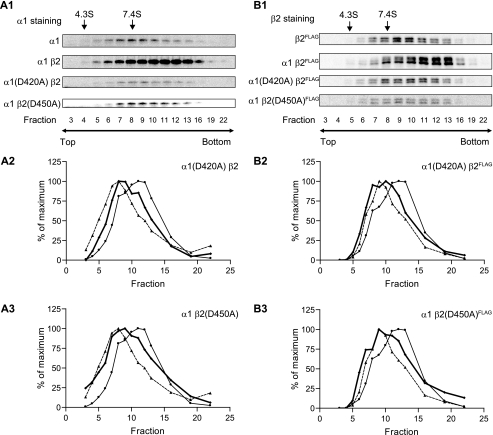
Analyses using 5–20% sucrose density gradients revealed that the sedimentation coefficient of the α1 subunit transfected alone was 7.4 S, which was slightly higher than the previously reported 5 S coefficient (27, 28). The sedimentation coefficient of α1β2 receptor complexes was 10.5 S, which was also higher than the previously reported 9 S coefficient (27, 28). The subpopulation of α1β2 receptors that migrated as protein complexes smaller than 10.5 pentamers was assumed to be incompletely assembled subunit monomers or oligomers (Fig. 10, A2 and B2). In contrast, the major receptor population formed with α1(D420A)β2 and α1β2(D450A) subunits had a sedimentation coefficient of 7.4 S with a profile that appeared to overlap with that of single subunit expression. However, a subpopulation was evident with a sedimentation coefficient higher than 9 S, suggesting that some pentamer formation could not be excluded entirely (Fig. 10, A2, A3, B2, and B3). Nonetheless even if this was the case, the results demonstrated that pentameric assembly was substantially impaired by mutation of the conserved aspartate residue. It should be noted that the observed shifts to sedimentation coefficients higher than those predicted may have been caused by the strong association of interacting proteins with receptor complexes.
FIGURE 10.
GABAA receptor protein complexes were analyzed using sucrose density gradients. Whole cell lysates were extracted using high detergent RIPA buffer and subjected to 5–20% linear sucrose density gradients. Following centrifugation to separate protein complexes of different sizes, gradients were fractionated into 23 fractions from the top to bottom. 14 fractions were selected to analyze the sedimentation coefficients using Western blot and compared with proteins with known sedimentation coefficients (bovine serum albumin, 4.3 S; aldolase, 7.4 S). The chosen fractions are indicated beneath the Western blots. A1, representative Western blots of α1 subunit staining in single subunit (α1), α1β2, α1(D420A)β2, and α1β2(D450A) expression conditions are presented. A2, the distribution of protein complexes containing α1(D420A) subunits with α1(D420A)β2 subunit coexpression was plotted (bold line). The distributions of protein complexes containing α1 subunits with single subunit expression (dotted line with ▴) or α1β2 subunit coexpression (solid line with ▴) are included for comparison. A3, as in A2 except for protein complexes containing α1 subunits with α1β2(D450A) subunit coexpression. B1, B2, and B3, as in A1, A2, and A3, except that staining was for β2FLAG subunits using anti-β2 antibodies following immunoprecipitation with anti-FLAG M2 beads (to eliminate nonspecific staining; see Fig. 9).
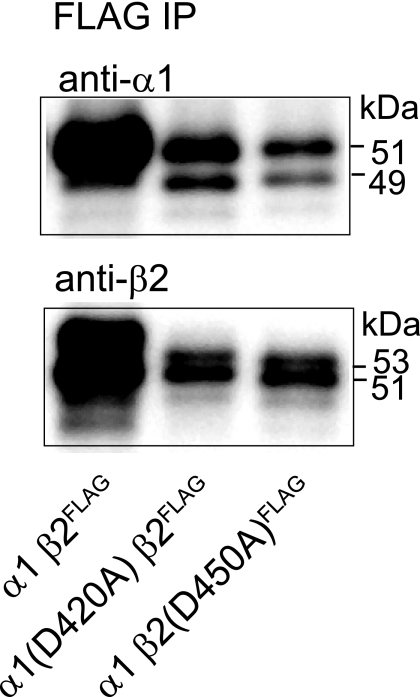
The α1(D420A) and β2(D450A) Subunits Oligomerized with Partnering Subunits—The subpopulations migrating with sedimentation coefficients higher than those of single subunit expression seen with α1(D420A)β2 and α1β2(D450A) subunit coexpression suggested that subunit oligomerization was still possible in the absence of the conserved aspartate residue. To determine whether partnering subunits could, in fact, still associate with Asp to Ala-mutated subunits, immunoprecipitation experiments were performed. With coexpression of Asp to Ala mutant and wild type partnering subunits, anti-FLAG M2 beads specifically immunoprecipitated FLAG-tagged β2 subunits whether they contained the Asp to Ala mutation or not (Fig. 11, lower panel) but did not precipitate non-FLAG-tagged β2 subunits (data not shown). Furthermore the immunoprecipitated protein complexes contained associated partnering subunits whether or not they contained the Asp to Ala mutation (Fig. 11, upper panel). Thus, the subunit surface level and total cellular protein reductions with α1(D420A)β2 and α1β2(D450A) subunit coexpression were not due to lack of subunit oligomerization.
FIGURE 11.
FLAG-tagged and partnering GABAA receptor subunits were coimmunoprecipitated. Representative immunoblots of proteins immunoprecipitated (IP) from cells with α1β2FLAG, α1(D420A)β2FLAG, and α1β2(D450A)FLAG subunit coexpression using anti-FLAG M2 beads. Immunoprecipitated proteins were detected using monoclonal anti-α1(upper panel) or anti-β2 antibodies (lower panel). Note the 1-kDa shift in molecular mass due to insertion of the FLAG epitope in the β2 subunit (compared with immunoblots of untagged subunits shown in previous figures).
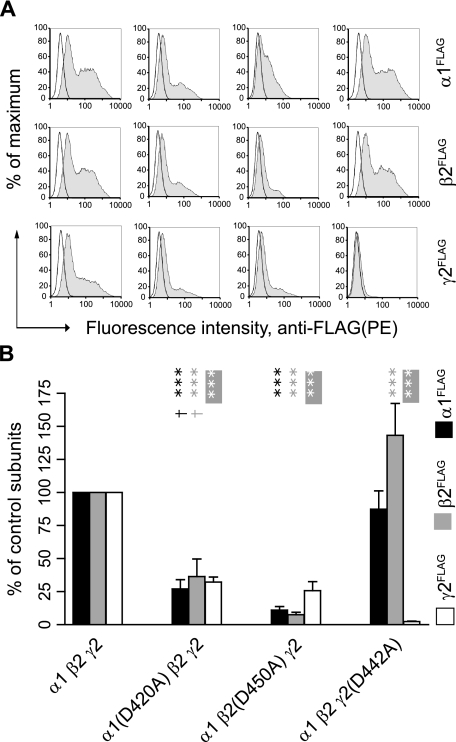
The Conserved Aspartate Residue Was Required for α1β2γ2S Receptor Surface Expression—Having established the importance of the conserved aspartate residue for binary α1β2 receptor expression, which is the simplest subunit combination supporting functional receptor surface expression, we next determined whether the conserved residue was also required for surface expression of ternary α1β2γ2S receptors. Relative to control subunits, the Asp to Ala mutation in the α1 or β2 subunit caused significant surface level reductions of mutant and partnering subunits with ternary subunit coexpression (p < 0.001 for all subtypes of subunits and for both expression categories, n = 4–7) (Fig. 12B). Subunit surface levels with α1(D420A)β2γ2S subunit coexpression were 27, 36, and 32% of control α1, β2, and γ2S subunit surface levels, respectively. With α1β2(D450A)γ2S subunit coexpression, subunit surface levels were 11, 8, and 26% of control α1, β2, and γ2S subunit surface levels, respectively. Relative to α1(D420A)β2γ2S subunit coexpression, surface levels of α1 and β2 subtype subunits with α1β2(D450A)γ2S subunit coexpression were significantly lower (p < 0.05 for both subtypes, n = 4), whereas γ2S subtype levels were not. Comparing the effects of the Asp to Ala mutation on ternary and binary receptor surface expression revealed that the presence of γ2S subunits could partially restore surface expression levels of α1 and β2 subunits when either of them contained the Asp to Ala mutation (to more than double the levels observed with binary subunit coexpression) (Fig. 6B). However, the γ2S subunit is known to be able to reach the cell surface when expressed alone (34). It is therefore possible that these partnering subunits in incompletely assembled intermediates associated with γ2S subunits and escaped from the ER.
FIGURE 12.
Mutation of the conserved aspartate residue to alanine in either α1, β2, or γ2S subunits markedly reduced α1β2γ2S receptor surface levels. A, representative fluorescence histograms of cells with control α1β2γ2S (first column), α1(D420A)β2γ2S (second column), α1β2(D450A)γ2S (third column), or α1β2γ2S(D442A) (fourth column) subunit coexpression were generated. Upper panels indicate surface α1FLAG subunit levels, middle panels indicate surface β2FLAG subunit levels, and lower panels indicate surface γ2S FLAG levels. B, surface α1FLAG (black bars), β2FLAG (gray bars), and γ2S FLAG (white bars) subunit levels were quantified in each condition as a percentage of control subunit coexpression. *** indicates p < 0.001 relative to control α1β2γ2S subunit coexpression. Values reported are mean ± S.D. † indicates p < 0.05 relative to α1β2(D450A)γ2S subunit coexpression.
Interestingly although the γ2(D442A) subunit coexpressed with α1 and β2 subunits had very low surface expression (2% of control γ2S subunits, p < 0.001, n = 4), surface levels of partnering α1 subunits were not significantly affected (87% of control α1 subunits, n = 3), and surface levels of partnering β2 subunits were even increased (143% of control β2 subunits, p < 0.001, n = 4). These data indicated that the conserved residue of the γ2S subunit was essential for α1β2γ2S receptor surface expression but not for α1β2 receptor surface expression. An explanation for this finding was that although γ2(D442A) subunits could not be incorporated into pentameric receptors, α1 and β2 subunits remained free to assemble and forward traffic.
DISCUSSION
Mutation of a Highly Conserved Aspartate Residue Decreased GABAA Receptor Surface Expression by Impairing an Early Step in Receptor Biogenesis—Using a combination of flow cytometry, M3-M4 loop swaps, segmental deletions, and multiple sequence alignments, we identified an aspartate residue that was highly conserved among members of the Cys-loop receptor superfamily and required for GABAA receptor surface expression. Analysis of subunit maturation using glycosidase digestion and Western blotting revealed that mutation of this conserved residue resulted in ER retention of both mutant and partnering subunits, thereby decreasing their surface levels. This decrease in subunit surface levels was not due to impaired forward trafficking or accelerated endocytosis as the relative total subunit levels were similar for control, α1(D420A)β2, and α1β2(D450A) subunit coexpression in the presence of brefeldin A, which prevented forward trafficking. Indeed absolute total subunit levels with α1(D420A)β2 and α1β2(D450A) subunit coexpression were still lower than the control condition in the presence of brefeldin A, suggesting that subunits were trapped in the ER because of impaired receptor assembly.
Mutation of the Conserved Aspartate Residue Compromised Pentameric Receptor Assembly without Causing Severe Subunit Misfolding—In combination, the glycosylation and brefeldin A experiments suggested that mutation of the conserved aspartate residue impaired an early step in receptor biogenesis either by decreasing subunit availability for oligomerization, impairing subunit oligomerization, or preventing complete pentameric assembly. Our results, however, argued against decreased subunit availability. We have demonstrated previously that an alanine to aspartate mutation in the GABAA receptor α1 subunit associated with juvenile myoclonic epilepsy, α1(A322D), caused protein misfolding and an increased rate of ER-associated degradation. Consequently total cellular expression of α1(A322D) subunits was significantly reduced when expressed individually (15, 17). Thus, if the α1(D420A) and β2(D450A) subunits were severely misfolded, we would have expected a similar outcome. However, with single subunit expression, mutating the conserved aspartate residues did not alter total subunit levels, suggesting that the rates of de novo synthesis and degradation of the α1(D420A) and β2(D450A) subunits were unchanged. This suggested that the observed reduction of partnering subunit total protein levels was secondary to reduced pentamer formation as neitherα1 norβ2 subunits are trafficking-competent when expressed alone (14).
Using analytic centrifugation, we provided direct evidence that the conserved aspartate residue was required for receptor assembly. In agreement with previous reports that demonstrated that intact N-terminal domains were capable of mediating intersubunit interactions (also demonstrated here using immunoprecipitation), protein complexes showing a sedimentation coefficient higher than 7.4 S with α1(D420A)β2 and α1β2(D450A) subunit coexpression were observed, indicating the presence of oligomerized subunit assembly intermediates. Although we cannot rule out the possibility that some pentamers were formed, the lack of an appreciable 10.5 S sedimentation fraction suggests that the pentameric population was relatively small. Thus, we concluded that mutating the conserved aspartate residue permitted some degree of subunit oligomerization but prevented complete assembly of pentameric receptors.
The Role of C-terminal Motifs in the Assembly of Other Cys-loop Family Members—Although this is the first report implicating a region other than the N-terminal domain in GABAA receptor assembly, the M3-M4 loop and M4 domain are known to be important for assembly of nAChRs (35). A three-amino acid deletion in the nicotinic acetylcholine receptor β subunit M3-M4 loop, β426ΔEQE, associated with congenital myasthenic syndromes has been demonstrated to impair the interaction between β and δ subunits (35). Moreover mutation of histidine 408 in the α subunit that is adjacent to the conserved aspartate residue impaired receptor assembly and reduced the 9 S pentamer population (20). The significance of the conserved aspartate residue was further emphasized by the finding that the nAChR εN436Δ subunit mutation associated with congenital myasthenic syndromes that is adjacent to the conserved aspartate residue in the ε subunit reduced α2βδε receptor surface expression as did deletion of the conserved aspartate residue, εD435Δ (5). Although it remains unclear whether this loss of surface expression also reflected impaired assembly, these examples nonetheless support the idea that C-terminal motifs are important determinants of Cys-loop receptor biogenesis.
The Conserved Aspartate Residue May Be Exposed to the Intracellular Milieu—Increasing experimental evidence suggests that the conserved aspartate residue is not buried within subunit interfaces and may actually be exposed to the intracellular milieu. For example, the His408 residue in nAChR α subunits that is adjacent to the conserved Asp407 residue was found to be labeled by the photoactivable compound 3-[3H]azioctanol (36). Thus, the region in nAChR α subunits containing the MDH motif, which is analogous to the IDR motif in GABAA receptor α1 and β2 subunits, was not protected by intersubunit interactions. Support for this hypothesis comes from homology alignments to muscle nAChRs where the conserved aspartate residue appears exposed even in the context of fully assembled pentamers (11). Furthermore mass spectrometry of a motif containing the conserved aspartate residue in glycine receptors has been demonstrated to be exposed to the intracellular milieu (37). Although a crystal structure of the GABAA receptor has yet to be generated, given the degree of homology between GABAA receptors and the remainder of the Cys-loop family, these findings suggest that the conserved aspartate residue is exposed on the surface of pentamer complex (regardless of its location in the M3-M4 loop or M4 domain).
The Conserved Aspartate Residue May Be Involved in Interactions with Other Proteins—Mutation of the conserved aspartate not only caused ER retention of α1 and β2 subunits but also affected their glycosylation patterns. Although altered glycosylation did not preclude receptor surface expression (38) (data not shown), the results nonetheless demonstrated that C-terminal motifs could affect post-translational modification of N-terminal domains. This suggested the existence of mechanisms that coordinate intracellular and extracellular protein processing. Assuming that the conserved aspartate residue is not buried within subunit interfaces, one possibility is that it interacts with transmembrane and/or cytoplasmic proteins, which in turn mediate communication between subunit domains located in extracellular, membrane, and/or intracellular environments. The observation that the conservative substitution of the aspartate residue with a glutamate residue could only partially restore receptor surface expression suggested that the residue could be located in a tightly structured environment where both charge and side-chain length play an important role for interaction. Furthermore the aspartate residue could be important for maintaining critical secondary structure for protein interaction, although this secondary structure did not impair subunit oligomerization or cause protein degradation before oligomerization.
Although the identity of the interacting cellular machinery and its distribution among different types of cells remain to be established, ER chaperones such as calnexin (a type I integral membrane protein) (39) have been shown to regulate receptor subunit folding, assembly, and half-life and are thus potential components of the yet-to-be-identified protein complex (40, 41). It is worth noting that Cys-loop superfamily receptors are present not only in neurons but also in myocytes, epithelial cells, and lymphocytes (42, 43). A naturally occurring mutation in nAChR subunit M3-M4 loops associated with congenital myasthenic syndromes has been shown to affect receptor assembly within muscle cells (35). Furthermore charged residues including the conserved aspartate in subunit M3-M4 loops have been demonstrated to affect receptor assembly in epithelium-like cells (20). Thus, the conserved aspartate residue may interact with ubiquitous cellular machinery.
Conclusions—With the simplest binary combination that allowed for functional GABAA receptor surface expression, our results demonstrated that the conserved aspartate residue at the boundary of the M3-M4 loop and the M4 transmembrane domain was required for Cys-loop receptor assembly. Consistent with this finding, Asp to Ala mutation in α1 and β2 subunits substantially decreased surface levels of ternary α1β2γ2S GABAA receptors, the most abundant isoform expressed in the mammalian brain (21). Interestingly although Asp to Ala mutation of the γ2S subunit also reduced the ternary receptor population, it did not prevent formation of binary α1β2 receptors. This reflected the fact that α1 and β2 subunits could still assemble in the absence of γ2S subunits. Notably α1 and β2 subunit surface levels were not reduced at all by the mutant γ2S subunit, supporting the hypothesis that the mutant γ2S subunit was unable to oligomerize with α1 and β2 subunits, or if it did oligomerize, the interaction was not sufficient for the γ2S subunit to have a dominant negative effect on assembly of α1β2 receptors.
Supplementary Material
Acknowledgments
We thank Michael Cooper and Andrew Link for equipment use, Aleksandar Stanic for assistance with flow cytometry, Adam Farley for critical reading of the manuscript, and Ningning Hu and Wangzhen Shen for technical assistance.
This work was supported, in whole or in part, by National Institutes of Health Grant NS33300 to (R. L. M.). The costs of publication of this article were defrayed in part by the payment of page charges. This article must therefore be hereby marked “advertisement” in accordance with 18 U.S.C. Section 1734 solely to indicate this fact.
The on-line version of this article (available at http://www.jbc.org) contains supplemental Fig. 1.
Footnotes
The abbreviations used are: GABAA, γ-aminobutyric acid, type A; GABAC, γ-aminobutyric acid, type C; endo H, endoglycosidase H; nAChR, nicotinic acetylcholine receptor; ER, endoplasmic reticulum; BIG2, brefeldin A-inhibited GDP/GTP exchange factor 2; GRIF-1, GABAA receptor-interacting factor-1; AP2, adaptor protein 2; cDNA, complementary DNA; HEK, human embryonic kidney; FACS, fluorescence-activated cell sorting; RIPA, radioimmune precipitation assay; IDV, integrated density volume.
References
- 1.Frugier, G., Coussen, F., Giraud, M. F., Odessa, M. F., Emerit, M. B., Boue-Grabot, E., and Garret, M. (2007) J. Biol. Chem. 282 3819–3828 [DOI] [PubMed] [Google Scholar]
- 2.Gallagher, M. J., Song, L., Arain, F., and Macdonald, R. L. (2004) J. Neurosci. 24 5570–5578 [DOI] [PMC free article] [PubMed] [Google Scholar]
- 3.Harkin, L. A., Bowser, D. N., Dibbens, L. M., Singh, R., Phillips, F., Wallace, R. H., Richards, M. C., Williams, D. A., Mulley, J. C., Berkovic, S. F., Scheffer, I. E., and Petrou, S. (2002) Am. J. Hum. Genet. 70 530–536 [DOI] [PMC free article] [PubMed] [Google Scholar]
- 4.Kang, J. Q., and Macdonald, R. L. (2004) J. Neurosci. 24 8672–8677 [DOI] [PMC free article] [PubMed] [Google Scholar]
- 5.Shen, X. M., Ohno, K., Sine, S. M., and Engel, A. G. (2005) Brain 128 345–355 [DOI] [PubMed] [Google Scholar]
- 6.Niesler, B., Flohr, T., Nothen, M. M., Fischer, C., Rietschel, M., Franzek, E., Albus, M., Propping, P., and Rappold, G. A. (2001) Pharmacogenetics 11 471–475 [DOI] [PubMed] [Google Scholar]
- 7.Macdonald, R. L., and Olsen, R. W. (1994) Annu. Rev. Neurosci. 17 569–602 [DOI] [PubMed] [Google Scholar]
- 8.Le Novere, N., and Changeux, J. P. (1999) Nucleic Acids Res. 27 340–342 [DOI] [PMC free article] [PubMed] [Google Scholar]
- 9.Millar, N. S. (2003) Biochem. Soc. Trans. 31 869–874 [DOI] [PubMed] [Google Scholar]
- 10.Lynch, J. W. (2004) Physiol. Rev. 84 1051–1095 [DOI] [PubMed] [Google Scholar]
- 11.Unwin, N. (2005) J. Mol. Biol. 346 967–989 [DOI] [PubMed] [Google Scholar]
- 12.Smith, M. M., Lindstrom, J., and Merlie, J. P. (1987) J. Biol. Chem. 262 4367–4376 [PubMed] [Google Scholar]
- 13.Green, W. N., and Claudio, T. (1993) Cell 74 57–69 [DOI] [PubMed] [Google Scholar]
- 14.Connolly, C. N., Krishek, B. J., McDonald, B. J., Smart, T. G., and Moss, S. J. (1996) J. Biol. Chem. 271 89–96 [DOI] [PubMed] [Google Scholar]
- 15.Gallagher, M. J., Ding, L., Maheshwari, A., and Macdonald, R. L. (2007) Proc. Natl. Acad. Sci. U. S. A. 104 12999–13004 [DOI] [PMC free article] [PubMed] [Google Scholar]
- 16.Wang, J. M., Zhang, L., Yao, Y., Viroonchatapan, N., Rothe, E., and Wang, Z. Z. (2002) Nat. Neurosci. 5 963–970 [DOI] [PubMed] [Google Scholar]
- 17.Gallagher, M. J., Shen, W., Song, L., and Macdonald, R. L. (2005) J. Biol. Chem. 280 37995–38004 [DOI] [PubMed] [Google Scholar]
- 18.Klausberger, T., Sarto, I., Ehya, N., Fuchs, K., Furtmuller, R., Mayer, B., Huck, S., and Sieghart, W. (2001) J. Neurosci. 21 9124–9133 [DOI] [PMC free article] [PubMed] [Google Scholar]
- 19.Hales, T. G., Tang, H., Bollan, K. A., Johnson, S. J., King, D. P., McDonald, N. A., Cheng, A., and Connolly, C. N. (2005) Mol. Cell. Neurosci. 29 120–127 [DOI] [PubMed] [Google Scholar]
- 20.Roccamo, A. M., and Barrantes, F. J. (2007) J. Neurosci. Res. 85 285–293 [DOI] [PubMed] [Google Scholar]
- 21.McKernan, R. M., and Whiting, P. J. (1996) Trends Neurosci. 19 139–143 [DOI] [PubMed] [Google Scholar]
- 22.Beck, M., Brickley, K., Wilkinson, H. L., Sharma, S., Smith, M., Chazot, P. L., Pollard, S., and Stephenson, F. A. (2002) J. Biol. Chem. 277 30079–30090 [DOI] [PubMed] [Google Scholar]
- 23.Charych, E. I., Yu, W., Miralles, C. P., Serwanski, D. R., Li, X., Rubio, M., and De Blas, A. L. (2004) J. Neurochem. 90 173–189 [DOI] [PubMed] [Google Scholar]
- 24.Kittler, J. T., Delmas, P., Jovanovic, J. N., Brown, D. A., Smart, T. G., and Moss, S. J. (2000) J. Neurosci. 20 7972–7977 [DOI] [PMC free article] [PubMed] [Google Scholar]
- 25.Hinkle, D. J., Bianchi, M. T., and Macdonald, R. L. (2003) BioTechniques 35 472–474, 476 [PubMed] [Google Scholar]
- 26.Corpet, F. (1988) Nucleic Acids Res. 16 10881–10890 [DOI] [PMC free article] [PubMed] [Google Scholar]
- 27.Gorrie, G. H., Vallis, Y., Stephenson, A., Whitfield, J., Browning, B., Smart, T. G., and Moss, S. J. (1997) J. Neurosci. 17 6587–6596 [DOI] [PMC free article] [PubMed] [Google Scholar]
- 28.Taylor, P. M., Thomas, P., Gorrie, G. H., Connolly, C. N., Smart, T. G., and Moss, S. J. (1999) J. Neurosci. 19 6360–6371 [DOI] [PMC free article] [PubMed] [Google Scholar]
- 29.Taylor, P. M., Connolly, C. N., Kittler, J. T., Gorrie, G. H., Hosie, A., Smart, T. G., and Moss, S. J. (2000) J. Neurosci. 20 1297–1306 [DOI] [PMC free article] [PubMed] [Google Scholar]
- 30.Lagrange, A. H., Botzolakis, E. J., and Macdonald, R. L. (2007) J. Physiol. 578 655–676 [DOI] [PMC free article] [PubMed] [Google Scholar]
- 31.Kang, J. Q., Shen, W., and Macdonald, R. L. (2006) J. Neurosci. 26 2590–2597 [DOI] [PMC free article] [PubMed] [Google Scholar]
- 32.Helenius, A., and Aebi, M. (2004) Annu. Rev. Biochem. 73 1019–1049 [DOI] [PubMed] [Google Scholar]
- 33.Fujiwara, T., Oda, K., Yokota, S., Takatsuki, A., and Ikehara, Y. (1988) J. Biol. Chem. 263 18545–18552 [PubMed] [Google Scholar]
- 34.Connolly, C. N., Uren, J. M., Thomas, P., Gorrie, G. H., Gibson, A., Smart, T. G., and Moss, S. J. (1999) Mol. Cell. Neurosci. 13 259–271 [DOI] [PubMed] [Google Scholar]
- 35.Quiram, P. A., Ohno, K., Milone, M., Patterson, M. C., Pruitt, N. J., Brengman, J. M., Sine, S. M., and Engel, A. G. (1999) J. Clin. Investig. 104 1403–1410 [DOI] [PMC free article] [PubMed] [Google Scholar]
- 36.Pratt, M. B., Husain, S. S., Miller, K. W., and Cohen, J. B. (2000) J. Biol. Chem. 275 29441–29451 [DOI] [PubMed] [Google Scholar]
- 37.Leite, J. F., Amoscato, A. A., and Cascio, M. (2000) J. Biol. Chem. 275 13683–13689 [DOI] [PubMed] [Google Scholar]
- 38.Buller, A. L., Hastings, G. A., Kirkness, E. F., and Fraser, C. M. (1994) Mol. Pharmacol. 46 858–865 [PubMed] [Google Scholar]
- 39.Ou, W. J., Bergeron, J. J., Li, Y., Kang, C. Y., and Thomas, D. Y. (1995) J. Biol. Chem. 270 18051–18059 [DOI] [PubMed] [Google Scholar]
- 40.Gelman, M. S., Chang, W., Thomas, D. Y., Bergeron, J. J., and Prives, J. M. (1995) J. Biol. Chem. 270 15085–15092 [DOI] [PubMed] [Google Scholar]
- 41.Wanamaker, C. P., and Green, W. N. (2007) J. Biol. Chem. 282 31113–31123 [DOI] [PMC free article] [PubMed] [Google Scholar]
- 42.Maus, A. D., Pereira, E. F., Karachunski, P. I., Horton, R. M., Navaneetham, D., Macklin, K., Cortes, W. S., Albuquerque, E. X., and Conti-Fine, B. M. (1998) Mol. Pharmacol. 54 779–788 [DOI] [PubMed] [Google Scholar]
- 43.Skok, M. V., Kalashnik, E. N., Koval, L. N., Tsetlin, V. I., Utkin, Y. N., Changeux, J. P., and Grailhe, R. (2003) Mol. Pharmacol. 64 885–889 [DOI] [PubMed] [Google Scholar]
Associated Data
This section collects any data citations, data availability statements, or supplementary materials included in this article.


