Abstract
To facilitate optimal dosing regimen design, we previously developed a mathematical model using time-kill study data to predict the responses of Pseudomonas aeruginosa to various pharmacokinetic profiles of meropenem and levofloxacin. In this study, we extended the model to predict the activities of gentamicin and amikacin exposures against P. aeruginosa and Acinetobacter baumannii, respectively. The input data were from a time-kill study with 107 CFU/ml of bacteria at baseline. P. aeruginosa ATCC 27853 was exposed to gentamicin (0 to 16× MIC; MIC = 2 mg/liter), and A. baumannii ATCC BAA 747 was exposed to amikacin (0 to 32× MIC; MIC = 4 mg/liter) for 24 h. Using the estimates of the best-fit model parameters, bacterial responses to various fluctuating aminoglycoside exposures (half-life, 2.5 h) over 72 h were predicted via computer simulation. The computer simulations were subsequently validated using an in vitro hollow-fiber infection model with similar aminoglycoside exposures. A significant initial reduction in the bacterial burden was predicted for all gentamicin exposures examined. However, regrowth over time due to resistance emergence was predicted for regimens with a maximum concentration of the drug (Cmax)/MIC (dosing frequency) of 4 (every 8 h [q8h]), 12 (q24h), and 36 (q24h). Sustained suppression of bacterial populations was forecast with a Cmax/MIC of 30 (q12h). Similarly, regrowth and suppression of A. baumannii were predicted and experimentally verified with a three-dimensional response surface. The mathematical model was reasonable in predicting extended bacterial responses to various aminoglycoside exposures qualitatively, based on limited input data. Our approach appears promising as a decision support tool for dosing regimen selection for antimicrobial agents.
The widespread emergence of resistance to antimicrobial agents is a grave health care problem. New and effective agents must be developed rapidly to keep up with our battle against infections caused by resistant pathogens (11). Previous drug development efforts have primarily focused on identifying new metabolic targets and new antimicrobial agents to interfere with essential pathways. Relatively little attention has been paid to the impact of the dosing regimen on the emergence of resistance. There are considerable in vitro and in vivo experimental data suggesting that suboptimal dosing regimens contribute significantly to the development of resistance (4, 6, 13, 14, 16). If the most effective antimicrobial agent dosing regimen can be identified and used clinically, it is hoped that the emergence of antimicrobial resistance can be suppressed (or at least delayed). The utility of available antimicrobial agents and those under development may also be prolonged as a result.
When evaluating various dosing regimens of antimicrobial agents, the total daily dose, the dosing frequency, the dose given at each dosing interval, the length of (intravenous) administration, and the duration of therapy may have a significant influence on the killing activity and propensity to suppress resistance emergence, depending on the pharmacodynamic properties of the agents and clinically achievable concentrations (associated with acceptable toxicity). The numerous combinations of these variables involved in designing dosing regimens are prohibitive for comprehensive evaluation of all the different scenarios. For example, to evaluate six daily doses (e.g., 0.5, 1, 2, 4, 6, and 8 g), four dosing frequencies (e.g., every 6 hours [q6h], q8h, q12h, and q24h), five intravenous dosing administrations (e.g., intermittent infusion of 0.5, 1, 2, and 4 h and continuous infusion over 24 h), and three durations of treatment (e.g., 5, 10, and 14 days) would result in 360 (6 × 4 × 5 × 3) regimens to be investigated. In view of the labor-intensiveness of each investigation, a few dosing regimens are often empirically chosen to be studied, and the potential of new agents may not be thoroughly realized. The results could be dramatic. The development of daptomycin was unsuccessful in the 1970s due to an empirical dosing selection (8-h dosing interval). However, with an improved understanding of pharmacokinetics/pharmacodynamics as the foundation for a dosing strategy, the same agent was redeveloped and approved by the FDA for clinical use in 2003 by switching to a once-daily and weight-based dosing regimen. Therefore, a robust method to guide the selection of the most effective dosing regimen(s) would be valuable.
We previously developed a mathematical model to capture the dynamic relationship between a heterogeneous microbial population and drug concentrations (12, 15). The model was further refined to efficiently predict the microbial response to multiple antimicrobial agent dosing regimens (16). This modeling approach could be used as a decision support tool for dosing regimen design, and it may be used at different stages of drug development. One such application could be at the interface between late discovery and early clinical development (i.e., lead compound optimization). The model could provide a prediction of the new agent's potential clinical utility based on simple time-kill studies and allometrically scaled pharmacokinetic data. Another possibility is the comparison of several related drug candidates with conflicting in vitro potencies and pharmacokinetics (e.g., a more potent agent with a shorter elimination half-life versus a less potent agent with a longer elimination half-life). However, before such mathematical modeling can be used routinely to guide highly targeted investigation of dosing regimens in preclinical studies and clinical trials, its utility should be investigated in more than one drug-pathogen combination. Therefore, the objective of this study was to examine the flexibility of our mathematical-modeling approach using additional drug-pathogen combinations. Two wild-type gram-negative bacteria deemed to be “particularly problematic” and in need of new drug treatment were chosen for our investigations (11).
(This study was presented in part at the 16th European Conference of Clinical Microbiology and Infectious Diseases [ECCMID], Munich, Germany, 31 March to 3 April 2007, and the 17th ECCMID, Barcelona, Spain, 19 to 22 April 2008.)
MATERIALS AND METHODS
Antimicrobial agent.
Gentamicin powder was purchased from Sigma (St. Louis, MO), and amikacin powder was purchased from LKT Laboratories, Inc. (St. Paul, MN). A stock solution of each antimicrobial agent in sterile water was prepared, aliquoted, and stored at −70°C. Prior to each susceptibility test, an aliquot of the drug was thawed and diluted to the desired concentrations with cation-adjusted Mueller-Hinton broth (Ca-MHB) (BBL, Sparks, MD).
Microorganisms.
Pseudomonas aeruginosa ATCC 27853 and Acinetobacter baumannii ATCC BAA 747 (American Type Culture Collection, Rockville, MD) were used in the study. The bacteria were stored at −70°C in Protect (Key Scientific Products, Round Rock, TX) storage vials. Fresh isolates were subcultured twice on 5% blood agar plates (Hardy Diagnostics, Santa Maria, CA) for 24 h at 35°C prior to each experiment.
Susceptibility studies.
MICs/minimum bactericidal concentrations (MBCs) were determined in Ca-MHB using a modified broth macrodilution method as described by the CLSI (1). The final concentration of bacteria in each broth macrodilution tube was approximately 5 × 10⁵ CFU/ml of Ca-MHB. Serial twofold dilutions of the aminoglycosides were used. The MIC was defined as the lowest concentration of drug that resulted in no visible growth after 24 h of incubation at 35°C in ambient air. Samples (50 μl) from clear tubes and the cloudy tube with the highest drug concentration were plated on Mueller-Hinton agar (MHA) plates (Hardy Diagnostics, Santa Maria, CA). The MBC was defined as the lowest concentration of drug that resulted in a ≥99.9% kill of the initial inoculum. The drug carryover effect was assessed by visual inspection of the distribution of colonies on medium plates. The studies were conducted in duplicate and repeated at least once on a separate day.
Time-kill studies and mathematical modeling.
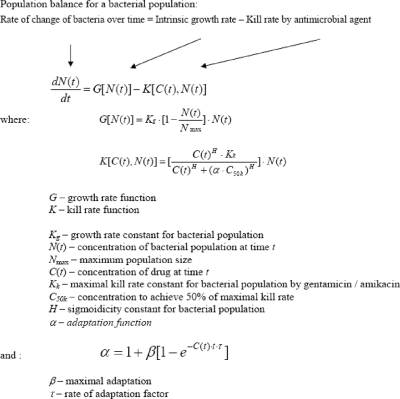
Time-kill study data of P. aeruginosa over 24 h have been reported previously (12); a clinically relevant concentration range of gentamicin (from 0 to 32 mg/liter) was used. Similarly, the experiment was repeated with A. baumannii using a clinically relevant concentration range of amikacin (from 0 to 128 mg/liter). The mathematical structure of the growth dynamics model is shown in Fig. 1. Briefly, the rate of change of bacteria over time was expressed as the difference between the intrinsic bacterial growth rate and the (sigmoidal) kill rate provided by the antimicrobial agent. A decline in the kill rate over time and regrowth were attributed to adaptation, which was explicitly modeled as an increase in the concentration necessary to achieve a 50% maximal kill rate (C50k), using a saturable function of antimicrobial agent selective pressure (both the aminoglycoside concentration [C] and time). The time-kill study data were used as inputs to derive the best-fit model parameter estimates, as previously described (12, 15). The modeling estimation process involved two steps. For each bacterium, the intrinsic bacterial growth rate (Kg) and maximal bacterial population size (to account for contact inhibition) were first determined from placebo (control) experiments, using the ADAPT II program (2). Using these parameter estimates, the parameter values in the kill function were subsequently determined using data from all active treatment experiments simultaneously. The baseline inoculum (107 CFU/ml) was deemed to be dense enough to constitute a heterogeneous bacterial population.
FIG. 1.
Bacterial growth dynamics model and various model parameters (adapted with permission from reference 15).
Computer model prediction of microbial response.
Using the best-fit model parameter values derived, the microbial responses to various clinically relevant aminoglycoside exposures (fluctuating concentrations over time) over 72 h were predicted. In order to examine the robustness of our mathematical-modeling approach, two different methods were used to predict the likelihood of resistance emergence. For gentamicin, three parallel differential equations were used, each characterizing the rate of change of the drug concentration, microbial susceptibility, and microbial burden of the surviving population over time, as described previously (16). All simulations were performed with the ADAPT II program (2). On the other hand, the qualitative microbial responses (with respect to resistance suppression or development) to various amikacin exposures were predicted using a three-dimensional response surface, as described previously (9).
Experimental validation.
Regardless of the prediction method used, the computer simulations were compared to experimental data from an in vitro hollow-fiber infection model with similar antimicrobial agent exposures. The experimental setup has been described elsewhere (16). A human-like elimination half-life (approximately 2.5 h) for both gentamicin and amikacin was simulated in the infection models. Serial samples were obtained from the infection models over time to ascertain the simulated pharmacokinetic exposures. The aminoglycoside concentrations in these samples were assayed using validated methods, as detailed below. A one-compartment linear model was fitted to the observed time-concentration profiles using the ADAPT II program (2).
In addition, serial samples were obtained at baseline, 4, and 8 h and daily (predose) in duplicate from each hollow-fiber system for quantitative culture to define the effects of various drug exposures on the bacterial population. Prior to culturing the bacteria quantitatively, the bacterial samples were centrifuged at 10,000 × g for 15 min and reconstituted with sterile normal saline in order to minimize the drug carryover effect. Total bacterial populations were quantified by spiral plating (Spiral Biotech, Bethesda, MD) 10× serial dilutions of the samples (50 μl) onto drug-free MHA plates. Subpopulations with reduced susceptibility (resistant) were quantified by culturing them on cation-adjusted MHA plates supplemented with the exposed agent (gentamicin or amikacin) at a concentration of 3× MIC. Since susceptibility testing is performed in twofold dilutions and one tube (2× concentration) difference is commonly accepted as reasonable interday variation, quantitative cultures on drug-supplemented medium plates (at 3× MIC) would allow reliable detection of bacterial subpopulations with reduced susceptibility. The medium plates were incubated at 35°C for up to 24 (total population) and 72 (subpopulations with reduced susceptibility) h, and the bacterial density of each sample was enumerated visually. The theoretical lower limit of detection was 400 CFU/ml. Determination of the susceptibilities of the resistant isolates (recovered from the drug-supplemented medium plates at the end of the experiments) to the exposed agent was repeated to confirm the emergence of resistance.
Pharmacokinetic profiles investigated.
All dosing regimens investigated were guided by computer model predictions. In view of the pharmacodynamic property of gentamicin, preliminary simulations revealed that suppression of resistance would be unlikely using any clinically achievable exposures. Therefore, as a proof of concept, several supraphysiologic dosing regimens were investigated, in addition to two clinically relevant dosing regimens (using conventional nomenclature, a Cmax/MIC of 4 q8h and a Cmax/MIC of 12 q24h). On the other hand, four clinically achievable dosing regimens of amikacin were examined, corresponding to a Cmax /MIC of 5 q12h, a Cmax/MIC of 6 q8h, a Cmax/MIC of 13 q12h, and a Cmax /MIC of 20 q24h.
Bioassays.
Gentamicin concentrations were determined by a microbioassay utilizing Klebsiella pneumoniae ATCC 13883 as the reference organism. The bacteria were incorporated into 30 ml of molten cation-adjusted MHA (at 50°C) to achieve a final concentration of approximately 1 × 10⁵ CFU/ml. The agar was allowed to solidify in 150-mm medium plates. A size 3 cork bore was used to create nine wells in the agar per plate. Standards and samples were tested in duplicate with 40 μl of the appropriate solution in each well. The gentamicin standard solutions ranged from 1 to 32 mg/liter in Ca-MHB. The medium plates were incubated at 35°C for 24 h, and the zones of inhibition were measured. The assay was linear (correlation coefficient, ≥0.99), using the zone diameter versus the log of the standard drug concentration. The intraday and interday coefficients of variation for all standards were <4% and <6%, respectively. Similarly, amikacin concentrations were determined by a microbioassay utilizing Escherichia coli ATCC 25922 as the reference organism. The assay was linear (correlation coefficient, ≥0.98), using the zone diameter versus the log of the amikacin standard concentrations from 4 to 256 mg/liter. The intraday and interday coefficients of variation for all standards were <7% and <12%, respectively.
RESULTS
Susceptibility studies.
The MIC/MBC of gentamicin for the P. aeruginosa isolate were found to be 2 and 2 mg/liter, respectively. On the other hand, the MIC/MBC of amikacin for the A. baumannii isolate were found to be 4 and 8 mg/liter, respectively.
Time-kill studies.
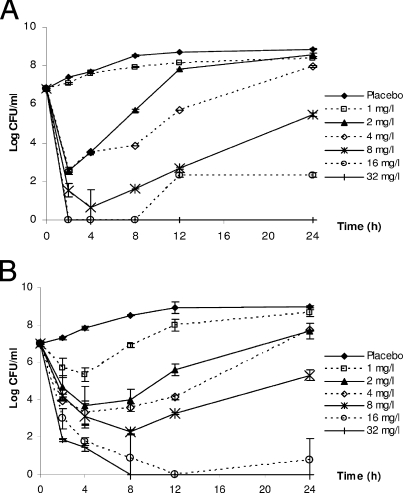
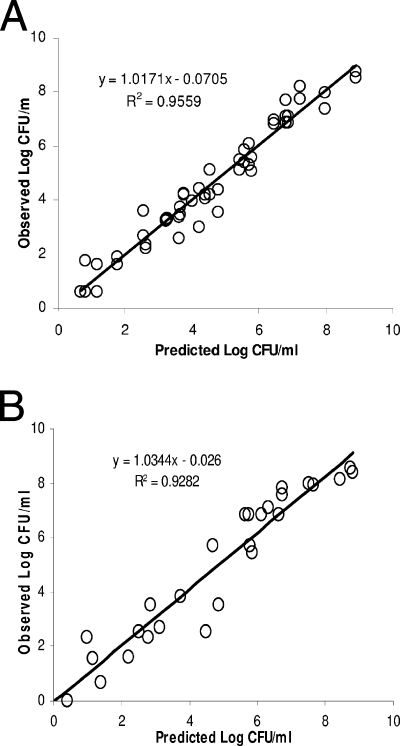
Data from the time-kill studies and model fits to the data are shown in Fig. 2 and 3, respectively. The estimates of the best-fit model parameters are shown in Table 1. Taken as a whole, the observations in bacterial burdens over time (under constant antimicrobial agent concentrations) were reasonably described by the model.
FIG. 2.
Time-kill studies of gentamicin against P. aeruginosa ATCC 27853 (A) and of amikacin against A. baumannii ATCC BAA 747 (B). The data are shown as means ± standard deviations. Complete bacterial eradication was observed with amikacin concentrations of >16 mg/liter after 2 h of drug exposure.
FIG. 3.
Model fits to the experimental data in time kill studies. Shown are gentamicin against P. aeruginosa ATCC 27853 (A) and amikacin against A. baumannii ATCC BAA 747 (B).
TABLE 1.
Susceptibilities of isolates and final estimates of best-fit model parameters in time kill studiesa
| Strain | MIC/MBCb | Kg (h−1) | Nmax (108 CFU/ml) | Kk (h−1) | C50k (mg/liter) | H | β | τ (liter/mg·h) |
|---|---|---|---|---|---|---|---|---|
| P. aeruginosa 27853 | 2/2 | 0.48 | 9.80 | 4.68 | 0.72 | 3.73 | 42.54 | 0.0135 |
| A. baumannii BAA 747 | 4/8 | 0.55 | 6.62 | 27.81 | 1.56 | 3.06 | 50.09 | 0.0265 |
Kg, growth rate constant for the bacterial population; Nmax, maximum population size; Kk, maximal kill rate constant for the bacterial population; C50k, concentration to achieve 50% of the maximal kill rate for the bacterial population; H, sigmoidicity constant for the bacterial population; β, maximal adaptation; τ, rate of adaptation factor.
P. aeruginosa susceptibility to gentamicin; A. baumannii susceptibility to amikacin (in mg/l).
Computer simulation and experimental validation.
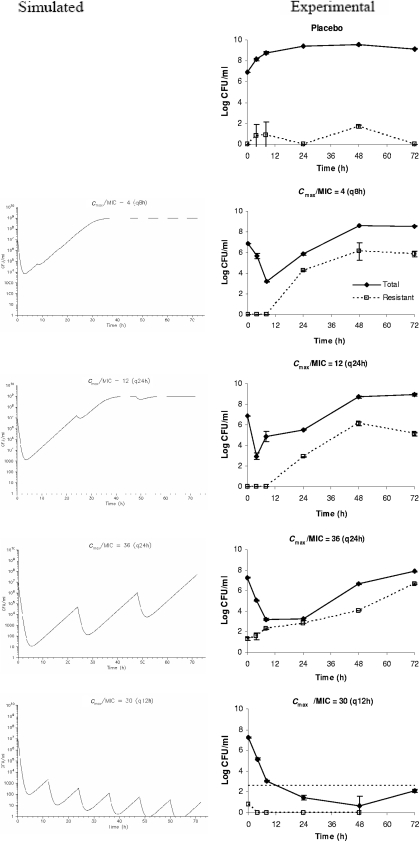
The observed pharmacokinetic simulations in the infection models were satisfactory (data not shown). Overall, the computer predictions correlated well qualitatively with experimental data for both antimicrobial agents. The comparison between computer-simulated and experimental bacterial responses to gentamicin are shown in Fig. 4. A significant initial reduction in the microbial burden was predicted for all gentamicin dosing regimens examined. However, regrowth over time was predicted for suboptimal regimens (Cmax/MIC of 4 q8h, Cmax/MIC of 12 q24h, and Cmax/MIC of 36 q24h) with repeated dosing due to selective amplification of a resistant subpopulation(s). On the other hand, sustained suppression of resistance emergence was achieved with an optimal dosing regimen (Cmax/MIC of 30 q12h).
FIG. 4.
Comparison of computer-simulated and experimental bacterial (P. aeruginosa) responses to various gentamicin exposures. The dosing frequencies are in parentheses. The data are shown as means ± standard deviations. The horizontal dotted line [in Cmax/MIC = 30 (q12h)] depicts the reliable lower limit of detection.
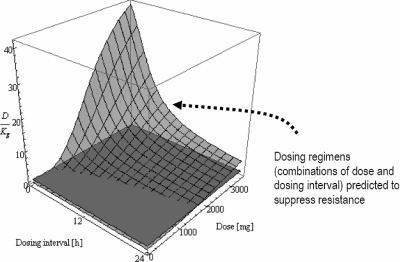
For amikacin, a three-dimensional surface analysis was used to predict the likelihood of resistance suppression associated with various dosing regimens, as shown in Fig. 5. Based on the analysis, two suboptimal regimens (Cmax/MIC of 5 q12h and Cmax/MIC of 6 q8h; predicted not to prevent resistance development over time) and two optimal dosing regimens (Cmax/MIC of 20 q24h and Cmax/MIC of 13 q12h; predicted to suppress resistance development) were selected for prospective validation. As shown in Fig. 6 and the supplemental material labeled “Appendix 3,” both the negative and positive predictive abilities of the mathematical model were verified experimentally.
FIG. 5.
Likelihood of emergence of bacterial (A. baumannii) resistance to various dosing regimens of amikacin as predicted by a response surface analysis. Two intersecting planes are shown: a translucent mesh surface (representing different dosing regimens) and an opaque surface (where D/Kg = 1). The three-dimensional mesh surface is made up of a collection of data points; each datum point is characterized by a value on the x, y, and z axes corresponding to the dose (x), dosing interval (y), and D/Kg (z). The average kill rate of various dosing regimens against the most resistant bacterial subpopulation was quantified by D, an index of dosing intensity (D ≤ Kk [the maximal kill rate], and D is dependent on the Cmax and dosing frequency [an intrinsic property of a dosing regimen]). For a dosing regimen to suppress resistance amplification, it is imperative that the average kill rate (D) be more than the intrinsic growth rate (Kg) of the bacterial population. Both D and Kg are expressed in h−1, so D/Kg is a dimensionless ratio. To identify promising dosing regimens (combinations of dose and dosing interval) to prevent resistance development, the corresponding values of D/Kg should be >1 (the region where the translucent mesh surface is above the opaque plane), as indicated by the arrow (e.g., 2,000 mg [Cmax/MIC = 20] given every 24 h or 1,500 mg [Cmax/MIC = 15] every 12 h). Note: Cmax/MIC = dose/(volume of distribution × MIC) = dose/(70 × 0.35 × 4).
FIG. 6.
Validation of microbial responses to various amikacin dosing regimens. The dosing frequencies are in parentheses. The data are shown as means ± standard deviations. The horizontal dotted lines depict the reliable lower limits of detection.
Resistance confirmation.
Resistant isolates were recovered from drug-supplemented plates at the end of the experiments (suboptimal dosing regimens). Both gentamicin and amikacin resistance were confirmed with repeated susceptibility testing immediately after the experiments. However, gentamicin resistance was not stable; the elevated gentamicn MIC observed could not be demonstrated after serial passage on drug-free plates and storage at −70°C. Our experience appeared to be consistent with previous in vivo findings (3). On the other hand, amikacin resistance (16- to 32-fold increase) was phenotypically stable in four randomly selected isolates from amikacin-supplemented plates. Cross-resistance to gentamicin (16- to 32-fold increase), tobramycin (32-fold increase), and apramycin (8- to 16-fold increase) was observed, but not to meropenem, cefepime, and levofloxacin. These data suggested that nonspecific outer membrane changes and/or overexpression of an efflux pump (but not AdeABC) was likely to be the mechanism of amikacin resistance (5).
DISCUSSION
The need for new antimicrobial agents is greater than ever because of the emergence of multidrug resistance. Multidrug resistance in gram-negative bacteria has been associated with unfavorable clinical outcomes (7, 8); P. aeruginosa and A. baumannii are two of the bacteria often implicated and are thus especially worrisome. However, new antimicrobial agent development is on the decline (10) due (partially at least) to the lower cost-benefit ratio of antimicrobial discovery/development programs. Dosing regimen selection has been shown to have a significant impact on the emergence of resistance; suboptimal dosing may facilitate the emergence of resistance by imposing a selective pressure on the bacteria (4, 6, 13, 14, 16). Despite that, information from conventional studies has not been used optimally to guide the choice of dosing regimens. The limitations of using surrogate indices (e.g., area under the concentration-time curve/MIC and %T>MIC) in pharmacodynamic modeling have been reviewed previously (16) and further exemplified by data in this study (Fig. 4 and 6). While Cmax/MIC is commonly believed to be the most important for aminoglycosides, a dosing regimen achieving a lower Cmax/MIC ratio but provided for a larger AUC/MIC (due to twice daily dosing) prevented the selection of resistance.
Rational dosing regimen design involves multiple variables. Since comprehensive evaluation of all combinations is prohibitive in view of the labor-intensiveness of each investigation, the initial choice of the dosing regimens to be tested preclinically is often empirical (mostly trial and error). Given that studies with these infection models are costly and time-consuming to perform, poorly guided exploration studies to examine the potentials of various dosing regimens (e.g., dose escalation or dose fractionation studies) may not be very efficient and cost-effective. Of interest, conventional pharmacodynamic indices predicting outcomes may also be subjected to the range of drug concentrations examined (see the supplemental material labeled “Appendix 2”).
In contrast, our proposed modeling approach does not require the use of surrogate pharmacodynamic indices to make useful predictions of microbial response to antimicrobial exposures (the Cmax/MIC was empirically chosen to represent different dosing regimens in Fig. 4 and 6 due to convention; other indices could also be used). As such, it offers a method to improve dosing regimen selection, which could suppress the development of resistance during therapy. With this method, standard time-kill study data over 24 h are used as model inputs. The utility of a large number of dosing regimens can be effectively screened in a comprehensive fashion, but only promising ones would be investigated in preclinical studies and clinical trials. In addition, because the dosing regimens investigated are designed to prevent resistance emergence, the clinical-utility life span of new agents would also likely be prolonged.
In all cases, bacterial regrowth after an initial decline in the bacterial burden was attributed to selective amplification of a resistant subpopulation(s). We were able to confirm the presence of phenotypic resistance by repeated susceptibility testing. However, we did not ascertain the specific mechanism of aminoglycoside resistance in this study, as it was not the primary focus of the study. Since the acquisition of additional genetic material for A. baumannii was highly unlikely in our in vitro infection model, initial screening attempts did not suggest a common mechanism of resistance. Nonetheless, we believe that the experimental data shown are adequate to demonstrate the utility of our modeling approach.
As with previous studies, the proposed modeling approach was expected to be a general evaluative tool. The utility of the model was illustrated in this study by experimental data for P. aeruginosa and A. baumannii. However, the proposed model-based approach is not confined to a specific antimicrobial agent-pathogen combination. An attractive feature of our model is that it does not rely on detailed knowledge of the mechanism of resistance. The different pharmacologic and microbiologic characteristics of various drug-pathogen combinations can be represented by different model parameter values (e.g., the growth rate constant of the pathogen and the dispersion of the maximal kill rate constant of the antimicrobial agent under investigation) derived from actual (short-term) experiments. While various antimicrobial agents may have different mechanisms of action or killing profiles (e.g., bactericidal or bacteriostatic), and various pathogens may have different biological characteristics, the same mathematical model structure can still be used (e.g., different extents of susceptibility reduction due to different mechanisms of resistance can be reflected in the value of α, and the rate of resistance selection can be reflected in the value of τ). As the MIC increases, the C50k for the surviving population also increases in a nonlinear fashion until “maximal adaptation” has been achieved. In the past, the same (a two-subpopulation) mathematical-model structure has been used to examine the effects of quinolone exposures on P. aeruginosa (14), Mycobacterium tuberculosis (4), and Staphylococcus aureus (16). These studies suggest that an appropriate mathematical-model structure capturing essential features can be developed, which would be flexible enough to characterize the dynamic interaction of more than one antimicrobial agent-pathogen combination. Consequently, the proposed model would likely be extrapolated to other antimicrobial agents (e.g., antibacterials, antifungals, and antivirals) with different mechanisms of action, as well as to other pathogens (e.g., human immunodeficiency virus, tuberculosis, anthrax, and avian influenza) with different biological characteristics.
In conclusion, using limited data from time-kill studies over 24 h, our mathematical model was reasonable in qualitatively predicting extended microbial responses to various concentration-time profiles of both gentamicin and amikacin over 3 days. This approach appears promising as a decision support tool to guide highly targeted investigation of dosing regimens in preclinical investigations and clinical studies. The in vivo relevance and sensitivity of the mathematical-model predictions are currently under investigation.
Supplementary Material
Acknowledgments
This study was supported in part by unrestricted grants from AstraZeneca, the Johns Hopkins Center for Alternatives to Animal Testing, and the National Science Foundation (CBET-0730454).
We thank George H. Miller for advice on the phenotypic screening and the mechanism of aminoglycoside resistance.
Footnotes
Published ahead of print on 25 August 2008.
Supplemental material for this article may be found at http://aac.asm.org/.
REFERENCES
- 1.Clinical and Laboratory Standards Institute. 2007. Performance standards for antimicrobial testing: 17th informational supplement. CLSI document M100-S17. CLSI, Wayne, PA.
- 2.D'Argenio, D. Z., and A. Schumitzky. 1997. ADAPT II user's guide: pharmacokinetic/pharmacodynamic systems analysis software. Biomedical Simulations Resource, University of Southern California, Los Angeles, CA.
- 3.Gerber, A. U., A. P. Vastola, J. Brandel, and W. A. Craig. 1982. Selection of aminoglycoside-resistant variants of Pseudomonas aeruginosa in an in vivo model. J. Infect. Dis. 146:691-697. [DOI] [PubMed] [Google Scholar]
- 4.Gumbo, T., A. Louie, M. R. Deziel, L. M. Parsons, M. Salfinger, and G. L. Drusano. 2004. Selection of a moxifloxacin dose that suppresses drug resistance in Mycobacterium tuberculosis, by use of an in vitro pharmacodynamic infection model and mathematical modeling. J. Infect. Dis. 190:1642-1651. [DOI] [PubMed] [Google Scholar]
- 5.Higgins, P. G., H. Wisplinghoff, D. Stefanik, and H. Seifert. 2004. Selection of topoisomerase mutations and overexpression of adeB mRNA transcripts during an outbreak of Acinetobacter baumannii. J. Antimicrob. Chemother. 54:821-823. [DOI] [PubMed] [Google Scholar]
- 6.Jumbe, N., A. Louie, R. Leary, W. Liu, M. R. Deziel, V. H. Tam, R. Bachhawat, C. Freeman, J. B. Kahn, K. Bush, M. N. Dudley, M. H. Miller, and G. L. Drusano. 2003. Application of a mathematical model to prevent in vivo amplification of antibiotic-resistant bacterial populations during therapy. J. Clin. Investig. 112:275-285. [DOI] [PMC free article] [PubMed] [Google Scholar]
- 7.Kuo, L. C., C. C. Lai, C. H. Liao, C. K. Hsu, Y. L. Chang, C. Y. Chang, and P. R. Hsueh. 2007. Multidrug-resistant Acinetobacter baumannii bacteraemia: clinical features, antimicrobial therapy and outcome. Clin. Microbiol. Infect. 13:196-198. [DOI] [PubMed] [Google Scholar]
- 8.Kwa, A. L., J. G. Low, E. Lee, A. Kurup, H. L. Chee, and V. H. Tam. 2007. The impact of multidrug resistance on the outcomes of critically ill patients with Gram-negative bacterial pneumonia. Diagn. Microbiol. Infect. Dis. 58:99-104. [DOI] [PubMed] [Google Scholar]
- 9.Nikolaou, M., A. N. Schilling, G. Vo, K. T. Chang, and V. H. Tam. 2007. Modeling of microbial population responses to time-periodic concentrations of antimicrobial agents. Ann. Biomed Eng. 35:1458-1470. [DOI] [PubMed] [Google Scholar]
- 10.Spellberg, B., J. H. Powers, E. P. Brass, L. G. Miller, and J. E. Edwards, Jr. 2004. Trends in antimicrobial drug development: implications for the future. Clin. Infect. Dis. 38:1279-1286. [DOI] [PubMed] [Google Scholar]
- 11.Talbot, G. H., J. Bradley, J. E. Edwards, Jr., D. Gilbert, M. Scheld, and J. G. Bartlett. 2006. Bad bugs need drugs: an update on the development pipeline from the Antimicrobial Availability Task Force of the Infectious Diseases Society of America. Clin. Infect. Dis. 42:657-668. [DOI] [PubMed] [Google Scholar]
- 12.Tam, V. H., S. Kabbara, G. Vo, A. N. Schilling, and E. A. Coyle. 2006. Comparative pharmacodynamics of gentamicin against Staphylococcus aureus and Pseudomonas aeruginosa. Antimicrob. Agents Chemother. 50:2626-2631. [DOI] [PMC free article] [PubMed] [Google Scholar]
- 13.Tam, V. H., A. Louie, M. R. Deziel, W. Liu, and G. L. Drusano. 2007. The relationship between quinolone exposures and resistance amplification is characterized by an inverted U: a new paradigm for optimizing pharmacodynamics to counterselect resistance. Antimicrob. Agents Chemother. 51:744-747. [DOI] [PMC free article] [PubMed] [Google Scholar]
- 14.Tam, V. H., A. Louie, M. R. Deziel, W. Liu, R. Leary, and G. L. Drusano. 2005. Bacterial-population responses to drug-selective pressure: examination of garenoxacin's effect on Pseudomonas aeruginosa. J. Infect. Dis. 192:420-428. [DOI] [PubMed] [Google Scholar]
- 15.Tam, V. H., A. N. Schilling, and M. Nikolaou. 2005. Modelling time-kill studies to discern the pharmacodynamics of meropenem. J. Antimicrob. Chemother. 55:699-706. [DOI] [PubMed] [Google Scholar]
- 16.Tam, V. H., A. N. Schilling, K. Poole, and M. Nikolaou. 2007. Mathematical modelling response of Pseudomonas aeruginosa to meropenem. J. Antimicrob. Chemother. 60:1302-1309. [DOI] [PubMed] [Google Scholar]
Associated Data
This section collects any data citations, data availability statements, or supplementary materials included in this article.


