Abstract
Purpose
To evaluate the ability of a commercially available single pass Shack-Hartmann aberrometer to evaluate contact lens aberrations.
Methods
Accuracy of second-order aberration measurements was verified by measuring a series of precision calibration lenses, spectacle lenses, and contact lenses. Power measurements were compared to those expected by an independent measurement or those provided by the lens manufacturer. Accuracy of third-order aberrations was verified by systematically decentering a lens with known amounts of spherical aberration and comparing the magnitude of induced coma to that of optical theory. Fourth-order aberration accuracy was verified by comparing measured longitudinal spherical aberration values to those expected by ray tracing based on the lens design. Accuracy of lower- and higher-order aberrations was verified for measurements of lenses taken in air and within a saline-filled wet cell. Repeatability was also assessed by comparing repeated measurements of the wet cell and lens in a wet cell, before and after manipulation of that cell.
Results
In all cases, measured values closely matched the expected values, generally exhibiting errors of <1%.
Conclusions
The instrument demonstrates good accuracy and repeatability in measuring second-, third-, and fourth-order aberrations of contact lenses and provides the industry with an instrument for evaluating the ex vivo optical characteristics of contact lenses.
Keywords: contact lens, aberration, validity, repeatability, accuracy, wavefront
Although contact lenses are a widely used optical aid, it is quite difficult to accurately and precisely measure their optical properties. These difficulties are most acute for soft lenses that are thin (e.g., center thicknesses as low as 0.07 mm), structurally unstable when off the eye, and highly sensitive to the hydration characteristics of their surrounding environment. For example, with hydrogel (soft) contact lenses, the above problems generally require the clinician to assess optical characteristics by performing an over-refraction of the contact lens on the patient's eye. This over-refraction provides approximate information regarding the sphere and cylinder characteristics of the lens on the eye, which is not a measure of the lens properties per se but rather a reflection of the lens properties and lens interaction effects with the eye.1 Also, such an approach to lens evaluation provides no information about any possible optical imperfections of the contact lens. In fact, the practitioner generally arrives at the diagnosis of an optically defective lens indirectly by observing inferior visual acuity that cannot be remedied by a sphero-cylindrical over-refraction.
Sphere and cylinder power of rigid gas permeable (RGP) and soft contact lenses can be verified using a lensmeter, but this method cannot measure spherical aberration or other higher-order aberrations (HOAs). Furthermore, soft hydrogel contact lenses can desiccate in air thereby deforming the lens surface, and thus producing measurements that will be unrepresentative of the true lens properties on the eye.2 Blotting techniques have been proposed to maintain minimum levels of hydration over very short time periods of a few seconds, but this is still likely to be inadequate for today's thin, high water content lenses.3 The hydration problems associated with “dry” power measurements of soft contact lenses may be resolved by submerging the contact lens in a wet cell filled with saline.3 The buoyancy of the lens in water reduces the distortion forces on the lens, ensures adequate hydration, and provides a better optical surface. However, power measurements in saline are not the same as those made in air or on the eye, and thus they require conversion.
With the development of precision lathes capable of manufacturing non-symmetric and aspheric lenses designed to either induce (e.g., multifocal) or correct aberrations, assessing lens optical characteristics is all but impossible for the clinician. However, several methods have been developed in the laboratory to accurately evaluate sphere and spherical aberration of the contact lens.2,4 Recently, Lopez-Gil et al.5 used an interferometric method to measure contact lens lower and HOAs in a wet cell, but this approach has serious range limitations and may require an extensive series of calibrated reference surfaces to function. Jeong et al.6 developed a lab Shack-Hartmann system to measure soft lenses in a wet cell. Around this time, AMO-Wavefront Sciences developed a commercial Shack-Hartmann system to measure monochromatic aberrations of contact lenses in a wet cell. This instrument has been subsequently modified to also measure dry lenses. The purpose of the present study is to evaluate the ability of this new commercial technology (ClearWave, by AMO-Wavefront Sciences, Albuquerque, NM) to measure the optics of contact lenses in the wet and dry states.
METHODS
ClearWave Instrument Design
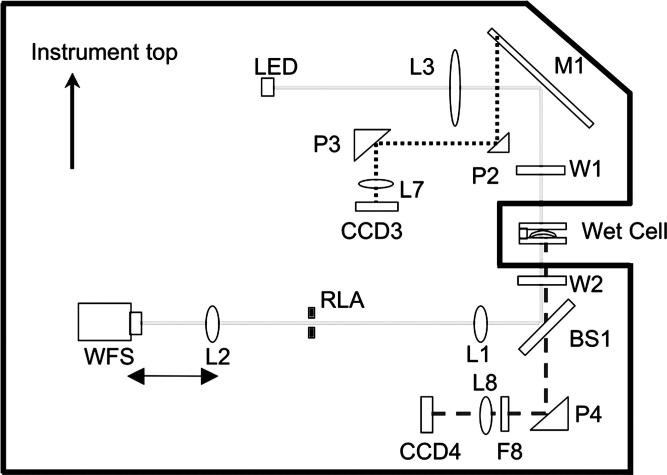
Unlike ocular aberrometers, the ClearWave is a single pass system (Fig. 1) in which a 540 nm light source (solid gray lines in Fig. 1) is collimated by L3 to provide a plane wave incident at the contact lens. After passing through the contact lens, the wavefront is imaged via a telescope onto a Shack-Hartmann wavefront sensor (WFS). The WFS contains a 101 × 101 lenslet array with a 10.4 × 10.4 mm2 field of view, providing a sampling resolution of 0.104 mm. The range of this system is expanded by allowing the coupled movement of L2, range-limiting aperture, and WFS to achieve an approximately plane wave at the WFS.
FIGURE 1.
Schematic of ClearWave instrument. The solid outer line represents the instrument casing. The solid line (internal) is the lens measurement path. The dotted line represents the prism camera measurement path. The dashed line represents the alignment camera path of the instrument. (Adapted from figure courtesy of AMO-Wavefront Sciences.)
The instrument includes a wide field of view camera dedicated to alignment of the lens (path indicated by dashed line in Fig. 1). The axis and orientation of this camera are aligned with the WFS, allowing the alignment of fiducially marked lenses (e.g., toric or custom). Some lenses may possess amounts of prism that could deviate the wavefront exiting the lens and prevent measurement. To compensate for prism, the instrument has user-adjustable tip and tilt of mirror M1. The collimated beam that reflects off M1 is larger than necessary for the purpose of measuring the contact lenses, and permits prism P2 to intersect a small peripheral section of this beam, and reflects it to focus on CCD3 to allow the measurement of this tip and tilt.
The contact lens is placed in a cell between windows W1 and W2. There are several types of wet cells that could be used. In the current study, a stainless steel circular wet cell with an approximately 3.81 cm inner diameter was used. The depth of the cell was approximately 3.175 cm. A piece of high quality flat 5 mm thick fused silica (n = 1.46034) makes up the lower part of the cell. The contact lens rests concave side down on this piece of flat glass. A removable piece of 5 mm thick high quality silica is placed on top of the filled wet cell so it is in contact with the solution. In the current case, the wet cell is assumed to be aberration-free, but a reference measurement can be made of the saline-filled wet cell, and then the aberration of the lens can be calculated as the difference of this reference measurement and that of the saline-filled wet cell containing a contact lens. As the vergence of the wavefront exiting the wet cell will be slightly altered by the thickness of the fluid under the lens (approximately 2.5 mm) and the thickness of the lower layer of silica (5 mm), a computational correction is applied to correct for these effects.
Based on previous experience with an older prototype version of the instrument, it was found that, despite the buoyancy provided by the saline solution, hydrogel lenses could deform when sitting in the saline-filled wet cell. This is especially true of lenses with thin center or edge thicknesses. To counteract this situation, the instrument manufacturer devised a support that has a central opening large enough for an unobstructed measurement with a mid-peripheral support that is curved to approximately match the lens base curvature. Additionally, there are peripheral cut-outs within this support to allow lens fiducial mark alignment.
Conversion of Measurements Acquired in Solution to In-Air Equivalence
The change in the eye's optical path length produced by a soft contact lens when on the eye is generally believed to be equal to the optical path length of the contact lens in air.7 In both cases, the contact lens replaces air in the optical path with the contact lens material. Consequently, lens measurements taken in air require no special conversion to the on-eye refractive impact of the lens. However, measurements taken in the saline-filled wet cell require conversion to in-air equivalent power, and thus refractive impact. The paraxial power of the contact lens, PCL, is determined by P1 the anterior surface power, P2 the posterior surface power, d the lens thickness, and n2 the index of refraction of the contact lens (Eq. 1).
| (1) |
where P1 = (n2 – n1)/r1 and P2 = (n1 – n2)/r2 and n1 is the refractive index of the surrounding medium. From knowledge of the refractive indices and contact lens back surface radius, the back surface power P2 can be calculated. Knowing the back surface power, lens thickness, and the measured total power in the wet cell, the power of the front surface can be calculated. By changing the n1 from that of saline to that of air, the power of each surface in air can be calculated, as can the total power.8,9 (For additional details on the derivation of the exact wet to in-air conversion equation, see Appendix A, available online at www.optvissci.com.)
This conversion process, however, requires accurate information on lens base curve radius, lens center thickness, lens index of refraction, and wet cell solution index of refraction. Fortunately, lens base curve radius is fairly tightly controlled by the manufacturer,8 and lens thickness (in air) can be measured directly using a thickness gauge. This conversion, however, is quite sensitive to small changes in the indices of refraction of the lens and solution. For example, if we measured the lens power in solution to be −1.50 D in the wet cell and assume a lens thickness of 0.1 mm, lens base curve radius of 8.7 mm, and solution index of refraction of 1.333, and vary the lens index of refraction from 1.405 to 1.410, the resultant Pair changes by about 0.50 D (−8.33 vs. −7.88 D). This sensitivity becomes a drawback to this measurement method, as lens and solution indices of refraction are often not well documented (e.g., typically only specified to two decimal places and only reported at one wavelength, and sometimes wavelength is not indicated). Additionally, refractive index will vary with temperature.10,11 ANSI ISO 9342 specifies two wavelengths at which index values can be reported for contact lenses; 546 nm and 587 nm.12 However, many of the instruments commercially available to measure refractive index, such as the CLR 12 to 70 (Index Instruments, Cambridge, UK) and Arias 500/600/700 (Reichert, Depew, NY), measure index at 589 nm. The ClearWave measurements are acquired with a single monochromatic wavelength of 540 nm. Therefore, to achieve the highest degree of accuracy, refractive index of the lens material should be measured in the environment at which the measurements are to be taken, and at the same wavelength at which the measurements are to be taken.
Fortunately, however, refractive indices of lens materials do not typically vary much, if at all, within the 540 to 589 nm wavelength range (e.g., by <0.6%13). In the current study, the manufacturer-reported lens index values were used.
It is also important to emphasize that the measurements taken by the instrument are monochromatic. Thus, knowledge of the lens performance at one wavelength at the center of the visual range will only approximate the polychromatic behavior of the lens on the eye.
HOA conversion used by the instrument to convert wet cell to in-air aberrations is
| (2) |
where Z is any given Zernike term or series of terms.6,9 This approximate equation is appropriate given the low levels of HOAs typically encountered in contact lenses.
Aberration and power measurements reported in this article are the average of ten successive measurements, from a 6 mm analysis diameter. Eighth-order Optical Society of America (OSA) Zernike polynomials were fit to each of these measurements. The accuracy of our validation study, however, hinges on the accuracy of the benchmarks we employ. For example, manual lensmeter readings are accurate to within ±0.125 D, and soft contact lens allowable manufacturing tolerance is ±0.25 D. Therefore, we include tests of precision calibrated lenses, as well as clinically relevant/common lenses.
Experiment 1: Evaluate Accuracy of Lower-Order Aberrations of Lenses in Air
Spherical power measurements were taken on interferometrically calibrated plano-convex and plano-concave calibration lenses (−10.00 to +5.50 D) (Thorlabs, Newton, NJ) over a 6 mm analysis diameter. Sphere and cylinder measurements were made on standard spectacle trial lenses of sphere powers (−18.00 to +9.00 D) and cylinder powers (0 to −5.00 D). The power of these lenses was independently measured using a standard validated manual Reichert lensmeter (to the nearest 0.125 D). Sphere measurements were then acquired on a series of RGP lenses (−6.50 to +6.00 D) over a 6 mm analysis diameter. The lenses were of Boston ES® (Bausch and Lomb, Rochester, NY) material, 7.5 mm base curve radius, and 9.5 mm overall diameter. Powers of these lenses were independently assessed using a standard validated manual Reichert lensmeter (to the nearest 0.125 D). Center thickness measurements of each lens were also taken using a validated precision thickness gauge (to the nearest micron). Although not readily apparent during the measurement, it is possible that this mechanical thickness gauge could have caused some minor material compression, but the magnitude and optical impact of this is thought to be small.
Experiment 2: Evaluate the Accuracy of Lower-Order Aberrations in the Wet Cell
Measurements of the same RGP lens series used in experiment 1 were also taken with the lens sitting in the circular wet cell filled with saline solution. A power series (−10.00 to +6.00 D) of Focus Dailies (CIBA Vision, Duluth, GA) hydrogel lenses was also measured with the lenses within the saline-filled wet cell. These measurements were converted to their in-air equivalent using the formulas described above. Expected values for the soft contact lenses were the manufacturer-labeled contact lens power.
Experiment 3: Evaluate the Accuracy of Higher-Order Aberrations
Instrument Z40 measurements were converted to a clinically relevant unit of measure, longitudinal spherical aberration (LSA) (dioptric difference between the focus of a paraxial and a marginal ray at a radius of 3 mm) using the equation
| (3) |
where LSA is measured in diopters, C40 is the OSA normalized Zernike spherical aberration coefficient value in microns, and r is the pupil radius in mm. (For a detailed derivation of this formula, see Appendix B, available online at www.optvissci.com.) We evaluated the LSA of both the RGP and soft lenses used in experiments 1 and 2. In the case of the RGP lens, expected values were derived from the theoretical ray tracing calculations of Cox.14 For the soft contact lenses, expected LSA values were provided by the lens manufacturer (J. Lindacher, personal communication, 2007).
As coma values inherent to the radially symmetric lenses were expected to be small, coma was induced into these lenses by decentration of the lens behind a stationary measurement aperture. The coma introduced is proportional to the magnitude of spherical aberration and decentration.15 Measurements were taken of the centered lens and then the lens systematically decentered in each horizontal direction in 25-μm steps. A −5.00 D ACUVUE 2 soft lens (Vistakon, Jacksonville, FL) and a −5.00 D 7.5 mm base curve radius Boston ES RGP lens were used for this experiment. Alternatively, the instrument software allows a user-defined analysis aperture that could be decentered.
Expected values of horizontal coma across a 6 mm analysis diameter were calculated in two ways. First, using the conversion matrix described by Guirao et al.,15 the centered Z40 coefficient values of a fourth-order fit were multiplied by the conversion factor, K (Eq. 4), to yield the expected amount of coma measured at each decentration,
| (4) |
where y is the amount of decentration in mm (−0.5 to +0.5 mm), and r is the radius to which the Zernike coefficients were fit (e.g., analysis radius). So, for horizontal lens decentration, the expected coma magnitude is
| (5) |
where C3+1 and C40 are the coefficient values for Zernike horizontal coma and spherical aberration, respectively.
In the second method, an 8 mm wavefront was synthesized from the fourth-order Zernike fit of the centered lens measurement. This wavefront was then incrementally decentered behind a smaller 6 mm subaperture (Fig. 2). A fourth-order Zernike fit was then performed to the wavefront of this subaperture at each incremental level of decentration.
FIGURE 2.
To determine the amount of coma expected due to decentration of a lens with spherical aberration an 8 mm wavefront was synthesized from the fourth-order Zernike fit of the centered lens measurement (left panel). A 6 mm mask was then created (second panel), and then this wavefront was systematically decentered behind this mask (third and fourth panels). At each incremental decentration, a fourth-order Zernike fit was performed to the resulting masked wavefront to obtain the expected Z3+1 value at each corresponding level of decentration.
Experiment 4: Test-Retest Repeatability of Measurements
Repeated measurements were taken of the empty saline-filled cell, and of the fluid-filled cell containing soft and RGP lenses. The variance was compared for repeated measurements where the wet cell remained in place in the instrument and where the lens was removed from the wet cell and then replaced in the wet cell and remeasured. The latter case involved realignment for each measurement.
RESULTS
Experiment 1: Lower-Order Aberrations in Air
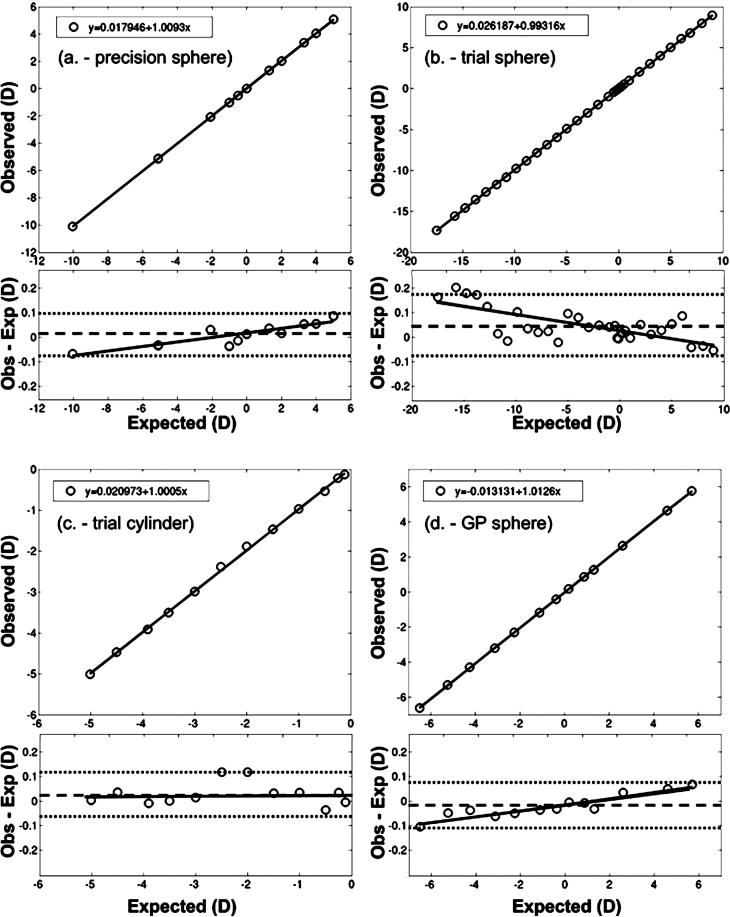
Paraxial spherical power measurements were made in air using the four different calibrated lens sets, and the results are plotted as a function of the specified power of the lens in Fig. 3a to d. In each case, the data are well fit by a straight line with slopes approaching unity (1.0093, 0.9932, 1.0005, and 1.0126 for a to d, respectively) and intercepts close to 0 (0.0179, 0.0262, 0.0210, and 0.0131 for a to d, respectively), indicating that, over a wide range of spherical powers, the instrument is able to measure power to within about 1% error. At this level of accuracy, the source of any discrepancies between the observed and expected may be because of small inaccuracies in the expected values. Interestingly, although the data shown in Fig. 3a, b, d have slopes approaching unity and intercepts approximately at 0, the 95% confidence intervals (CI) for slope and intercept did not include unity or 0, indicating that the small differences observed between the measured data and the expected are systematic. These subtle, but systematic discrepancies can be seen most easily in the Bland-Altman16 plots in Fig. 3. The mean difference (black dashed line), 95% confidence interval of the difference (limits of agreement, LoA) (dotted lines), and best-fit regression line (black solid line) are shown. Notice, for both the precision sphere and the sphere trial lenses, that the mean difference is close to 0 (0.01234 and 0.0468, respectively) and the 95% LoA are relatively small (−0.0745 to 0.0992 and −0.0813 to 0.1749, respectively). However, it is evident that larger errors are experienced for higher lens powers in both calibrated spheres and the spherical trials lenses, and the slopes of the regression lines fitting the difference scores that are significantly different from 0 [95% CI of slope: 0.0079, 0.0105 and −0.0092, −0.0044, respectively]. However, in the case of the sphere trial lenses across the range of −12 to +7 D (potentially the range of greatest clinical interest), the errors observed are quite small (<0.1 D), and a regression fit over this range has a slope much closer to 0 (slope = 0.0005). Similar trends can be seen in the RGP data.
FIGURE 3.
The observed (instrument measured) vs. the expected in-air power of a series of (a) precision calibration spheres, (b) spherical trial sphere lenses, (c) trial cylinder lenses, and (d) 7.5 mm base curve radius RGP contact lenses. Accompanying each observed vs. expected plot are the corresponding Bland-Altman plots. Within these plots, the individual difference in observed and expected sphere values (symbols) are plotted against the expected sphere power, along with the mean difference (dashed line), the 95% CI of the difference (LoA) (dotted lines), and the best-fit regression (solid line).
Experiment 2: Lower-Order Aberrations in the Wet Cell
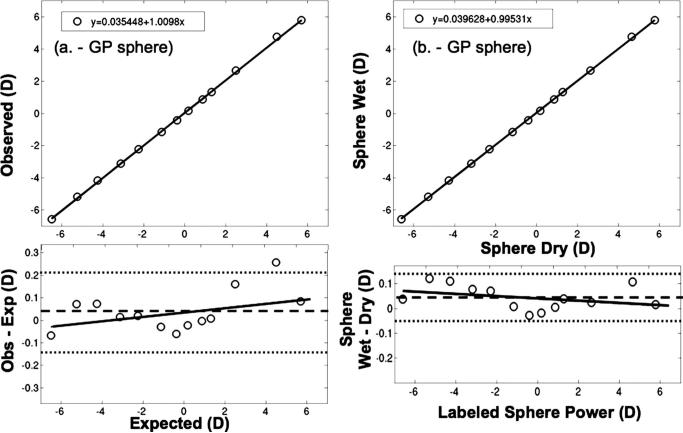
The same series of RGP lenses used in experiment 1 were tested in the saline-filled wet cell. The computationally converted wet cell measurements were compared to the in-air lensmeter measurements (Fig. 4a), and the observed vs. expected linear fit had a slope of 1.0098 and a y intercept of 0.0354, and neither the slope or the intercept differed significantly from the Y = X line. The 95% LoA were −0.1399 to 0.2171. When we compare the ClearWave measured data for these lenses in air to the converted wet cell data (Fig. 4b), they are almost identical (wet vs. dry slope 0.9953 and intercept 0.0396). This slope is not significantly different from 1. The intercept, however, differed significantly from 0. Also, the wet-dry difference 95% LoA were quite small (−0.0534, 0.1403), indicating that the wet to dry conversions were accurate (which in turn indicates that the lens base curve, center thickness, and refractive index information was also close to that expected).
FIGURE 4.
a, The index-converted observed (instrument measured) vs. expected powers of a series of RGP lenses. b, The sphere power for a series of RGP lenses measured in air (dry) versus the index-converted sphere power for these same lenses measured in saline solution (wet).
We then evaluated the potentially more variable (e.g., due to their flexibility and manufacturing tolerances) hydrogel lenses in the saline-filled wet cell. The measured and converted to in-air powers of the −10.00 to +6.00 D CIBA Focus Dailies lenses were compared to the manufacturer's power specifications for these lenses (Fig. 5). In evaluating the observed vs. expected plot, neither the slope of the best-fit line (1.0074, 95% CI: 0.9959, 1.0195) or the intercept (−0.0231, 95% CI: −0.0826, 0.0036) were statistically different from 1 and 0, respectively. Notice, however, that the 95% LoA are wider for the soft contact lens (−0.2620, 0.1865) than for the RGP lens, perhaps indicating either lower levels of precision in manufacturing soft contact lenses or increased measurement noise due to possible lens flexure in the instrument.
FIGURE 5.
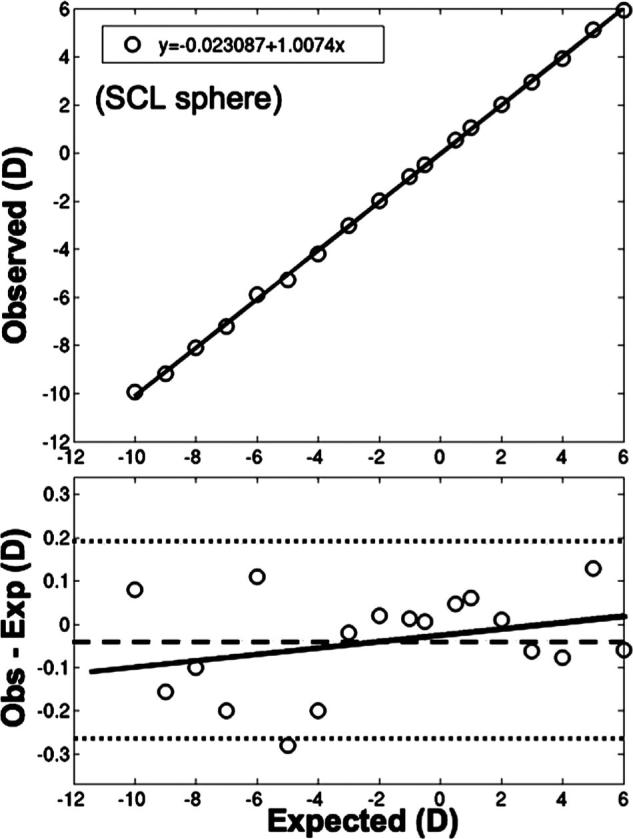
The observed vs. expected sphere power for a series of soft contact lenses measured in solution.
Experiment 3: Higher-Order Aberrations
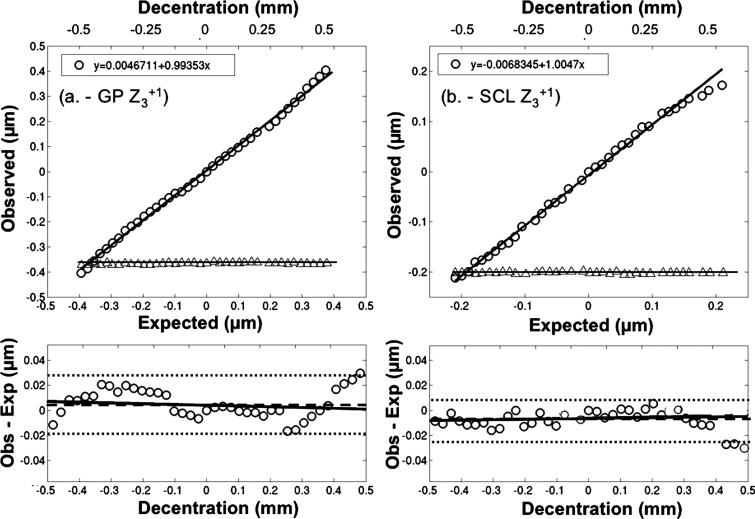
We examined two of the most significant ocular HOAs, coma, and spherical aberration. Before making the wet cell measurements, we confirmed that the wet cell HOA data converted to in-air aberration levels matched the in-air measurements. The observed decentration-induced coma for a RGP lens (in saline) with sphere power of −5.00 D, and −0.37 μm of Z40 (Fig. 6A) closely match the expected levels (slope 0.9935; intercept 0.0047; 95% LoA: −0.0174, 0.0270 μm). Similar data were observed with a soft contact lens (−5.00 D lens containing −0.20 μm of Z40) (Fig. 6b). In this case, the predictions match very closely the measured coma over most of the decentration range, but when the soft contact lens was decentered by more than +0.35 mm, the data are not quite as well fit by the predictions (95% LoA: −0.0240, 0.0094 μm). We suspect this slight discrepancy was generated when the measurement analysis diameter (6 mm) extended beyond the optical zone of the lens (8 mm), which would result if the original measured 8 mm zone was not completely centered on the lens optic zone. Notice in each of these cases, as predicted by optical theory,15 the levels of spherical aberration (triangle symbols in Fig. 6a, b) remain constant regardless of lens decentration. These results emphasize the ability of the ClearWave to accurately measure coma, and again the small errors observed may reflect unknown coma levels in the lenses.
FIGURE 6.
The index-converted observed (instrument measured) horizontal coma (Z3+1) (circles) and spherical aberration (Z40) (triangles) coefficient values vs. those expected for decentration levels of −0.5 mm to +0.5 mm from lens center for a (a) RGP and (b) soft contact lens.
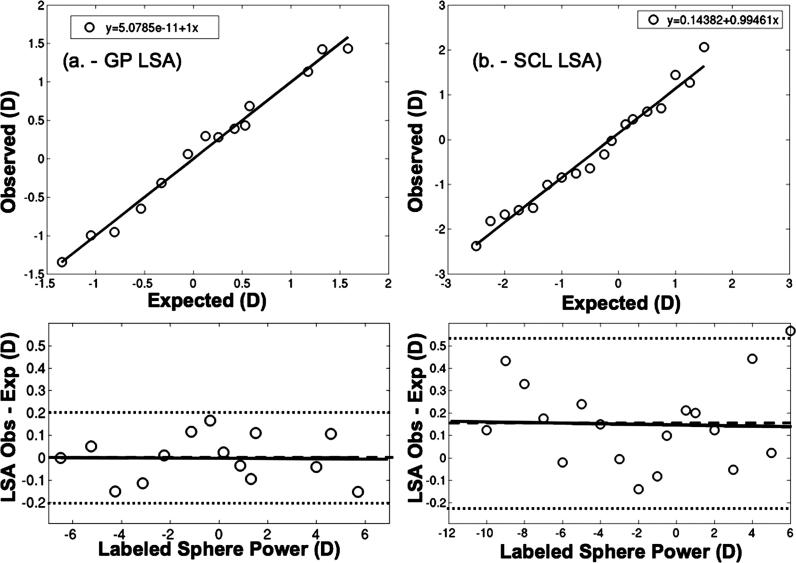
Establishing the accuracy of spherical aberration measurements requires that we employ a series of contact lenses with known levels of spherical aberration. We employ the LSA predictions derived via ray tracing for spherical RGP lenses,14 which found approximately that LSA in diopters = 0.24× spherical power in diopters +0.21 D. We use this equation to predict levels of LSA for the −6.50 to +6.00 D, 7.5 mm base curve radius RGP lenses used in this study. The measured LSA (Fig. 7a) closely approximates the predicted LSA (slope = 1.000, intercept = 0.000). The correlation coefficients for sphere, cylinder, and coma regressions shown in Figs. 3 to 6 have R2 in excess of 0.9999, in this case, the R2 dropped to 0.9866. This reduced correlation coefficient is largely because of the reduced range and not increased variability as highlighted in the LoA plot [LoA for LSA (Fig. 7a) are about the same as sphere power (Fig. 4a)].
FIGURE 7.
The index-converted instrument measured LSA vs. the expected LSA for a series of (a) RGP and (b) soft contact lenses.
We also measured the LSA of a series of soft lenses (−10.00 D to +6.00 D) (CIBA Focus Dailies). The predicted LSA levels in this case (Fig. 7b) were provided by the manufacturer. The measured levels of LSA were similar to these expected levels of LSA (slope of 0.9946 and intercept of 0.1438). The slope was not significantly different than 1 (95% CI: 0.9125, 1.1077), but the intercept was significantly different than 0 (95% CI: 0.0391, 0.2495). The failure of each lens measurement to agree with the lens specification is evidenced by the considerably wider 95% LoA (−0.2233, 0.5360).
Experiment 4: Test-Retest Repeatability
With any instrument, it is critical to know the repeatability of measurements, and the factors that determine the variability in repeated measures.17 Performing repeated measurements of the higher-order Root Mean Square (RMS) on the empty wet cell yielded highly repeatable measurements (variance of 1 × 10⁻⁸ μm2). This variance stayed at the same level even when repeated measures were taken after removing and replacing the empty wet cell within the instrument. With a RGP or soft contact lens in the wet cell, variance increased only slightly on repeated measurements where the cell remained in the instrument [RGP: 3.9 × 10⁻⁷ μm2; soft contact lens (SCL): 4.6 × 10⁻⁶ μm2] and when the lenses were repeatedly removed and reinserted into the wet cell (RGP: 2.9 × 10⁻⁶ μm2; SCL: 2 × 10⁻⁵ μm2). It should be noted that this variability observed with the Clear-Wave instrument is much smaller than the variance we have previously reported for repeated double pass aberrometer measurements of polymethylmethacrylate model eyes (0.002 μm2 or 0.0015 D2) and human eyes (within a second) (0.009 μm2 or 0.007 D2).18
Application of Technology
This instrument can be used to examine the aberration properties of aspheric lens designs. Fig. 8 plots the LSA as a function of labeled soft contact lens power for a spherical lens with no spherical aberration control (ACUVUE 2) (dashed line) and an aspheric lens (solid line) designed to have zero spherical aberration across all lens powers (A. Back, personal communication, 2007) (Biomedics XC; Cooper Vision, Rochester, NY). In this case, as anticipated, the spherical lens has levels of LSA that vary with lens power,19 and the aspheric lens comes very close to meeting its design specifications with LSA of less than ±0.50 D across all lens powers.
FIGURE 8.
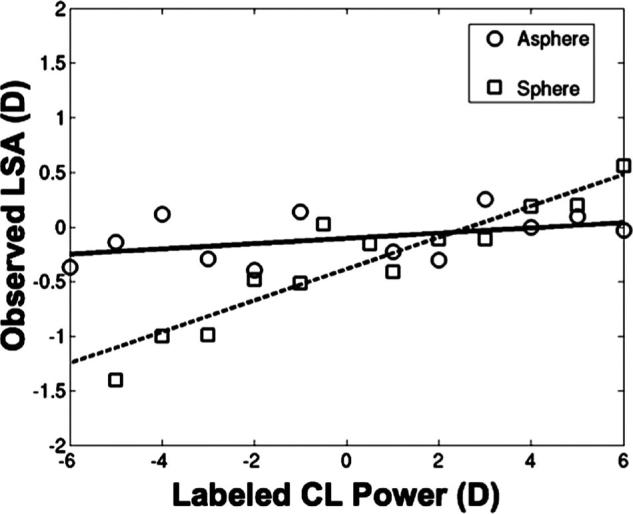
Index-converted instrument measured LSA (D) vs. the corresponding manufacturer-labeled lens power (D) for an aspheric (solid line) and spherical (dashed line) soft contact lens power series.
DISCUSSION
The ClearWave off-eye contact lens aberrometer can provide highly accurate measurements of second-, third-, and fourth-order aberrations of lenses. It has the ability to measure ophthalmic and contact lenses in both air and saline. The successful wet cell to air conversions indicate that this device will allow precise evaluation of the optical characteristics of thin soft contact lenses, which until now has been very difficult to accomplish. The instrument produces highly repeatable measurements. These results show that the ClearWave will provide a valuable new measurement tool with the ability to evaluate new thin soft contact lenses and aspheric (including multifocal) lens designs.
It is important to examine the discrepancies observed between the measured and expected results. They fall into the two familiar categories of systematic and random “error,” which we show using the Bland-Altman plots. The repeatability tests confirm that the instrument has great precision, and thus we can remove simple measurement variability as a potential cause of the discrepancies. One result offers some direct insight at the source of these discrepancies. When we measured a RGP lens once in air and then in the wet cell, after converting the wet cell data to in-air power, we found that the two were almost identical over a ±6.00 D range (Fig. 4b). Central to the importance of these measurements is the fact that it was the same lens being tested each time, and as a RGP lens, at a fixed temperature, we anticipate this lens to have the same structural and refractive index properties in both situations. This shows that the instrument is able to measure the same lens under different circumstances with the same result. Over a 12.00 D range, the differences were all less than ±0.10 D. The small discrepancies observed here, which were largely random about zero, reflect some small level of measurement error [Variance (VAR) of discrepancy data = 0.0024 D2].
The increased differences observed between expected and measured seen in the soft contact lens data (Fig. 5, VAR of discrepancy data = 0.0127 D2), may simply reflect the lower levels of precision manifested by the manufacturing process involved in making soft contact lenses rather than an instrument introduced error.20-22 There is, however, the genuine concern that soft contact lenses will flex in the wet cell, and this may contribute to increased discrepancies between predicted/expected and measured. Experiments with ACUVUE 2 spherical lenses found that supported and unsupported soft contact lenses exhibited virtually identical levels of SA (supported = 1.018 × unsupported, with a LoA of −0.5817, 0.5263), which indicates that lens flexure within the wet cell is an unlikely cause of the observed discrepancies.
The small but systematic differences seen in the sphere power measurements for the calibrated spheres and the trial lenses (Fig. 3) could be generated by systematic errors in the lens specifications, which is unlikely, or a failure to acquire the ClearWave measurement precisely at the back vertex plane of the lenses. For example, the spherical and cylinder lenses employed in the measurements shown in Figs. 3b, c were standard biconvex or biconcave trial lenses with a circumferential ring holder. Therefore, in theory, placing either lens side toward the measurement aperture should give the same result (e.g., as in lensmeter). However, this may not be the case for the measurements taken with the ClearWave. For the ClearWave measurements, a special circular mount was used in which the outer ring holding the lens (e.g., silver ring with numeric label) rested horizontally on a groove of the lens mount. It is possible that if the ring mount around the lens edge were not precisely positioned along the z axis (measurement axis) of the lens, the lens back vertex would not be at the location anticipated by the instrument, causing the instrument to under- or over-estimate the true lens power. The dioptric magnitude of this over- or underestimation would be in proportion to the magnitude of the lens power and the distance the true lens back vertex was displaced from the anticipated location (similar to vertexing a spectacle prescription). Therefore, if this were true, the higher-powered lenses would show larger deviations from expected than lower-powered lenses, as they do (e.g., Fig. 3b).
Within the contact lens industry and clinic, occasional unpredictable on-eye results have been attributed to the poor manufacturing accuracy and reproducibility in the lower-order aberrations of contact lenses.20 These inaccuracies have been reported to be the cause of poor patient satisfaction with lenses and poor success rates with some lenses.23-26 The ClearWave instrument could become a valuable tool in allowing contact lens manufacturers, clinical researchers, and clinicians to directly assess not only the lower-order aberrations, but also the HOAs of contact lenses. Hopefully, with improved knowledge of the contact lens optics these clinical problems can be avoided, and patient satisfaction with contact lenses can be improved.
ACKNOWLEDGMENTS
The authors would also like to acknowledge the Borish Center for Ophthalmic Research, Joe Lindacher of CIBA Vision, and James Copland of AMO-Wavefront Sciences for their assistance. This work was supported in part by NIH/NEI K23EY016170 (PSK), and NIH/NEI L30EY015127 (PSK).
APPENDIX
The appendices are available online at www.optvissci.com.
APPENDIX A
Conversion of Wet to In-Air Sphere Power
In air, the power of each lens surface (Pair) can be found by
| (A1) |
where r is the lens base curve radius, and nlens and nair are the refractive indices of the lens material and air, respectively. Likewise, the power of the lens surface in solution (Pwet) is
| (A2) |
where r is the lens base curve radius, and nlens and nsol are the refractive indices of the lens material and saline solution, respectively. Therefore, the ratio of the lens surface powers in air to that of the lens in solution is
| (A3) |
Therefore, the lens power conversion formula generally employed is
| (A4) |
where, nlens, nair, and nsolution are the indices of refraction of the lens, air, and solution, respectively, and Pwet and Pair are the dioptric powers of the lens measured in the wet cell and air, respectively.27 As typical values of hydrated lens indices range from 1.4 to 1.5, the conversion factors are approximately 4 to 5. There are several disadvantages to this method. First, this conversion formula is only true for thin lenses, and although contact lenses are the “thinnest mode of correction available” they are more appropriately treated as thick lenses.7 For example, if we assume a contact lens of power −1.50 D in solution, lens index of 1.4, solution index of 1.33, base curve radius of 8.7 mm, and center thickness of 0.2 mm, the thin lens approximation (Eq. A4) yields an in-air power of −8.57 D. However, if the lens was considered as a thick lens (see below, Eq. A10), the in-air power is −8.37 D. Second, any power measurement error that may occur is multiplied by 4 to 5 times upon conversion. Third, index of refraction is dependent on lens hydration and temperature, and therefore, the index of refraction values provided by the manufacturer may be unrepresentative of those present during measurements.3 Fourth, lenses sitting in a wet cell cannot be placed directly against the lensmeter aperture stop. This axial separation induces propagation errors that scale with lens power (e.g., similar to vertexing a spectacle to contact lens prescription). This last issue, however, was corrected for in the ClearWave instrument design, so may be limited only to traditional lensmeters.
An equation that accounts for lens thickness and index, is required for a more accurate conversion of wet to in-air lens power. Below, we describe in more detail the derivation of this equation.9
We first start with the definition of the power of an optical surface (Eq. A5).
| (A5) |
where n’ and n are the refractive indices and r2 is the lens base curve radius (meters). For convenience, we then find the reciprocal of lens base curve radius (c2) using the following equation:
| (A6) |
Substituting Eqs. A1 and A2 with the thick lens equation (Eq. A7), where n2 is the index of refraction of the lens, and d is the center thickness of the lens in meters
| (A7) |
we get
| (A8) |
where n1 is the index of refraction of the solution. Then, solving Eq. A8 for c1 we get
| (A9) |
Lastly, c1 is then inserted into Eq. A10, which is an algebraic manipulation of the thick lens equation, where Pair is the converted dioptric power of the lens in air (on-eye equivalent) and n1 (index of the solution) has been replaced with the index of refraction of air (nair = 1).
| (A10) |
APPENDIX B
Conversion of Z40 (Microns) to LSA (D)
The wavefront function for Zernike spherical aberration (W40) as a function of normalized (e.g., min = 0, max = 1) analysis (e.g., pupil) radius (ρ) is given by Eq. B1, where C40 is the Zernike coefficient value.
| (B1) |
If instead, we wanted to obtain the wavefront function at the analysis radius in real units, knowing that
| (B2) |
where r is the radius at any given point and rmax is the maximum pupil radius, we can rewrite Eq. B1 as Eq. B3.
| (B3) |
Now, this wavefront (W) is a function of the radial distance (r) from the optical z axis (see Fig. B1). A ray of light at any particular point a on the wavefront intersects the z axis at angle t and at distance d from the wavefront. The vergence V of the rays and wavefront is thus 1/d (in air), which is also the power of the lens that refracted the light, assuming the lens is located at z = 0. Typically, the distances associated with W (on the order of microns) are much smaller than d and so, to close approximation, tan(τ) = r/d. Because every ray is perpendicular to the wavefront, tan(τ) is also the slope of the wavefront at point r. This is specified mathematically by the wavefront's spatial derivative, dW/dr. Combining these results, Eq. B4, the vergence of the wavefront is equal to the ratio of its slope to the radial distance r.
| (B4) |
We now take the first derivative of Eq. B3 to yield Eq. B5.
| (B5) |
Combining this result with Eq. B4 we get Eq. B6.
| (B6) |
The LSA in Diopters is the difference between the vergence of light at the pupil edge from the pupil center (Eq. B7).
| (B7) |
Combining Eq. B6 and Eq. B7, we get
| (B8) |
As r0 is 0, this equation reduces to Eq. B9.
| (B9) |
FIGURE B1.
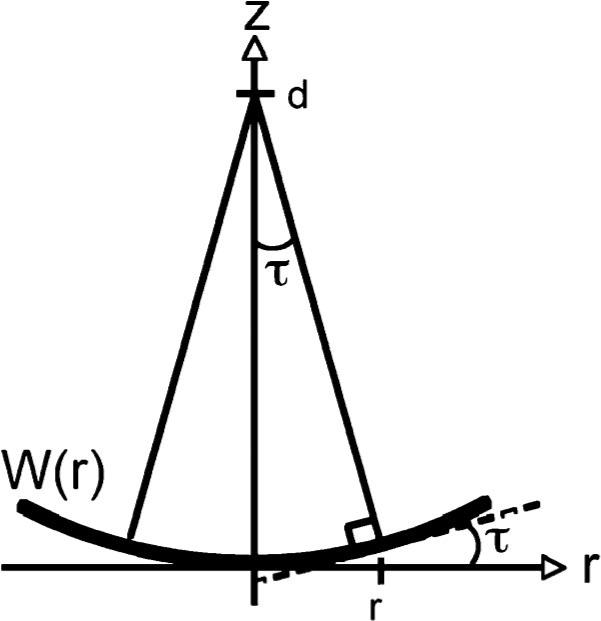
Geometrical relationship between the wavefront, W(r), the angle τ between a ray and the z axis, and the distance d from the wavefront to the focus point. This diagram is rotated 90° from Fig. 1 to show the wavefront as a mathematical function W(r) of the distance r along the radial r axis drawn perpendicular to the optical z axis. The dashed line is tangent to the wavefront and perpendicular to the ray at the radial location r
Footnotes
The authors have no financial interest in any of the products described in this manuscript.
REFERENCES
- 1.Plainis S, Charman WN. On-eye power characteristics of soft contact lenses. Optom Vis Sci. 1998;75:44–54. doi: 10.1097/00006324-199801000-00024. [DOI] [PubMed] [Google Scholar]
- 2.Bauer GT, Lechner HB. Measurement of the longitudinal spherical aberration of soft contact lenses. Opt Lett. 1979;4:224–6. doi: 10.1364/ol.4.000224. [DOI] [PubMed] [Google Scholar]
- 3.Benjamin WJ. Optical phenomena of contact lenses. In: Bennett ES, Weissman BA, editors. Clinical Contact Lens Practice. Lippincott Williams & Wilkins; Philadelphia: 2005. pp. 111–64. [Google Scholar]
- 4.Westheimer G. Aberrations of contact lenses. Am J Optom Arch Am Acad Optom. 1961;38:445–8. doi: 10.1097/00006324-196108000-00005. [DOI] [PubMed] [Google Scholar]
- 5.Lopez-Gil N, Castejon-Mochon JF, Benito A, Marin JM, Lo-a-Foe G, Marin G, Fermigier B, Renard D, Joyeux D, Chateau N, Artal P. Aberration generation by contact lenses with aspheric and asymmetric surfaces. J Refract Surg. 2002;18:S603–9. doi: 10.3928/1081-597X-20020901-21. [DOI] [PubMed] [Google Scholar]
- 6.Jeong TM, Menon M, Yoon G. Measurement of wave-front aberration in soft contact lenses by use of a Shack-Hartmann wave-front sensor. Appl Opt. 2005;44:4523–7. doi: 10.1364/ao.44.004523. [DOI] [PubMed] [Google Scholar]
- 7.Benjamin WJ. Applied optics of contact lens corrections. In: Benjamin WJ, Borish IM, editors. Borish's Clinical Refraction. 2nd ed. W.B. Saunders; Philadelphia: 2006. pp. 1188–245. [Google Scholar]
- 8.Campbell C. Converting wet cell measured soft lens power to vertex power in air. Int Contact Lens Clin. 1984;11:168–71. [Google Scholar]
- 9.Copland J. ClearWave Aberrometer: Instrument Theory of Operations. AMO-Wavefront Sciences; Albuquerque: 2007. [Google Scholar]
- 10.Fatt I, Chaston J. The effect of temperature on refractive index, water content, and central thickness of hydrogel contact lenses. Int Contact Lens Clin. 1980;7:250–5. [Google Scholar]
- 11.Nichols JJ, Berntsen DA. The assessment of automated measures of hydrogel contact lens refractive index. Ophthalmic Physiol Opt. 2003;23:517–25. doi: 10.1046/j.1475-1313.2003.00147.x. [DOI] [PubMed] [Google Scholar]
- 12.International Standards Organization . ISO 9342−2:2005: Optics and Optical Instruments: Test Lenses for Calibration of Focimeters. Part 2. International Standards Organization; Geneva, Switzerland: 2005. [Google Scholar]
- 13.Clement MKT, Hayden JS, Hayden YT, Hoffmann HJ, Lentes FT, Neuroth N. Optical properties. In: Bach H, Neuroth N, editors. The Properties of Optical Glass. Springer; Berlin: 1998. pp. 19–66. [Google Scholar]
- 14.Cox I. Theoretical calculation of the longitudinal spherical aberration of rigid and soft contact lenses. Optom Vis Sci. 1990;67:277–82. doi: 10.1097/00006324-199004000-00008. [DOI] [PubMed] [Google Scholar]
- 15.Guirao A, Williams DR, Cox IG. Effect of rotation and translation on the expected benefit of an ideal method to correct the eye's higher-order aberrations. J Opt Soc Am A. 2001;18:1003–15. doi: 10.1364/josaa.18.001003. [DOI] [PubMed] [Google Scholar]
- 16.Bland JM, Altman DG. Statistical methods for assessing agreement between two methods of clinical measurement. Lancet. 1986;1:307–10. [PubMed] [Google Scholar]
- 17.Cheng X, Himebaugh NL, Kollbaum PS, Thibos LN, Bradley A. Validation of a clinical Shack-Hartmann aberrometer. Optom Vis Sci. 2003;80:587–95. doi: 10.1097/00006324-200308000-00013. [DOI] [PubMed] [Google Scholar]
- 18.Thibos LN, Cheng X, Bradley A. Design principles and limitations of wave-front guided contact lenses. Eye Contact Lens. 2003;29:S167–70. doi: 10.1097/00140068-200301001-00046. [DOI] [PubMed] [Google Scholar]
- 19.Dietze HH, Cox MJ. On- and off-eye spherical aberration of soft contact lenses and consequent changes of effective lens power. Optom Vis Sci. 2003;80:126–34. doi: 10.1097/00006324-200302000-00008. [DOI] [PubMed] [Google Scholar]
- 20.Payor RE, Robirds SR, Zhang X, Schwallie JD. Soft toric lens power accuracy and reproducibility. CLAO J. 1995;21:163–8. [PubMed] [Google Scholar]
- 21.Seibel EJ, Trilsch WR, Lee D. Evaluating soft contact lens quality: a manufacturer's perspective. Am J Optom Physiol Opt. 1988;65:298–307. doi: 10.1097/00006324-198804000-00010. [DOI] [PubMed] [Google Scholar]
- 22.Efron N, Morgan P, Morgan S. Accuracy and reproducibility of one-day disposable contact lenses. Int Contact Lens Clin. 1999;26:168–73. doi: 10.1016/s0892-8967(01)00043-8. [DOI] [PubMed] [Google Scholar]
- 23.Davies I. Soft toric contact lenses: a systematic approach to problem solving. Optician. 1989;198:16–8. [Google Scholar]
- 24.Davies I. Fitting a spuncast soft toric contact lens. Optician. 1991;201:36–41. [Google Scholar]
- 25.Adler P. Soft toric lens update. Trans BCLA. 1990;13:33–6. [Google Scholar]
- 26.Ames KS, Erickson P, Medici L. Factors influencing hydrogel toric lens rotation. Int Contact Lens Clin. 1989;16:221–5. [Google Scholar]
- 27.Douthwaite WA. Contact Lens Optics and Design. 2nd ed. Butterworth-Heinemann; Oxford, UK: 1995. pp. 257–61. [Google Scholar]


