

Abstract
PURPOSE
To describe the relation between magnitude of anisometropia and interocular acuity difference (IAD), stereoacuity (SA), and the presence of amblyopia in school-aged members of a Native American tribe with a high prevalence of astigmatism.
METHODS
Refractive error (cycloplegic autorefraction confirmed by retinoscopy), best corrected monocular visual acuity (VA; Early Treatment Diabetic Retinopathy Study logMAR charts), and best corrected SA (Randot Preschool Stereoacuity Test) were measured in 4- to 13-year-old Tohono O'odham children (N = 972). Anisometropia was calculated in clinical notation (spherical equivalent and cylinder) and in two forms of vector notation that take into account interocular differences in both axis and cylinder magnitude.
RESULTS
Astigmatism ≥ 1.00 D was present in one or both eyes of 415 children (42.7%). Significant increases in IAD and presence of amblyopia (IAD ≥ 2 logMAR lines) occurred, with ≥ 1 D of hyperopic anisometropia and ≥2 to 3 D of cylinder anisometropia. Significant decreases in SA occurred with ≥0.5 D of hyperopic, myopic, or cylinder anisometropia. Results for vector notation depended on the analysis used, but also showed disruption of SA at lower values of anisometropia than were associated with increases in IAD and presence of amblyopia.
CONCLUSIONS
Best corrected IAD and presence of amblyopia are related to amount and type of refractive error difference (hyperopic, myopic, or cylindrical) between eyes. Disruption of best corrected random dot SA occurs with smaller interocular differences than those producing an increase in IAD, suggesting that the development of SA is particularly dependent on similarity of the refractive error between eyes.
Children who have anisometropia, a difference in refractive error between their two eyes, are known to be at risk of amblyopia.1-4 Furthermore, most investigators have reported that the greater the magnitude of the anisometropia, the more severe the amblyopia tends to be.5-20 Because anisometropic amblyopia is treatable in childhood, with optical correction alone or accompanied by patching or penalization of the nonamblyopic eye, eye care professionals advocate methods for detection of anisometropia in young children. However, as shown in Table 1, there is considerable variability among professional groups1-4 and clinician investigators5,6,8,12-19,21-36 as to which aspects of refractive error should be used to define anisometropia and in the amount of anisometropia judged to be potentially amblyogenic.
Table 1.
Summary of Definitions of Anisometropia (Difference in Cycloplegic Refractive Error between Fellow Eyes) Thought to be Potentially Amblyogenic in Preschool and School-Aged Children
| Definition of Amblyogenic Anisometropia (D) | |||||||||
|---|---|---|---|---|---|---|---|---|---|
| Source | Criteria for Definition | Age Range (y) | Unspecified | Sphere | SE | Hyperopia | Myopia | Cylinder | Corresponding Meridians |
| Am Acad Ophthalmol1 | Consensus | ≥2 | ≥1.50 | ≥2.00 | ≥2.00 | ||||
| Amer Optom Assn2 | Consensus | Not given | >1.00 | >3.00 | >1.50 | ||||
| corresponding meridian | corresponding meridian | ||||||||
| AAPOS3 | Consensus | Preschool age | >1.50 | >1.50 | |||||
| NSPB4 | Consensus | ≥3 | ≥1.50 | ||||||
| Weakley18,19 | Large dataset | 3-14 | >1.00 SE* | >2.00 SE* | >1.50* | ||||
| Tanlamai & Goss16 | Restricted dataset†‡ | 7-37 | ≥2.50 SE§ | ≥4.50 SE§ | |||||
| Doležalova8 | Moderate dataset‡§ | 3-6 | >2.00 | ||||||
| Copps6 | small dataset | Not given | ≥2.00 SE | ||||||
| Caputo et al.5 | Investigator-defined | 2-8 | >1.00 | >1.00 | |||||
| Chen et al.23 | Investigator-defined | 3-7 | ≥1.00 sphere | ≥1.00 sphere | ≥1.00 | ||||
| Leon et al.13 | Investigator-defined | 1-6 | >1.00 | ||||||
| Donahue25 | Investigator-defined | 1-6 | >1.00 | ||||||
| Grönlund et al.27 | Investigator-defined | 4-15 | ≥1.00 | ||||||
| PEDIG31 | Investigator-defined | 3-<7 | ≥0.50 | ≥1.50 | |||||
| Amorim Garcia et al.21 | Investigator-defined | 7-24 | ≥2.00 | ≥2.00 | |||||
| Donnelly et al.26 | Investigator-defined | 8-9 | ≥1.50 sphere | ≥1.50 sphere | ≥1.00 | ||||
| Robaei et al.32,33 | Investigator-defined | 5-8 and 11-14 | >1.00 | ||||||
| Stewart et al.35 | Investigator-defined | 3-8 | ≥1.00 | ||||||
| VIP36 | Investigator-defined | 3-5 | >1.00 SE | >3.00 SE | >1.50 | ||||
| Cobb et al.24 | Investigator-defined | 3-8 | ≥2.00 | ≥2.00 | |||||
| Rutstein and Corliss14 | Investigator-defined | 3-39 | ≥1.00 | ≥1.00 | |||||
| Lithander29 | Investigator-defined | 6-7 and 11-12 | |||||||
| Townshend et al.17 | Investigator-defined | 7-70 | ≥0.75 | ≥0.75 | |||||
| Hardman Lea et al.28 | Investigator-defined | 3-7 | ≥1.00 | ||||||
| Sen15 | Investigator-defined | Not given | ≥1.00 | ≥1.00 | |||||
| Ingram12 | Investigator-defined | 0-8+ | ≥1.00 | ≥1.00 | ≥1.00 | ||||
| MacDiarmid & Waterhouse30 | Investigator-defined | Not given | >1.50 sphere | >1.50 | |||||
| Robinson34 | Investigator-defined | 5-15 | ≥1.50 | ||||||
| Blum et al.22 | Professionals questioned | Grades 1-6 | ≥1.00 | ||||||
Significantly more amblyopia than in nonanisometropic group
Subjects in one group all had at least 2.00 D of anisometropia; in other group all had at least 1.00 D of anisometropia; no statistical analysis.
No statistical analysis.
50% amblyopic.
One problem that has led to the variability in the criteria used to define anisometropia has been the lack of data relating type and amount of anisometropia to presence of amblyopia. To date, the only study that has incorporated statistical analyses and a nonanisometropic group to examine this issue in a large sample of children was Weakley's evaluation of a patient population.18,19 Best corrected interocular acuity difference (IAD), best corrected stereoacuity (SA), and presence versus absence of amblyopia (defined as one full Snellen line or greater of acuity difference between eyes) were examined in 411 pediatric ophthalmology patients who had no strabismus and no history of glasses wear. Results showed a significant increase in IAD, a significant decrease in SA, and a significant increase in prevalence of amblyopia in children with hyperopic anisometropia >1.00 D, myopic anisometropia >2.00 D, or cylinder anisometropia >1.50 D, compared with a group of 50 children with isometropia who had neither spherical nor cylindrical anisometropia. Limitations of the study include: (1) use of a variety of visual acuity (VA) charts, including Snellen letters, HOTV letters, and Allen pictures, none of which had logMAR spacing of optotype sizes; (2) use of the Titmus SA test, which, unlike random dot SA tests, contains monocular as well as binocular cues; (3) use of a subject population that contained relatively few (n = 30) patients with cylinder anisometropia >1.50 D in the absence of spherical anisometropia; (4) failure to include patients with cylinder anisometropia who had interocular differences in cylinder axis >10°; (5) a data collection protocol in which patients who had unequal interocular best corrected VA at the initial visit were retested after a mean of 14.8 weeks of spectacle wear, which could have significantly reduced prevalence of anisometropic amblyopia23,31,35,37; and (6) possible bias in the subject population, because all subjects, including the nonanisometropic group, were patients seen in a pediatric ophthalmology practice.
A recently published study avoided the potential problem of bias in the subject population by using photoscreening of a large preschool population to identify a sizeable group of anisometropic children.13 However, although VA results were available for all children in the study, it is impossible to know what proportion of the children had amblyopia and what proportion had reduced acuity resulting from uncorrected refractive error. That is, the investigators were unable to determine which children had VA tested with correction of refractive error and which children had it tested without.
An important point concerning studies that have examined amblyopia in anisometropic individuals is that many of the studies have entirely ignored the effect of cylinder anisometropia or ignored the effect of differences in cylinder axis between eyes (Table 1). Several studies have dealt with axisrelated issues by examining interocular differences in refractive error along identical meridians in the two eyes (Table 1), and one study14 calculated amount of anisometropia using a root mean square difference formula,38 which simultaneously takes into account cylinder power and axis. However, no studies have been conducted to examine the prevalence of anisometropic amblyopia as a function of either of the two recent methods of vector analysis of differences in refractive error measurements from fellow eyes.39,40 One method39 allows for determination of interocular differences for spherical equivalent and for Jackson cross-cylinder components for the vertical/horizontal (J0) and oblique (J45) meridians. The other method40 determines interocular difference in refractive error by representing refractive error as a single value in three-dimensional space that takes into account sphere, cylinder, and axis.
The purpose of the present study was to examine IAD, SA, and the presence of amblyopia as a function of amount of anisometropia in a large sample of elementary school children who are members of a Native American tribe known to have a high prevalence of astigmatism.41-43 A benefit of this subject population is that it allows assessment of the role of astigmatism and astigmatic axis as risk factors for the development of amblyopia.
METHODS
Subjects
Subjects were 1047 children 4 to 13 years of age who attended elementary school (kindergarten through sixth grade) on the Tohono O'odham Reservation (in southern Arizona) and who underwent a comprehensive eye examination, including cycloplegic refraction, and best corrected VA testing as part of a prospective study of optical treatment of astigmatism-related amblyopia in younger (grades K-2) and older (grades 4-6) children.44,45 Participation was offered to all children attending grades K-2 and 4 to 6 during the initial year that testing was conducted in each of the five elementary schools on the reservation. The participation rate was 85% or greater at all schools. Data are reported for only the first study-related eye examination and first study-related vision-testing session conducted on each child.
The research adhered to the tenets of the Declaration of Helsinki and was approved by the Institutional Review Board of the University of Arizona. Parents provided written informed consent before testing and filled out a questionnaire concerning the child's history of eye problems and treatment for those problems, including whether the child had ever worn glasses.
Procedures
Eye Examinations
Eye examinations included assessment of eye alignment using the cover-uncover test at distance and near, assessment of distance VA at 4 m with ETDRS logMAR charts (Precision Vision, Inc., La Salle, IL),46 measurement of refractive error 40 to 60 minutes after instillation of one drop of proparacaine (0.5%) and two drops of cyclopentolate (1%) in each eye, and examination of the external eye and the fundus for abnormalities.47,48 Cycloplegic refractive error was measured with an autorefractor (Retinomax K +; Nikon, Inc., Melville, NY, now manufactured by Righton Manufacturing Co., Tokyo, Japan), followed by verification of autorefractor measurements by an experienced retinoscopist (JMM) and, when possible, by subjective refinement in subjects under cycloplegia.48 At the time of retinoscopy, the retinoscopic reflex was observed for change in character suggesting that inadequate cycloplegia was obtained, and if necessary, additional time was given for an absence of this effect to be observed. The final estimate, i.e., the estimate confirmed by retinoscopy and, when possible, by subjective refinement, was used for determination of presence versus absence of anisometropia and for the prescription of spectacles.
Testing of Best Corrected Recognition Acuity and SA
An average of 3.3 weeks (SD 2.0) after the examination, eyeglasses were dispensed to all children whose eye exam results showed VA worse than 20/20 in one or both eyes and who had hyperopia >2.50 D on any meridian, myopia >0.75 D on any meridian, and/or astigmatism >1.00 D in power in one or both eyes, and to all who had anisometropia >1.50 D spherical equivalent (SE). At this time, best corrected monocular recognition VA was assessed at 4 m, and best corrected SA was assessed at 40 cm.47 Children who had been prescribed spectacles had spectacles fitted at the beginning of the test session, but wore the spectacles only at the VA and SA stations. Children who had not been prescribed spectacles were fitted with stock glasses that differed from their cycloplegic refraction results by no more than 0.50 vector dioptric difference (VDD)40,49,50 in each eye, and they wore these spectacles only at VA and SA testing stations.
VA was measured at 4 m, using ETDRS logMAR charts46: chart 1 (Precision Vision catalog item no. 2121) for the right eye and chart 2 (catalog item no. 2122) for the left eye. Testing began with the top line on the chart (20/200), and the child was asked to name, or to match to letters on a lap card, all letters on each line. Masking of adjacent lines or letters was not allowed, but the tester was permitted to place a sharp pointed object beneath a letter to direct the child's attention to the letter. VA was recorded as the smallest optotype size at which the child identified at least three optotypes correctly.
SA was assessed with a random dot test (Randot Preschool SA Test; Stereo Optical Co., Chicago, IL),51 with a 40-cm ribbon attached that the tester used repeatedly to ensure the proper test distance. SA was recorded as the smallest disparity at which the subject could correctly identify two of three shapes in the random dot display.
Data Analysis
Clinical Notation
Results were examined for four groups of subjects, all of whom were members of the subject population of Tohono O'odham children: (1) isometropic (ISO); (2) SE hyperopic anisometropia (SHA); (3) SE myopic anisometropia (SMA); and (4) cylinder anisometropia (CA). As summarized in Table 2, criteria for inclusion in each group were based on amount and type (hyperopic versus myopic) of SE anisometropia and amount of cylinder anisometropia. These inclusion criteria were chosen to allow examination of results of children with the two types of spherical equivalent anisometropia in the absence of cylinder anisometropia, and results of children with cylinder anisometropia in the absence of spherical equivalent anisometropia, similar to the analyses conducted by Weakley.18,19
Table 2.
Criteria Used for Inclusion of Subjects in Each of the Four Groups of Anisometropia, Based on Clinical Notation Calculation of SE and Cylinder Anisometropia
| Cylinder Anisometropia | ||||
|---|---|---|---|---|
| SE Type | Amount of SE Anisometropia | <0.25 D | 0.25 to <1.00 D | ≥1.00 D |
| As indicated, for the analyses, some subjects were included in both the SHA and CA groups and some were included in both the SMA and CA groups. Categories indicated by the blanks were not included in analyses. ISO, isometropic group; SHA, spherical hyperopic anisometropia group; SMA, spherical myopic anisometropia group; CA, cylinder anisometropia group. | ||||
| Hyperopic SE in both eyes | <0.25 D | ISO | CA | CA |
| 0.25 to <1.00 D | SHA | SHA, CA | CA | |
| ≥1.00 D | SHA | SHA | - | |
| Myopic SE in both eyes | <0.25 D | ISO | CA | CA |
| 0.25 to <1.00 D | SMA | SMA, CA | CA | |
| ≥1.00 D | SMA | SMA | - | |
| Other | <0.25 D | ISO | CA | CA |
| 0.25 to <1.00 D | - | CA | CA | |
| ≥1.00 D | - | - | - | |
Vector Notation
Using the method of Thibos et al.,39 we determined the difference between eyes in M (equivalent to SE), J0 (power in the vertical/horizontal meridians), and J45 (power in the oblique meridians).
With the Harris method,40,49,50 we determined the VDD between eyes, which results in a single number representing the vector distance between the two refractions.
Differences between eyes based on vector notation can be equated to differences between eyes in clinical notation as follows: (1) in the notation of Thibos et al.,39 a difference between eyes of 0.50 D of J0 is equivalent to a cylinder difference (clinical notation) of 1.00 D at 90° and a difference between eyes of 0.50 D of J45 is equivalent to a cylinder difference (clinical notation) of 1.00 D at 45°48,49; and (2) in the notation of Harris,40 a difference between eyes of 1.41 VDD is equivalent to a sphere difference of 1.00 D in a pair of eyes with no astigmatism difference.48,49
For both types of vector notation, a group with minimal anisometropia, similar to the ISO group in clinical notation (SE anisometropia < 0.25 D and cylinder anisometropia < 0.25 D), was defined. With the notation of Thibos et al.,39 subjects included in the minimal anisometropia group had an interocular difference in M of <0.25 D, and interocular differences in both J0 and J45 that were <0.125 D. Also, because analyses of M anisometropia would be equivalent to the analyses of SE anisometropia presented in the clinical notation analyses and because J0/J45 analyses were included to focus on the cylinder and axis components of anisometropia, data from children with large (≥1.00 D) SE anisometropia were excluded from analyses (Table 3). With the notation of Harris,40 subjects included in the minimal anisometropia group had an interocular difference of <0.35 VDD, because it is similar to the interocular difference of <0.25 D SE anisometropia and <0.25 D cylinder anisometropia in the ISO group in clinical notation. Additional details and comparison of methods were provided in a previous publication.48
Table 3.
Criteria Used for Inclusion of Subjects in Analyses of J0/J45 Anisometropia40
| Maximum J0/J45 Anisometropia* | ||
|---|---|---|
| Amount of SE (M) Anisometropia | <0.125 D | ≥0.125 D |
| Categories indicated by blanks were not included in the analyses. | ||
| <0.25 D | Minimal anisometropia | J0/J45 anisometropia |
| 0.25 to <1.00 D | - | J0/J45 anisometropia |
| ≥1.00 D | - | - |
Based on the larger of the J0 and J45 values for each child.
Analyses of Recognition Acuity and SA Results
VA and SA results were transformed to logarithmic values before all analyses. For subjects who were judged unable to resolve the shapes at the largest disparity level (800 seconds of arc) on the SA test, a value of 1600 arc sec was assigned. This value is 0.3 log unit (the interval between levels at the poorer range of the SA test) larger than the largest disparity included on the test. Analyses of variance (ANOVAs) were used to examine VA and SA results as a function of amount of anisometropia, with post hoc analyses corrected for multiple comparisons using Bonferroni correction. χ2 analyses were used to examine amblyopia prevalence as a function of amount of anisometropia, with post hoc analyses corrected using the Bonferroni correction.
RESULTS
Subject Population
Data were excluded from 25 children who had ocular abnormalities, including cataract or pseudophakia (n = 3), traumatic injury (n = 1), strabismus (any heterotropia at distance or near; n = 12), ptosis and other lid abnormalities (n = 5), iris abnormalities (n = 2), conjunctivitis (n = 1), or nystagmus (n = 1). Also excluded from the analyses were children who refused dilating drops (n = 2), had developmental delay (n = 2), had a facial structural abnormality (n = 2), had a history of patching for amblyopia (n = 1), or did not attend the VA testing session (n = 43). These exclusions left a sample of 972.
The estimate of refractive error used in the analyses was based on the retinoscopic confirmation of autorefractor measurements, aided by subjective refinement, when possible. The final estimate of sphere differed by ≤0.50 D from the autorefraction measurement in 97% of right and left eyes, and there was a change in sphere of ≥1.00 D in only three eyes (all left eye measurements, maximum change of 1.50 D). The final estimate of cylinder and axis was the autorefractor measurement in >99% of right and left eyes, and only one eye had a change in cylinder of >1.00 D (1.50 D in left eye). Only one eye had a change in axis of >10° (left eye, 14° change).
Astigmatism of ≥1.00 D was present in one or both eyes in 415 (42.7%) of 972 children, whereas astigmatism of ≥2.00 D was present in one or both eyes in 267 children (27.5% of the population). The axis of astigmatism was with-the-rule (plus cylinder axis ≥60° and ≤120°) in all 362 of the right eyes with ≥1.00 D astigmatism. In left eyes with ≥1.00 D astigmatism, axis was with-the-rule in 351 (99.7%) of 352 and against-the-rule (plus cylinder axis ≤30° or ≥150°) in 1 (0.3%) child. There were no eyes with oblique axis (>30° and <60° or >120° and <150°) astigmatism.
Children who met the criteria for inclusion in the ISO group (Table 2) were slightly older (mean, 8.9 years; SD 2.6) compared with the remaining children in the subject population (mean, 8.4 years; SD 2.4; t(970) = 2.10, P < 0.04).
Anisometropia and Best Corrected IAD
Best corrected monocular acuity results were obtained from both eyes of 969 (99.7%) of the 972 children. The shaded bars in Figure 1 show the mean IAD in children in the ISO group, compared that in the SHA (Fig. 1A), SMA (Fig. 1B), and CA (Fig. 1C) groups, plotted as a function of the amount of anisometropia within each group. In the ISO group (n = 115), the mean IAD was 0.08 log unit (SD 0.093), which is less than 1 logMAR line (0.10 log unit) on the VA chart. ANOVA showed a significant effect of amount of anisometropia in the SHA group (which included only two children with anisometropia ≥2.00 D; F(3,416) = 11.81, P < 0.001) and the CA group (F(6,743) = 9.76, P < 0.001), but not in the SMA group (which included only one child with anisometropia ≥2.00 D). Post hoc analyses comparing each anisometropia subgroup with the ISO group indicated that, within the SHA group, only children with SE anisometropia of ≥1.00 D had significantly greater mean IAD than did the ISO group (P < 0.001). Within the CA group, only children with cylinder anisometropia of ≥3.00 D had significantly greater IAD than did the ISO group (P < 0.001).
FIGURE 1.
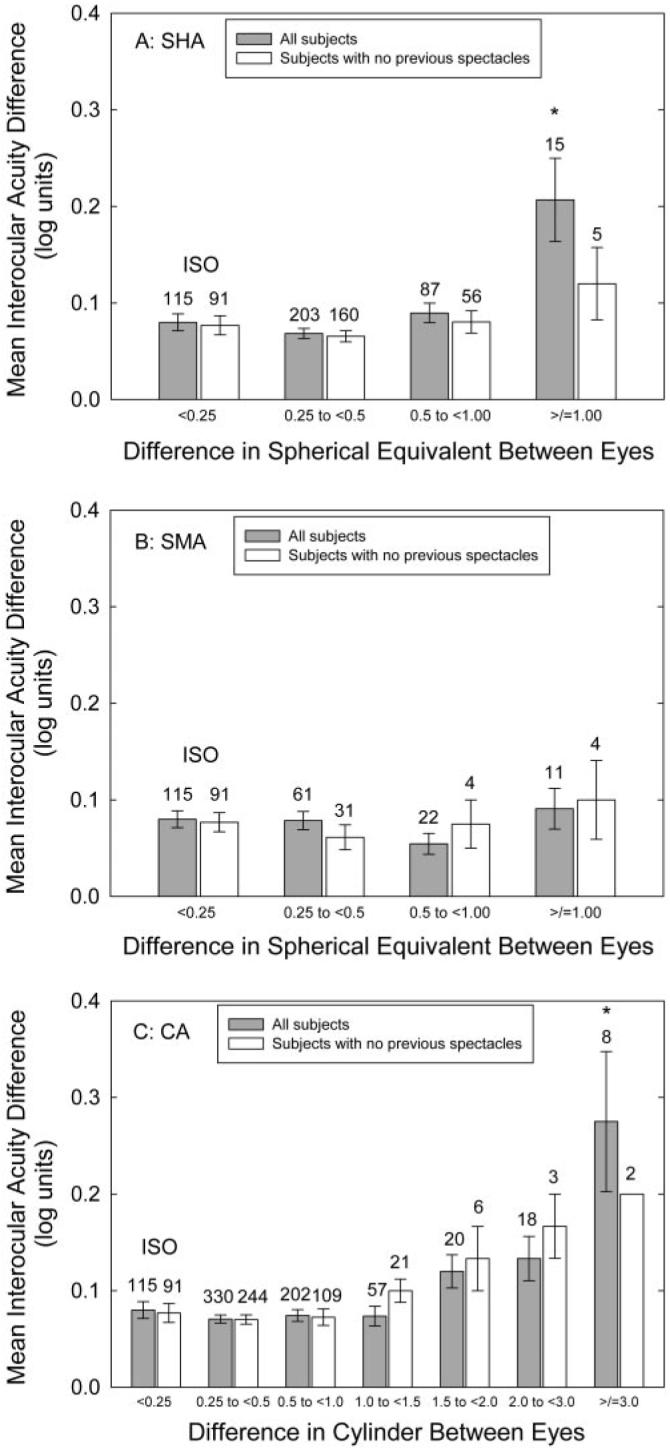
Mean IAD in the children with SHA (A), SMA (B), and CA (C), compared with mean IAD in children in the ISO group. The children in the ISO group had anisometropia <0.25 D SE and <0.25 D cylinder; children in the SHA and SMA groups had cylinder anisometropia <1.00 D, and children in the CA group had SE anisometropia <1.00 D. *Mean IAD in the subgroup was significantly different from that in the ISO group. Bars, 1 SEM.
Figure 2A shows the mean IAD (0.07 log unit; SD 0.086) in the 187 children with minimal anisometropia (difference between eyes <0.25 D spherical equivalent and <0.125 D J0 and J45), compared with mean IAD in the groups of children with J0 and/or J45 anisometropia, plotted as a function of the greater amount of J0 or J45 anisometropia in each child (shaded bars).39 This strategy of plotting the greater amount of J0 or J45 anisometropia is based on the reasonable assumption that a greater power difference between eyes is more likely to be amblyogenic than is a lesser power difference between eyes. Data for M (spherical equivalent) are not included, as these data are shown in Figures 1A and 1B. Although there was an increase in IAD with increasing anisometropia (F(5,743) = 2.49, P < 0.05), post hoc analyses indicated that the increase was slight. That is, there was no single group that differed significantly from the minimal anisometropia group in IAD after correction for multiple comparisons, although the 0.75- to <1.00-D group and the ≥1.00-D group were significantly different from the minimal anisometropia group before correction for multiple comparisons (P = 0.035 and P = 0.016, respectively).
FIGURE 2.

Vector notation results for IAD. (A) Mean IAD in children with various amounts of difference between eyes in refractive error along the horizontal/vertical (J0) and/or the oblique (J45) meridians.39 (B) Mean IAD in children with various amounts of VDD40,49,50 between eyes. *The mean IAD in the subgroup was significantly different from that in the group with minimal difference between eyes (difference <0.25 D M and <0.125 D for J0 and J45; difference <0.35 VDD). Bars, 1 SEM.
Figure 2B shows the mean IAD in children with minimal anisometropia, calculated using the Harris vector notation,40,49,50 compared with the mean IAD in children with greater amounts of VDD between eyes (shaded bars). In the group with minimal anisometropia (n = 257), the mean IAD was 0.068 log unit (SD 0.083). ANOVA showed a significant effect of the amount of anisometropia (F(5,963) = 19.77, P <0.001), and post hoc analyses indicated that mean IAD was significantly greater in the groups with interocular differences of 1.41 to <2.12 VDD (P < 0.01), 2.12 to <2.83 VDD (P < 0.05), and ≥ 2.83 VDD (P < 0.001).
Amblyopia
The proportion of children who had amblyopia, defined as an acuity difference between eyes of ≥2 logMAR lines, is plotted as a function of the amount of anisometropia calculated in clinical notation (Fig. 3), the vector notation of Thibos et al.39 (Fig. 4A), and that of Harris40,49,50 (Fig. 4B). The χ2 analyses on data from all children indicated a significant relation between the prevalence of amblyopia and the amount of anisometropia in the SHA group as a whole (χ2(3) = 33.50, P < 0.001, Fig. 3A), with a significantly greater prevalence of amblyopia in the SHA group with ≥1.00 D difference in SE between eyes (P < 0.01) than in the ISO group. There was no significant relation between the prevalence of amblyopia and the amount of anisometropia in the SMA group. However, there was also a significant relation between the prevalence of amblyopia and the amount of anisometropia in the CA group as a whole (χ2(6) = 45.19, P < 0.001; Fig. 3C), with a significantly greater prevalence of amblyopia in the whole group, amounting to a cylinder difference between eyes of 2.00 D to <3.00 D (P < 0.05) or of ≥3.00 D (P < 0.01) than in the ISO group.
FIGURE 3.

The percentage of children with amblyopia (≥2 logMAR line difference in best corrected acuity between eyes) in the SHA (A), SMA (B), and CA (C) groups, compared with that in the ISO group. *The prevalence of amblyopia in the subgroup was significantly different from that in the ISO group.
FIGURE 4.

Vector notation results for amblyopia. (A) The percentage of children with amblyopia by amount of difference between eyes in refractive error along the horizontal/vertical (J0) and/or the oblique (J45) meridians.39 (B) The percentage of children with amblyopia by amount of VDD40,49,50 between eyes. *The prevalence of amblyopia in the subgroup was significantly different from that in the group with minimal (<0.35 VDD) difference between eyes.
Analysis of vector notation results indicated that, in the whole group of children, there was a significant relation between the prevalence of amblyopia and the amount of anisometropia, when defined in terms of J0/J45 (χ2(5) = 16.28, P < 0.05)39 and VDD (χ2(5) = 47.86, P < 0.001).40,49,50 Post hoc analyses indicated that for J0/J45 (Fig. 4A), there was no single group in which the prevalence of amblyopia was significantly higher in the children with minimal anisometropia. However, for VDD (Fig. 4B), the prevalence of amblyopia was significantly higher in those with 1.41 to <2.12 VDD (P < 0.05) and in those with ≥ 2.83 VDD (P < 0.01) of anisometropia than in those in the minimal anisometropia group.
Anisometropia and Best Corrected SA
Best corrected SA results were obtained from 964 (99.2%) of the 972 children. The shaded bars in Figure 5 show the mean SA in the children in the ISO group, compared with mean IAD in the children in the SHA (Fig. 5A), SMA (Fig. 5B), and CA (Fig. 5C) groups, plotted as a function of the amount of anisometropia within each group. In the ISO group, mean SA was 48.6 arc sec (SD 0.25 log unit). ANOVA showed a significant effect of the amount of anisometropia for the SHA (F(3,413) = 10.06, P < 0.001), the SMA (F(3,204) = 8.91, P < 0.001), and the CA (F(6,740) = 9.96, P < 0.001) groups. Post hoc analyses indicated that, within the SHA group, mean SA was significantly worse in the children with SE anisometropia 0.50 to <1.00 D and the children with SE anisometropia ≥1.00 D (Ps < 0.001) than in the children with minimal anisometropia. Within the SMA group, mean SA was significantly worse in the children with SE anisometropia 0.50 to <1.00 D and in the children with SE anisometropia ≥1.00 D (Ps < 0.01) than in the children with minimal anisometropia. Within the CA group, mean SA was significantly worse in the children with cylinder anisometropia 0.50 to <1.00 D (P < 0.05), 1.00 to <1.50 D (P < 0.001), 1.50 to <2.00 D (P < 0.001), and ≥3.00 D (P < 0.01) than in the children with minimal anisometropia.
FIGURE 5.

Mean SA in SHA (A), SMA (B), and CA (C) groups, compared with that in the ISO group. *The mean SA in the subgroup was significantly different from that in the ISO group. Bars, 1 SEM.
The shaded bars in Figure 6A show the mean SA in the children with minimal anisometropia, compared with that in the children with J0 and/or J45 anisometropia, plotted as a function of the greater amount of J0 or J45 anisometropia in each child.39 In the group with minimal anisometropia, the mean SA was 47.7 arc sec (SD 0.23 log unit). ANOVA showed a significant effect of amount of anisometropia (F(5,743) = 22.97, P < 0.001). Post hoc analyses indicated that the mean SA was significantly worse in the children with J0/J45 anisometropia 0.25 to <0.5D (P < 0.01) and in the children with J0/J45 anisometropia 0.50 to <0.75 D, 0.75 to <1.00 D, and ≥1.00 D (Ps < 0.001).
FIGURE 6.

Vector notation results for SA. (A) The mean SA in the children with various amounts of difference between eyes in refractive error along the horizontal/vertical (J0) and/or the oblique (J45) meridians.39 (B) The mean SA in the children with various amounts of VDD40,49,50 between eyes. *The mean SA in the subgroup was significantly different from that in the group with minimal difference between eyes (difference <0.25 D SE and <0.125 D for J0 and J45, respectively; difference <0.35 VDD for VDD). Bars, 1 SEM.
The shaded bars in Figure 6B show the mean SA in the children with minimal anisometropia compared with that in the children with greater amounts of VDD between eyes.40,49,50 In the group with minimal anisometropia, mean SA was 48.6 arc sec (SD 0.23 log unit). ANOVA showed a significant effect of amount of anisometropia (F(5,958) = 46.42, P < 0.001). Post hoc analyses indicated that the mean SA was significantly worse in the group with interocular differences of 0.71 to <1.41 VDD, 1.41 to <2.12 VDD, 2.12 to <2.83 VDD, and ≥ 2.83 VDD (Ps < 0.001).
Effect of Previous Glasses Wear
Responses on the parental questionnaire concerning previous glasses wear were available for 959 (98.7%) of the 972 study participants. Because glasses wearing alone can reduce amblyopia in children with anisometropia,23,31,35,37 we also examined IAD and SA results for the subset of children whose parents reported no history of glasses wearing. Results, shown by the white bars in Figures 1 to 6, are similar to results for the entire group of children, although samples sizes are small for the groups with larger amounts of anisometropia. ANOVAs showed a significant relation between the amount of anisometropia and the mean IAD in the CA group (F(6,469) = 2.36, P < 0.05) and for calculation of anisometropia in terms of VDD (F(5,608) = 12.04, P < 0.001). ANOVAs showed a significant relation between the amount of anisometropia and SA for all groups: SHA (F(3,307) = 4.41, P < 0.01); SMA (F(3,125) = 10.15, P < 0.001); CA (F(6,468) = 9.39, P < 0.001); J0/J45 (F(5,453) = 16.12, P < 0.001); and VDD (F(5,607) = 28.49, P = 0.001). The χ2 square analyses showed a significant relation between the amount of anisometropia and the prevalence of amblyopia in the CA group (χ2(6) = 24.44, P < 0.001) and for calculation of anisometropia in terms of J0/J45 (χ2(5) = 15.85, P < 0.01) and VDD (χ2(5) = 37.16, P < 0.001).
DISCUSSION
This is the first report of the relation between anisometropia and amblyopia among school-aged members of a Native American tribe with a high prevalence of astigmatism. In agreement with most previous studies,5-20 the results of the present study indicated that there was a significant relation between the amount of anisometropia and interocular differences in VA and between the amount of anisometropia and the presence of amblyopia (defined in the present study as an interocular difference in VA of at least 2 logMAR lines). In addition, as previously reported,6,10,14,16,18-20 amblyopia occurred more frequently and at lower amounts of anisometropia in hyperopic compared with myopic anisometropes.
In the present study, the nonastigmatic, hyperopic children with ≥1.00 D of anisometropia showed significantly increased mean IAD. This result is in agreement with the significant increase in mean IAD shown by patients with >1. 00 D of nonastigmatic hyperopic anisometropia in the only other study that compared the magnitude of IAD in anisometropic and nonanisometropic individuals.18,19 In the present study, the nonastigmatic, myopic children with ≥1.00 D of anisometropia (10/11 of whom had <2.00 D of anisometropia) did not show a significant increase in mean IAD, in comparison with those who had no anisometropia, a result that is in agreement with the previous study's finding that a significant increase in mean IAD occurred only in nonastigmatic myopes who had anisometropia of >2.00 D.18,19 In cylinder anisometropes who do not have SE anisometropia, the previous study showed a significant increase in IAD in patients with >1.50 D of anisometropia.18,19 In contrast, in the present study, although mean IAD was greater in the children with ≥1.50 D of pure cylinder anisometropia than among those in the ISO group (Fig. 1C), this difference did not reach statistical significance until the cylinder anisometropia was ≥3.00 D. The lower threshold for amblyopia in the previous study may have resulted from a bias toward a higher prevalence of VA deficits in their relatively small, patient-based sample (n = 30 with ≥1.50 D of pure cylinder anisometropia; 16 with ≥2.00 D of pure cylinder anisometropia), compared with our larger, school-based sample (n = 46 with ≥1.50 D; 26 with ≥2.00 D of pure cylinder anisometropia).
In addition to examining anisometropia calculated as interocular differences in sphere and cylinder, we examined anisometropia calculated using two vector-based methods.39,40 Unlike traditional methods for calculation of anisometropia, vector-based methods take into account interocular differences in axis as well as interocular differences in cylinder magnitude. The method of Thibos et al.39 calculates interocular differences separately for spherical equivalent (M) and for the Jackson cross-cylinder component (broken into differences along the horizontal/vertical [J0] and oblique [J45] meridians). When we calculated anisometropia in terms of the greater of the two types of meridional differences (J0 versus J45), the magnitude of the IAD (Fig. 2A) and prevalence of amblyopia (Fig. 4A) were both related to the amount of anisometropia. However, there was no threshold value at which mean IAD or prevalence of amblyopia differed significantly from the values in the group with no or minimal anisometropia.
In contrast, when anisometropia was calculated with the Harris vector notation,40,49,50 in which interocular differences are calculated as a single value corresponding to vector difference in three-dimensional space (VDD), results indicated that a significant increase in IAD (Fig. 2B) and a significant increase in the percentage of children with amblyopia (Fig. 4B) occurred at a value of 1.41 VDD. This result is particularly important, because it provides the first data on the magnitude of anisometropia that is a risk factor for amblyopia when anisometropia is calculated with a method that incorporates all three components of refractive error: sphere, cylinder, and axis.
It may seem surprising initially that one vector method showed no significant relation between IAD and the amount of anisometropia, whereas the other vector method did. However, this result is most likely related to the fact that the data plotted for the method of Thibos et al.39 relate only to cylinder and axis anisometropia, whereas the data plotted for the Harris40,49,50 method reflect anisometropia based on sphere, cylinder, and axis values.
In addition to examining IAD and presence of amblyopia as related to magnitude of anisometropia, we also examined best corrected SA as a function of magnitude of anisometropia. The results indicate that, regardless of whether anisometropia is calculated in terms of clinical notation (spherical equivalent and cylinder), or in terms of either of the two vector methods, significantly reduced best corrected SA occurs in individuals with relatively small amounts of anisometropia. Specifically, a significant reduction in mean SA was found with ≥0.50 D of hyperopic, myopic, or cylindrical anisometropia (Fig. 5), a difference between eyes in J0 and/or J45 of ≥0.25 D (Fig. 6A), and a difference between eyes of ≥0.71 VDD (Fig. 6B). Thus, disruption of best corrected SA occurred at levels of anisometropia that were well below those that put an individual at risk for amblyopia (Figs. 3, 4). Furthermore, in contrast to results for IAD and amblyopia (Figs. 1, 3), the magnitude of anisometropia that puts an individual at risk for decreased best corrected SA was identical in the children with hyperopic, myopic, and cylindrical anisometropia (Fig. 5).
The SA results of the present study differ substantially from those of the only other study that compared best corrected SA in anisometropes and nonanisometropes.18,19 In that study, the amount of anisometropia that resulted in decreased best corrected SA was identical with the amount of anisometropia that produced an increase in mean IAD and in prevalence of amblyopia. An important difference between the two studies is that in the present study, SA was measured with a random-dot test (Randot Preschool Stereoacuity Test; Stereo Optics, Inc.), which is free of monocular cues, whereas the previous study used the Titmus stereo test, a non-random-dot test that includes monocular cues that can improve an individual's ability to detect stereo targets, thereby reducing detection of binocular SA deficits.
This study has a number of strengths. First, it is a large, school-based study, in which approximately 85% of children in grades K-2 and 4 to 6 in schools on the Tohono O'odham reservation were enrolled. Second, the population includes a high percentage of children with high astigmatism (42.7% of the 972 children in the study had astigmatism of ≥1.00 D in one or both eyes; 27.5% had astigmatism of ≥2.00 D), which allowed detailed analysis of the effect of astigmatic anisometropia on prevalence of amblyopia and decreased SA. Third, measurement of refractive error was conducted with cycloplegia and followed a rigorous protocol that included measurement with an unbiased, objective instrument (the Retinomax autorefractor; Righton Manufacturing Co.), followed by verification of autorefractor measurements by retinoscopy and, when possible, by subjective refinement. Fourth, best corrected VA was measured with ETDRS charts, which contain logMAR spacing of optotypes and are the gold standard for assessment of VA in clinical studies of adults.46 Fifth, best corrected SA was measured with a random dot SA test,51 which is free of the monocular cues present in non-random-dot stereo tests. Sixth, the subject population included a substantial number of children who had little or no anisometropia, which provided isometropic baseline data concerning IAD, SA, and prevalence of amblyopia in the absence of anisometropia. Seventh, all subjects, even those who did not meet the criteria for prescription of spectacle correction, were tested while wearing glasses providing the best correction. This masked the adults who tested VA and SA from knowing which children had significant refractive error and made testing conditions (wearing of spectacles) equal for all subjects.
A final strength is that the present study provides the first large-sample data relating vector-method calculation of anisometropia to data on IAD, SA, and presence of amblyopia. Because vector methods include cylinder axis in calculations of anisometropia, they provide a more complete description of interocular differences in refractive error than do traditional clinical notation techniques that focus on differences in sphere, spherical equivalent, and/or cylinder. The present results provide the first data indicating the magnitude of vector differences that put children at risk for amblyopia and/or decreased SA.
Despite its strengths, the present study has limitations. First, many of the subjects, especially those with higher amounts of anisometropia, had a history of spectacle wear. Because as little as 12 weeks of spectacle wear can reduce or eliminate amblyopia,23,31,35,37 it is possible that the prevalence of amblyopia was underestimated and the amount of anisometropia needed to produce amblyopia was overestimated because of the children's previous glasses wear. However, as shown by the white bars in Figures 1 to 6, results for only those children who had no history of glasses wear were similar to those for the group as a whole, although sample sizes of non-glasses-wearing children were small at higher values of anisometropia, which weakens the meaningfulness of these data. In addition, no data were available concerning the children's compliance with glasses wearing, and therefore, it is possible that the similarity of results of the children with no history of glasses wear to the results of the group as a whole relate to poor compliance with glasses wear.43
A second limitation relates to likely differences in the variability of recognition acuity versus SA results, which may have contributed to the lesser sensitivity of IAD than of SA to the amount of anisometropia. For recognition acuity testing, children were required to identify all visible letters on the ETDRS chart: first with the right eye, then with the left eye. This procedure took approximately 5 to 10 minutes per child and may have led to inattentiveness, resulting in variability in acuity results. In contrast, the SA test involved binocular testing that required children to identify pictures in six sets of four-plate combinations and could be completed quickly, perhaps resulting in more consistent results for the ISO group than were obtained with recognition acuity testing.
A third limitation is the absence of against-the-rule and oblique axis astigmatism in the subject population. Thus, any conclusions about the effects of astigmatic anisometropia may be applicable only to individuals who have with-the-rule axis orientation in both eyes.
A final limitation is the relatively small number of subjects with myopic anisometropia ≥1.00 D. As a result, we were unable to determine the minimum amount of myopic anisometropia that was associated with significantly increased IAD and amblyopia. However, it was possible to determine the minimum amount of myopic anisometropia that was associated with reduced best corrected SA in this group.
In conclusion, the present study provides data from a school-based population on the amount of interocular refractive error difference that is associated with a significant increase in interocular best corrected recognition acuity difference, and in a reduction in best corrected acuity for random dot stereograms. Results indicate that an increase in interocular difference in best corrected recognition acuity is related to both the amount and the type of refractive error difference between eyes. In addition, for all methods of calculating interocular differences in refractive error, disruption of best corrected random dot SA occurs with smaller interocular refractive error differences than those producing an increase in interocular best corrected recognition acuity differences, suggesting that development of SA is particularly dependent on similarity in refractive error between fellow eyes. Additional research is needed to determine the effect of early and consistent glasses correction on the relation between the amount of anisometropia and best corrected recognition acuity and SA in the school-aged child.
Acknowledgments
The authors thank the Tohono O'odham Nation, the Indian Oasis/Baboquivari School District, the Bureau of Indian Affairs Office of Indian Education Programs (BIA OIEP, Papago/Pima Agency), the San Xavier Mission School, the parents and children who participated in the study, and our NIH/NEI Data Monitoring and Oversight Committee (Maureen Maguire, PhD [former chair], Robert Hardy, PhD [current chair], Morgan Ashley, Donald Everett, MA, Jonathan Holmes, MD, Cynthia Norris, and Karla Zadnik, OD, PhD).
Supported by National Eye Institute Grant EY13153 (EMH), unrestricted funds from Research to Prevent Blindness to the University of Arizona Department of Ophthalmology and Vision Science (JMM), and a Career Development Award from Research to Prevent Blindness (EMH).
Footnotes
Disclosure: V. Dobson, None; J.M. Miller, None; C.E. Clifford-Donaldson, None; E.M. Harvey, None
The publication costs of this article were defrayed in part by page charge payment. This article must therefore be marked “advertisement” in accordance with 18 U.S.C. §1734 solely to indicate this fact.
References
- 1.American Academy of Ophthalmology Pediatric Ophthalmology/Strabismus Panel . Preferred Practice Pattern Guidelines. Amblyopia. American Academy of Ophthalmology; San Francisco: 2007. [Google Scholar]
- 2.American Optometric Association . Optometric Clinical Practice Guideline. Care of the Patient with Amblyopia. American Optometric Association; St. Louis: 2004. [Google Scholar]
- 3.Donahue SP, Arnold RW, Ruben JB, AAPOS Vision Screening Committee Preschool vision screening: what should we be detecting and how should we report it?— uniform guidelines for reporting results of preschool vision screening studies. J AAPOS. 2003;7:314–316. doi: 10.1016/s1091-8531(03)00182-4. [DOI] [PubMed] [Google Scholar]
- 4.Gerali PS, Flom MC, Raab EL. Report of the Children's Vision Screening Task Force. National Society to Prevent Blindness; Schaumburg, IL: 1990. [Google Scholar]
- 5.Caputo R, Frosini R, De Libero C, Campa L, Del Magro EF, Secci J. Factors influencing severity of and recovery from anisometropic amblyopia. Strabismus. 2007;15:209–214. doi: 10.1080/09273970701669983. [DOI] [PubMed] [Google Scholar]
- 6.Copps LA. Vision in anisometropia. Am J Ophthalmol. 1944;27:641–644. [Google Scholar]
- 7.de Vries J. Anisometropia in children: analysis of a hospital population. Br J Ophthalmol. 1985;69:504–507. doi: 10.1136/bjo.69.7.504. [DOI] [PMC free article] [PubMed] [Google Scholar]
- 8.Doležalová V. Beziehung der Anisometropie zum Grad der Amblyopie. Klin Monatsbl Augenheilkd. 1974;164:382–385. [PubMed] [Google Scholar]
- 9.Gupta SD, Scood SC, Jain IS. Anisometropia and amblyopia in straight eyes. Indian J Ophthalmol. 1973;21:59–62. [PubMed] [Google Scholar]
- 10.Jampolsky A, Flom BC, Weymouth FW, Moses LE. Unequal corrected visual acuity as related to anisometropia. Arch Ophthalmol. 1955;54:893–905. doi: 10.1001/archopht.1955.00930020899013. [DOI] [PubMed] [Google Scholar]
- 11.Kivlin JD, Flynn JT. Therapy of anisometropic amblyopia. J Pediatr Ophthalmol Strabismus. 1981;18:47–56. doi: 10.3928/0191-3913-19810901-12. [DOI] [PubMed] [Google Scholar]
- 12.Ingram RM. Refraction as a basis for screening children for squint and amblyopia. Br J Ophthalmol. 1977;61:8–15. doi: 10.1136/bjo.61.1.8. [DOI] [PMC free article] [PubMed] [Google Scholar]
- 13.Leon A, Donahue SP, Morrison DG, Estes RL, Li C. The age-dependent effect of anisometropia magnitude on anisometropic amblyopia severity. J AAPOS. 2008;12(2):150–156. doi: 10.1016/j.jaapos.2007.10.003. [DOI] [PubMed] [Google Scholar]
- 14.Rutstein RP, Corliss D. Relationship between anisometropia, amblyopia, and binocularity. Optom Vis Sci. 1999;76:229–233. doi: 10.1097/00006324-199904000-00026. [DOI] [PubMed] [Google Scholar]
- 15.Sen DK. Anisometropic amblyopia. J Pediatr Ophthalmol Strabismus. 1980;17:180–184. doi: 10.3928/0191-3913-19800501-13. [DOI] [PubMed] [Google Scholar]
- 16.Tanlamai T, Goss DA. Prevalence of monocular amblyopia among anisometropes. Am J Optom Physiol Opt. 1979;56:704–715. doi: 10.1097/00006324-197911000-00006. [DOI] [PubMed] [Google Scholar]
- 17.Townshend AM, Holmes JM, Evans LS. Depth of anisometropic amblyopia and difference in refraction. Am J Ophthalmol. 1993;116:431–436. doi: 10.1016/s0002-9394(14)71400-x. [DOI] [PubMed] [Google Scholar]
- 18.Weakley DR. The association between anisometropia, amblyopia, and binocularity in the absence of strabismus. Trans Am Ophthalmol Soc. 1999;97:987–1021. [PMC free article] [PubMed] [Google Scholar]
- 19.Weakley DR. The association between nonstrabismic anisometropia, amblyopia, and subnormal binocularity. Ophthalmology. 2001;108:163–171. doi: 10.1016/s0161-6420(00)00425-5. [DOI] [PubMed] [Google Scholar]
- 20.Zaka-Ur-Rab S. Evaluation of relationship of ocular parameters and depth of anisometropic amblyopia with the degree of anisometropia. Indian J Ophthalmol. 2006;54:99–103. doi: 10.4103/0301-4738.25830. [DOI] [PubMed] [Google Scholar]
- 21.Amorim Garcia CA, Araújo E, Souza AB, Uchoa RAC, Oréfice F. Epidemiologic study of anisometropia in students of Natal (in Portuguese) Brazil Arq Bras Oftalmol. 2005;68:75–77. doi: 10.1590/s0004-27492005000100013. [DOI] [PubMed] [Google Scholar]
- 22.Blum HL, Peters HB, Bettman JW, Fellows V, Jr, Johnson F. Design and evaluation of a vision screening program for elementary school children. Am J Public Health. 1959;49:1670–1681. doi: 10.2105/ajph.49.12.1670. [DOI] [PMC free article] [PubMed] [Google Scholar]
- 23.Chen PL, Chen JT, Tai MC, Fu JJ, Chang CC, Lu DW. Anisometropic amblyopia treated with spectacle correction alone: possible factors predicting success and time to start patching. Am J Ophthalmol. 2007;143:54–60. doi: 10.1016/j.ajo.2006.09.027. [DOI] [PubMed] [Google Scholar]
- 24.Cobb CJ, Russell K, Cox A, MacEwen CJ. Factors influencing visual outcome in anisometropic amblyopes. Br J Ophthalmol. 2002;86:1278–1281. doi: 10.1136/bjo.86.11.1278. [DOI] [PMC free article] [PubMed] [Google Scholar]
- 25.Donahue SP. Relationship between anisometropia, patient age, and the development of amblyopia. Am J Ophthalmol. 2006;142:132–140. doi: 10.1016/j.ajo.2006.02.040. [DOI] [PubMed] [Google Scholar]
- 26.Donnelly UM, Stewart NM, Hollinger M. Prevalence and outcomes of childhood visual disorders. Ophthalmic Epidemiol. 2005;12:243–250. doi: 10.1080/09286580590967772. [DOI] [PubMed] [Google Scholar]
- 27.Grönlund MA, Andersson S, Aring E, Hård AL, Hellström Ophthalmological findings in a sample of Swedish children aged 4-15 years. Acta Ophthalmol Scand. 2006;84:169–176. doi: 10.1111/j.1600-0420.2005.00615.x. [DOI] [PubMed] [Google Scholar]
- 28.Hardman Lea SJ, Loades J, Rubinstein MP. The sensitive period for anisometropic amblyopia. Eye. 1989;3:783–790. doi: 10.1038/eye.1989.122. [DOI] [PubMed] [Google Scholar]
- 29.Lithander J. Prevalence of amblyopia with anisometropia or strabismus among schoolchildren in the Sultanate of Oman. Acta Ophthalmol Scand. 1998;76:658–662. doi: 10.1034/j.1600-0420.1998.760604.x. [DOI] [PubMed] [Google Scholar]
- 30.MacDiarmid JDC, Waterhouse PF. Amblyopia associated with anisometropic hypermetropia. Trans Ophthalmol Soc NZ. 1974;25:39–42. [PubMed] [Google Scholar]
- 31.Pediatric Eye Disease Investigator Group Treatment of anisometropic amblyopia in children with refractive correction. Ophthalmology. 2006;113:895–903. doi: 10.1016/j.ophtha.2006.01.068. [DOI] [PMC free article] [PubMed] [Google Scholar]
- 32.Robaei D, Rose K, Ojaimi E, Kifley A, Huynh S, Mitchell P. Visual acuity and the causes of visual loss in a population-based sample of 6-year-old Australian children. Ophthalmology. 2005;112:1275–1282. doi: 10.1016/j.ophtha.2005.01.052. [DOI] [PubMed] [Google Scholar]
- 33.Robaei D, Kifley A, Rose KA, Mitchell P. Impact of amblyopia on vision at age 12 years: findings from a population-based study. Eye. 2008;22(4):496–502. doi: 10.1038/sj.eye.6702668. [DOI] [PubMed] [Google Scholar]
- 34.Robinson J. Simple anisometropia and amblyopia. Br Orthopt J. 1961;18:13–26. [Google Scholar]
- 35.Stewart CE, Moseley MJ, Fielder AR, Stephens DA, MOTAS cooperative Refractive adaptation in amblyopia: quantification of effect and implications for practice. Br J Ophthalmol. 2004;88:1552–1556. doi: 10.1136/bjo.2004.044214. [DOI] [PMC free article] [PubMed] [Google Scholar]
- 36.Vision in Preschoolers Study Group Comparison of preschool vision screening tests as administered by licensed eye care professionals in the Vision in Preschoolers (VIP) study. Ophthalmology. 2004;111:637–650. doi: 10.1016/j.ophtha.2004.01.022. [DOI] [PubMed] [Google Scholar]
- 37.Cotter SA, Edwards AR, Arnold RW, et al. Pediatric Eye Disease Investigator Group Treatment of strabismic amblyopia with refractive correction. Am J Ophthalmol. 2006;143:1060–1063. doi: 10.1016/j.ajo.2007.02.029. [DOI] [PMC free article] [PubMed] [Google Scholar]
- 38.Safir A, Kulikowski CA. Problems in the evaluation of data. Trans Am Acad Ophthalmol Otolaryngol. 1975;79:OP488–OP492. [PubMed] [Google Scholar]
- 39.Thibos LN, Wheeler W, Horner D. Power vectors: an application of Fourier analysis to the description and statistical analysis of refractive error. Optom Vis Sci. 1997;74:367–375. doi: 10.1097/00006324-199706000-00019. [DOI] [PubMed] [Google Scholar]
- 40.Harris WF. The mean and variance of samples of dioptric powers: the basic calculations. Clin Exp Optom. 1990;73:89–92. [Google Scholar]
- 41.Dobson V, Miller JM, Harvey EM. Corneal and refractive astigmatism in a sample of 3- to 5-year-old children with a high prevalence of astigmatism. Optom Vis Sci. 1999;76:855–860. doi: 10.1097/00006324-199912000-00022. [DOI] [PubMed] [Google Scholar]
- 42.Dobson V, Miller JM, Harvey EM, Sherrill DL. Vision Science and Its Applications, OSA Technical Digest. Optical Society of America; Washington, DC: 1999. Prevalence of astigmatism, astigmatic anisometropia, and glasses wearing among preschool- and school-age Native American children; pp. 177–180. [Google Scholar]
- 43.Harvey EM, Dobson V, Miller JM. Prevalence of high astigmatism, eyeglass wear, and poor visual acuity among Native American grade-school children. Optom Vis Sci. 2006;83:206–212. doi: 10.1097/01.opx.0000214333.84822.71. [DOI] [PubMed] [Google Scholar]
- 44.Harvey EM, Dobson V, Miller JM, Clifford-Donaldson CE. Optical treatment of amblyopia in astigmatic children: the sensitive period for successful treatment. Ophthalmology. 2007;114:2293–2301. doi: 10.1016/j.ophtha.2007.03.021. [DOI] [PubMed] [Google Scholar]
- 45.Harvey EM, Dobson V, Miller JM, Clifford-Donaldson CE. Changes in visual function following optical treatment of astigmatism-related amblyopia. Vision Res. 2008;48(6):773–787. doi: 10.1016/j.visres.2007.12.007. [DOI] [PMC free article] [PubMed] [Google Scholar]
- 46.Ferris FL, Kassoff A, Bresnick GH, Bailey I. New visual acuity charts for clinical research. Am J Ophthalmol. 1982;94:91–96. [PubMed] [Google Scholar]
- 47.Harvey EM, Dobson V, Miller JM, Clifford-Donaldson CE. Amblyopia in astigmatic children: patterns of deficits. Vision Res. 2007;47:315–326. doi: 10.1016/j.visres.2006.11.008. [DOI] [PMC free article] [PubMed] [Google Scholar]
- 48.Dobson V, Harvey EM, Miller JM, Clifford-Donaldson CE. Anisometropia prevalence in a highly astigmatic school-aged population. Optom Vis Sci. 2008;85(7):512–519. doi: 10.1097/OPX.0b013e31817c930b. [DOI] [PMC free article] [PubMed] [Google Scholar]
- 49.Harvey EM, Miller JM, Dobson V, Tyszko R, Davis AL. Measurement of refractive error in Native American preschoolers: validity and reproducibility of autorefraction. Optom Vis Sci. 2000;77:140–149. doi: 10.1097/00006324-200003000-00013. [DOI] [PubMed] [Google Scholar]
- 50.Long WF. A matrix formalism for decentration problems. Am J Optom Physiol Opt. 1976;53:27–33. doi: 10.1097/00006324-197601000-00005. [DOI] [PubMed] [Google Scholar]
- 51.Birch E, Williams C, Hunter J, Lapa MC, ALSPAC “Children in Focus” Study Team Random dot SA of preschool children. J Pediatr Ophthalmol Strabismus. 1997;34:217–222. doi: 10.3928/0191-3913-19970701-08. [DOI] [PubMed] [Google Scholar]