Abstract
A giant magnetoresistive (GMR) biochip based on spin valve sensor array and magnetic nanoparticle labels was developed for inexpensive, sensitive and reliable DNA detection. The DNA targets detected in this experiment were PCR products amplified from Human Papillomavirus (HPV) plasmids. The concentrations of the target DNA after PCR were around 10 nM in most cases, but concentrations of 10 pM were also detectable, which is demonstrated by experiments with artificial DNA samples. A mild but highly specific surface chemistry was used for probe oligonucleotide immobilization. Double modulation technique was used for signal detection in order to reduce the 1/f noise in the sensor. Twelve assays were performed with an accuracy of approximately 90%. Magnetic signals were consistent with particle coverage data measured with Scanning Electron Microscopy. More recent research on microfluidics showed the potential of reducing the assay time below one hour. This is the first demonstration of magnetic DNA detection using plasmid-derived samples. This study provides a direct proof that GMR sensors can be used for biomedical applications.
Keywords: GMR, giant magnetoresistive biosensor, DNA microarray, Human Papillomavirus genotyping
1. Introduction
In recent years magnetic devices like giant magnetoresistive (GMR) sensors (Baibich, et al, 1988; Grünberg, et al, 1987) have shown a great potential as sensing elements for biomolecule detection (Baselt, et al, 1998; Li, et al, 2006; Ferreira, et al, 2005; Schotter et al, 2002). The resistance of a GMR sensor changes with the magnetic field applied to the sensor, so a magnetically labeled biomolecule can induce a signal. Compared with the traditional optical detection now widely used in biomedicine, GMR sensors are more sensitive, portable and give a fully electronic readout (Schotter, et al, 2004). In addition, GMR sensor is inexpensive and the fabrication is compatible with the current VLSI (Very Large Scale Integration) technology, so GMR sensors can be easily integrated with electronics and microfluidics to detect many different analytes on a single chip.
Most reports on GMR biosensors to date, however, have only shown the detection of magnetic particles without analytes or the detection of synthetic analytes in solutions without impurities (Baselt, et al, 1998; Li, et al, 2006; Ferreira, et al, 2005; Schotter et al, 2002). In real biomedical applications the sample can be quite complex and impurities can introduce serious interferences. In this article, we demonstrate a more practical detection scenario: Human Papillomavirus (HPV) genotyping. The target samples we used were PCR products amplified from cloned plasmid HPV DNA with the conserved sequence primer system GP5+/6+ (Roda Husman, et al, 1995). These samples better approximate real biomedical samples and therefore give a direct test case to demonstrate if GMR sensors are suitable for biomedical applications.
HPV is a subset of Papillomaviruses that infects the epithelial cells of the skin and mucus membranes in humans. Infection with HPV is associated with various forms of cancers, including cervical cancer (Doorbar, 2006). Cervical cancer is one of the most common forms of cancer in women worldwide, second only to breast cancer. In 2007, 11,150 new cases of cervical cancer are predicted to be diagnosed in US and in that same year 3,670 women are predicted to die from this disease (American Cancer Society, 2007). Based on the oncogenic potential, HPV genotypes are classified as “high-risk” or “low-risk” subtypes (Villiers, et al, 2004). Diagnosis of HPV infection and evaluation of its potential to form cancer thus relies on the genotyping of the patient’s HPV infection. Our experiment shows that GMR sensors, together with the proper biochemistry, can accurately detect the presence of multiple types of HPV DNA in one sample, and thus is a good candidate for clinical applications including HPV genotyping.
2. Materials and methods
1. Sensor
The Giant Magnetoresistive (GMR) sensor used in our experiment has a bottom spin valve structure: Si/Ta(5)/seed layer/IrMn(8)/CoFe(2)/Ru/(0.8)/CoFe(2)/Cu(2.3)/CoFe(1.5)/Ta(3), all numbers in parenthesis are in nanometers. Each chip has 32 pairs of GMR sensors, which are connected to the bonding pads on the peripheral by a 300nm thick Ta/Au/Ta lead. Each sensor consists of 32 spin valve strips in serial connection. Each strip has an electrical-active area of 93µm × 1.5µm. To protect the sensors and leads from corrosion, two passivation layers were deposited by ion beam sputtering: first, a thin passivation layer of SiO2(10nm)/Si3N4(20nm)/SiO2(10nm) was deposited above all sensors and leads, exposing only the bonding pad area; second a thick passivation layer of SiO2(100nm)/Si3N4(150nm)/SiO2(100nm) was deposited on top of the reference sensors and leads, exposing the active sensors and bonding pad area. In the absence of an applied field, the total resistance of one sensor is about 35kOhm. The magnetoresistive ratio is 12% after patterning. The pinning direction of the spin valve is in-plane perpendicular to the sensor strip. The easy axis of the free layer is set by the shape anisotropy to be parallel with the sensor strip. This configuration allows the GMR sensors to work at the most sensitive region of their MR transfer curves. In this experiment, only 4 sensor pairs from each chip were selected for measurement due to the limited number of multiplex channels of the off-chip electronics. In future all 32 pairs will be measured with the next generation electronics.
Due to the GMR effect, the following equation describes how the resistance of the sensor changes with the orientation of the magnetization of the two magnetic layers separated by a copper spacer layer (Li and Wang, 2003):
Where R0 is the resistance under zero magnetic field, δRmax is the maximum resistance change and θ is the angle between the magnetization of the two magnetic layers. In the bottom spin valve structure, the magnetization of bottom magnetic layer (pinned layer) is pinned to a fixed direction, while the magnetization of the top magnetic layer (free layer) can freely rotate with the external magnetic field. As a result, the stray field from the magnetic label can change the magnetization of the free layer and therefore change the resistance of the sensor.
2. Probe and target DNA
Oligonucleotides used in the assay were the conserved primer pair GP5+/6+ (Roda Husman, et al, 1995) and sequencing/hybridization probes MSP-16, -18, -33, and -45 (Gharizadeh, et al, 2006). The probes were produced by IDT technologies (Coralville, IA). HPV plasmids for HPV-16, -18, and -45 were kindly provided by Dr. E. M. de Villiers (DKFZ; Heidelberg, Germany); and HPV plasmid HPV-33 by Dr. M. Favre (Institute Pasteur; Paris, France).
A 2-step GP5+/6+ PCR amplification was performed to create single strand DNA amplicons from the HPV plasmid DNA. The initial PCR-step consisted of total reaction volumes of 50 µl, containing 200 ng HPV plamid DNA, 1X PCR Buffer II (Applied Biosystems, Foster City, CA), 2.5 mM MgCl2 (Applied Biosystems, Foster City, CA), 0.12 mM dNTPs (Fermentas, Hanover, MD), 2.5 units AmpliTaq Gold DNA polymerase (Applied Biosystems, Foster City, CA) and 0.2 µM of each primer GP5+ and biotinylated GP6+. A 10-minute incubation step at 95 °C was followed by touchdown PCR amplification with a thermocycler GeneAmp PCR system 9700 (Applied Biosystems, Foster City, CA). The initial 7 cycles included a denaturation step at 95°C for 45 seconds and an annealing step at 52 °C for 30 seconds with a −1 °C decrease per cycle. For the remaining 33 cycles annealing was performed at 48 °C. A final extension was done at 72 °C for 5 minutes. The second PCR-step was performed as above with the following exceptions: HPV plasmid DNA was replaced by 1 µl product from the initial PCR-step, and only 0.2 µM of biotinylated primer GP6+ was used. Thermocycling was performed on the same system described above as follows: a 10 minute incubation step at 95 °C was followed by 40 cycles of amplification, with each cycle including a denaturation step at 95 °C for 45 seconds and an annealing step at 48°C for 30 seconds; a final extension was done at 72 °C for 5 minutes. Post-PCR cleanup was performed using a Micro Bio-Spin chromatography column Bio-Gel P-3-30 (Bio-Rad, Hercules, CA), according to company instructions. Amplicon quantification was performed using a ND-100 Spectrophotometer (NanoDrop, Wilmington, DE), and were calculated to approximately 10 nM.
Pyrosequencing was used for sequence verification of HPV plasmid DNA amplicons. Template preparation was performed as previously described (Gharizadeh, et al, 2006). GP5+ and Sentinel-base sequencing primers (Gharizadeh, et al, 2006) were used in parallel to sequence all HPV plasmid DNA amplicons. Pyrosequencing was performed with a cyclic de novo sequencing dispensation (ACGT) using a PSQTM HS96A DNA sequencing system (Biotage, Uppsala, Sweden).
3. Magnetic label
The magnetic labels we used are commercial particles from Miltenyi Biotech Inc. referred to as “MACS”. Each MACS particle is a cluster of 10nm Fe2O3 nanoparticles held together by a matrix of dextran. Due to the small size of the Fe2O3 nanoparticles, the MACS particle is superparamagnetic, with an overall diameter of around 50nm and containing ~10% magnetic material. The MACS particle is functionalized with streptavidin molecules so it can be attached to the biotin end of the target DNA.
4. Biochemistry procedure
The GMR sensors were coated with a layer of polyallylamine during the fabrication process. A layer of partially hydrolyzed polyethylene-maleic anhydride (polyacid) was coated on top of the polyallylamine layer by exposing the sensor chip to an aqueous polyacid solution. The chip was then heated at 100 °C for one hour to cyclize maleic acid groups. This step crosslinked and strengthened the underlying polyallylamine layer and provided functional groups to covalently couple probe oligonucleotides. Finally the oligonucleotide probes bearing amino groups were spotted onto the activated sensors and incubated overnight; the immobilization process finished after the surface was blocked with aminoethanol and the chip was ready for hybridization.
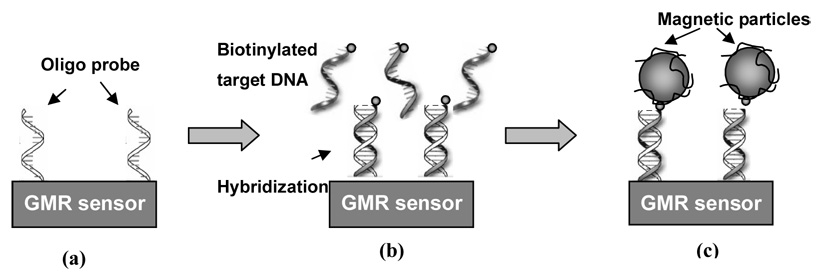
We used a reverse hybridization method (Kleter, et al, 1999) for HPV DNA detection. The experiment cycle is shown in Figure 1. The oligonucleotide probes were immobilized on the GMR sensor surface using the chemistry described above (Fig 1a). On each chip, we spotted 4 different probes onto the surface of four different sensors, corresponding to HPV16, 18, 33 and 45 strains. The target HPV DNA was then hybridized to the probe (Fig 1b) by dispersing the sample containing the target HPV DNA onto the sensors and incubating with agitation for 8 hours. If the sample contained HPV16, 18, 33 or 45, the corresponding DNA was hybridized and attached to the sensor surface. Non-matching DNA was washed away by phosphate buffer solution (PBS). In the last step, the sensor, with the hybridized HPV DNA on the surface, was put in the measurement system for real-time measurement while applying streptavidin functionalized MACS to the sensor. The streptavidin molecule bound to the biotin group on the end of the hybridized HPV DNA and the magnetic signal generated by MACS was detected by the GMR sensor (Fig 1c).
Figure 1. Experiment Cycle.
(a) The oligonucleotide probe was immobilized on the GMR sensor surface. (b) Target sample containing the HPV DNAs was applied to the sensor. Complementary DNAs were hybridized and stayed on the sensor surface. Non-complementary DNAs were washed away. (c) Solution containing magnetic particles was applied to the sensor. The streptavidin molecules on the magnetic particles bound to the biotin group on the free end of the double stranded DNA on the sensor surface.
5. Magnetic Signal Detection Procedure
We used a “double-modulation” technique for signal detection (Han, et al, 2006). During measurement, a DC magnetic field of 50 Oe was applied along the long axis of the sensor strip, i.e., the easy axis of the free layer, to bias the sensor to the single domain regime. An AC field (208 Hz, 71 Oe rms) was also applied perpendicular to the long axis of the sensor stripe in the sensor plane to excite the signal. An AC current with a peak magnitude of 15 uA and a frequency of 500 Hz was passed through the sensors. As a result, the voltage signal of a sensor contains 4 peaks in the frequency domain: one peak at 208 Hz from electromagnetic interference, one peak at 500 Hz from the sensing current and the static part of the sensor resistance ( R0 ), and two peaks at 292 Hz and 708 Hz due to the signal mixing between the sensing current (500 Hz) and the varying part of the sensor resistance (208 Hz). When the magnetic labels are bound to the sensor surface, their stray field reduces the AC field sensed by the sensor, and therefore reduces the peaks at 292 Hz and 708 Hz. We chose to monitor the peak at 708 Hz because it is less affected by 1/f noise. The voltage signals of two adjacent sensors on the same chip, one of them spotted with probe oligonucleotides (active sensor) and the other one not spotted (reference sensor), were fed into a differential amplifier, so that the common mode interference was eliminated. The amplified signal was then fed into a multiplexer for readout. Through this double-modulation technique, we were able to modulate the signal at a relatively high frequency to reduce the 1/f noise without being hampered by the electromagnetic interference.
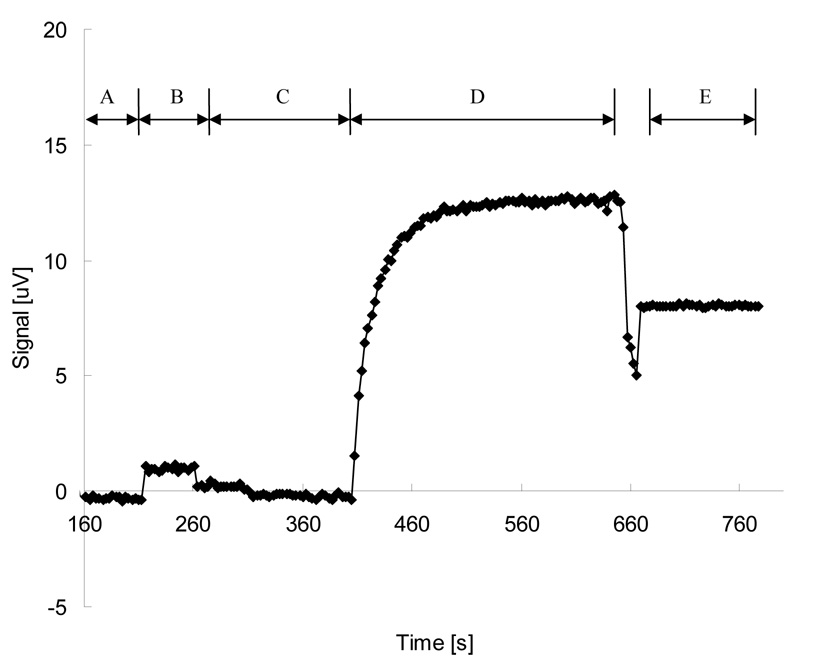
A typical magnetic measurement cycle and the corresponding signal curve is shown in Figure 2. First, a chip coated with oligonucleotide probes and hybridized with target DNAs was placed in the measurement system (Fig 2, A). Phosphate buffer solution (PBS, pH 7.2) was applied to the chip surface for 20–30 seconds (Fig 2, B). The PBS solution was then removed by a vacuum pump and the system was left in dry condition for 60–90 seconds (Fig 2, C). PBS solution containing MACS was then dispersed onto the chip and allowed to incubate until the signal saturated, which usually took 4–5 minutes (Fig 2, D). Finally the PBS solution containing MACS was removed and the chip was rinsed briefly with deionized water and dried with a vacuum pump (Fig 2, interim between D and E). The chip was left in dry condition again for 1 minute to get the final dry signal level (Fig 2, E).
Figure 2. A typical measurement cycle and signal curve.
(A) The chip was placed in the measurement setup and signal was recorded to establish a base signal level. (B) Phosphate buffer solution (PBS, pH 7.2) was applied to measure the “water level” of the sensor. (C) PBS was removed and the chip was left in dry condition. (D) The MACS particles were added to the chip. (Interim between D and E) The chip was rinsed with DI water and dried. (E) The chip was left in dry condition to measure the final signal level.
The initial wash with PBS is of particular importance. A GMR sensor covered by PBS solution shows a different base signal level than that of a dry one. The difference of voltage signals between wet condition and dry condition was referred to as the “water level”. The water level varies across different sensors, usually on the order of 1–5 µV. An initial wash with PBS allows one to measure the magnitude of the chip’s water level, so that it can be subtracted from the total signal to get the net signal generated by the MACS particles. Many factors can contribute to the water level, including temperature change and the conductivity of the PBS solution.
3. Results and discussion
Our experiment was performed in two phases: first, the repeated detection of one HPV sample to test the consistency of the GMR sensor; second, the detection of a set of different HPV samples to demonstrate the GMR sensor’s reliability. All experiments were “blinded”, i.e. the experimenter measuring magnetic signals was unaware if the target(s) was/were present in the sample. The results from magnetic measurements were compared with the results from pyrosequencing afterwards (Table 1).
Table 1.
Net signal of twelve assays for four samples.
| Phase | Sample No. (HPV subtypes in the sample) | Chip No. | Signal, in µV (positive signals in bold*) | |||
|---|---|---|---|---|---|---|
| HPV16 | HPV18 | HPV33 | HPV45 | |||
| I | 1 (HPV16, HPV45) | 1 | 11.6 | 2.2 | 1.2 | 15.1 |
| 2 | 12.9 | 0.1 | 3.1 | 12.8 | ||
| 3 | 11.0 | 1.4 | 2.5 | 10.9 | ||
| 4 | 9.1 | 1.0 | 2.5 | 16.6 | ||
| 2 (HPV16, HPV45) | 5 | 6.0 | 0.5 | 1.0 | 8.6 | |
| II | 3 (HPV16) | 6 | 12.0 | 1.6 | 3.7 | 2.5 |
| 7 | 7.9 | 1.6 | 0.7 | 0.5 | ||
| 8 | 15.4 | 4.8 | 0.7 | 0.8 | ||
| 9** | 9.2 | 6.4 | 1.0 | 1.0 | ||
| 4 (HPV45) | 10 | 1.9 | 0.2 | 1.5 | 10.6 | |
| 11 | 0.9 | 0.7 | 0.3 | 12.8 | ||
| 12 | 1.9 | 0.2 | 1.5 | 10.6 | ||
A threshold of 5 µV was used for differentiating positive and negative signals
A false positive event: only HPV16 was present in the sample, but both HPV16 and HPV18 showed positive signals
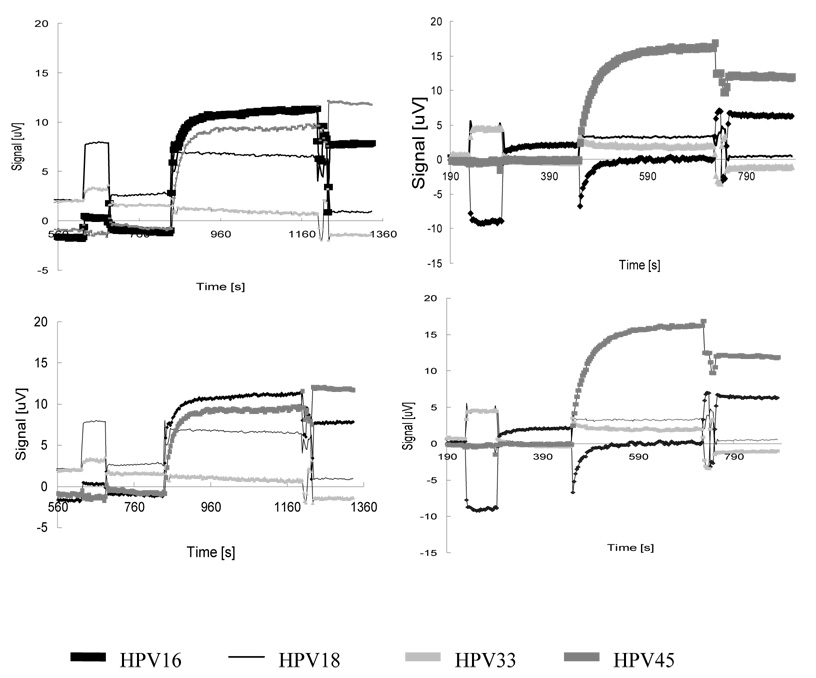
In phase I, we did four assays with one sample containing HPV 16 and 45. The signal curves are shown in Figure 3. We define the net signal as the difference between the saturated signal after applying MACS (Fig 2, end of D) and the water level (Fig 2, end of B). Table 1 (chip#1–4) lists the net signals from the four assays. Net signals of positive sensors were at least 4x those of negative sensors. Here the term “positive sensors” refers to the sensors immobilized with oligonucleotide probes complementary to the HPV subtypes present in the samples that therefore absorbed target DNAs and MACS; the term “negative sensors” refers to those sensors that were immobilized with non-complementary oligonucleotide probes and therefore did not absorb target DNAs and MACS. A threshold of 5 µV was used for differentiating between positive and negative sensors.
Figure 3. Signal curves of four assays in experiment phase I.
The Phase I experiment used four chips to detect HPV DNA in the same sample. There are four probes on each chip, corresponding to HPVs 16, 18, 33 and 45 strains. The target sample contains HPV16 and HPV45, confirmed by pyrosequencing. The concentration of each type of DNA was ~10 nM. The purpose of phase I was to test the stability and signal consistency of GMR sensors.
In phase II, we did 8 more assays with three different samples. The result, together with the four assays done in phase I, is summarized in Table 1. Most assays reported correct results with a safe margin, i.e., positive sensors are distinctly different from negative sensors. Only one out of the total twelve assays (chip #9) mistakenly reported one negative sensor as positive (a false positive result). The same sample was repeated in three other assays, and all reported correct results. We think the false positive is likely attributable to an operational mistake of the experimenters.
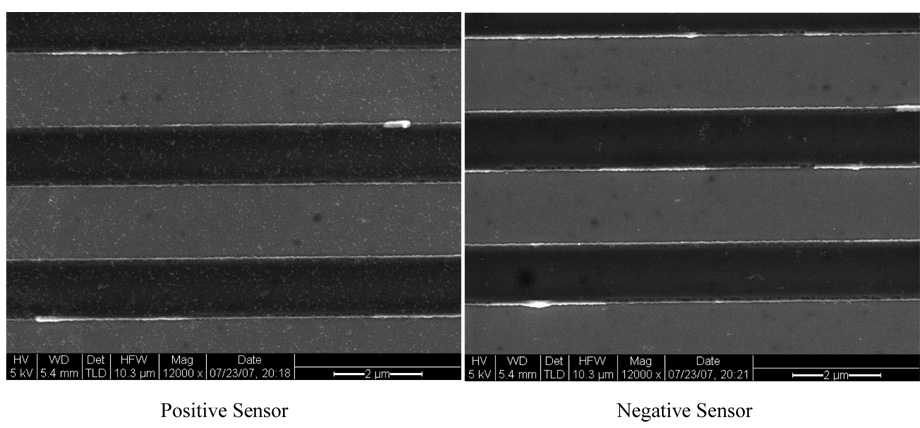
Scanning Electron Microscopy (SEM) images were taken after the measurement. Figure 4 shows a typical pair of positive and negative sensors from the same chip. The positive sensor shows a fairly high coverage of MACS, while negative sensor shows almost no particle coverage. This is consistent with the magnetic data.
Figure 4. Scanning Electron Microscopy images of typical positive and negative sensors.
Positive sensors refers to the sensors immobilized with oligonucleotide probes complementary to the HPV subtypes present in the samples that therefore absorbed target DNAs and MACS; negative sensors refers to those sensors that were immobilized with non-complementary oligonucleotide probes and therefore did not absorb target DNAs and MACS. The small white dots are magnetic nanoparticles.
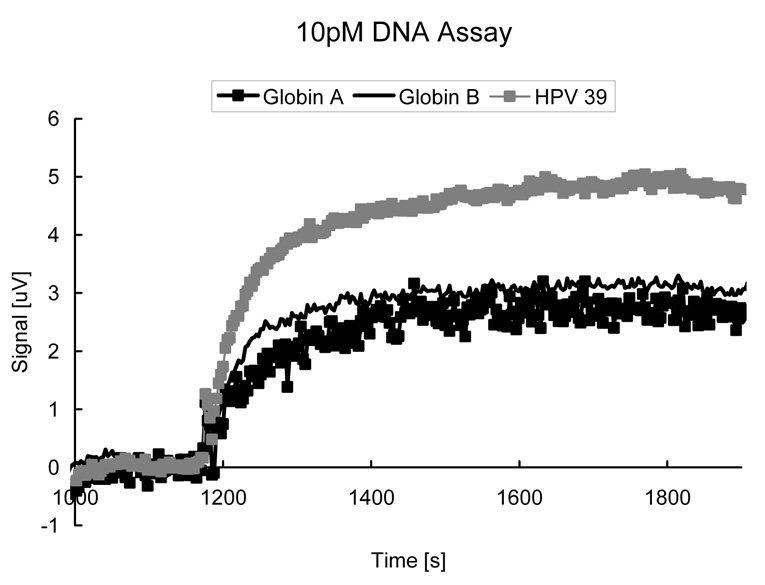
While it is not the focus of this paper to demonstrate the lowest possible sensitivity of GMR biochip, we note that it is theoretically feasible to detect very small concentrations (<1 pM) of DNA targets by deploying a right combination of GMR sensors and nanoparticle labels (Li, et al, 2006). Figure 5 shows an initial experiment displaying real-time responses of 3 DNA fragments (Globin A, B, and HPV39) at 10 pM applied to a GMR DNA chip identical to those used for HPV genotyping except that the capture probes correspond to Globin A, B, and HPV39 here. All DNA probes and targets used in this experiment are artificial samples and are prepared differently from the HPV sample described above, but the surface chemistry was the same. Note that specific nanoparticle adsorption reaches saturation in mere 10 minutes, suggesting these GMR biochips can be quite fast. Recently we have also demonstrated that DNA hybridization time can be greatly reduced from 8 hours to 15 min. in our microfluidic GMR biochips (Xu, et al, 2008), suggesting genotyping with an total assay time of <1 hour is feasible.
Figure 5.
Real-time responses of 3 DNA fragments (Globin A, B, and HPV39) at concentration of 10 pM applied to a GMR DNA chip.
4. Conclusion
Giant magnetoresistive sensors were used for HPV genotyping, and they showed an accuracy of ~90%, with good signal consistency across chips. We conclude that the GMR biochip is a good candidate for HPV genotyping, and other medical applications involving DNA detections. More broadly, we suggest that the GMR biochip may serve as a molecular diagnostic platform which is multiplex, accurate, sensitive, and rapid.
Acknowledgement
This work was performed in part at the Stanford Nanofabrication Facility (a member of the National Nanotechnology Infrastructure Network) which is supported by the National Science Foundation under Grant ECS-9731293, its lab members, and the industrial members of the Stanford Center for Integrated Systems. Scanning Electron Microscopy was done at the Stanford Nanocharacterization Lab. This work was supported by Defense Advanced Research Projects Agency (DARPA) Grant N000140210807, National Science Foundation Grant DBI-0551990, National Institutes of Health Grant P01-HG000205, Defense Threat Reduction Agency Grant HDTRA1-07-1-0030, and National Cancer Institute Grant 1U54CA119367-01.
Footnotes
Publisher's Disclaimer: This is a PDF file of an unedited manuscript that has been accepted for publication. As a service to our customers we are providing this early version of the manuscript. The manuscript will undergo copyediting, typesetting, and review of the resulting proof before it is published in its final citable form. Please note that during the production process errors may be discovered which could affect the content, and all legal disclaimers that apply to the journal pertain.
References
- American Cancer Society. Cancer Facts and Figures 2007. 2007. [Google Scholar]
- Baibich MN, Broto JM, Fert A, Nguyen Van Dau F, Petroff F. Giant Magnetoresistance of (001)Fe/(001)Cr Magnetic Superlattices. Phys. Rev. Lett. 1988;61(21):2472–2475. doi: 10.1103/PhysRevLett.61.2472. [DOI] [PubMed] [Google Scholar]
- Baselt DR, Lee GU, Natesan M, Metzger SW, Sheehan PE, Colton RJ. A biosensor based on magnetoresistance technology. Biosens. Bioelectron. 1998;13:731–739. doi: 10.1016/s0956-5663(98)00037-2. [DOI] [PubMed] [Google Scholar]
- Doorbar J. Molecular biology of human papillomavirus infection and cervical cancer. Clin. Sci. 2006;110:525–541. doi: 10.1042/CS20050369. [DOI] [PubMed] [Google Scholar]
- Ferreira HA, Graham DL, Feliciano N, Clarke LA, Amaral MD, Freitas PP. Detection of Cystic Fibrosis Related DNA Targets Using AC Field Focusing of Magnetic Labels and Spin-Valve Sensors. IEEE Trans. Magn. 2005;41(10):4140–4142. [Google Scholar]
- Gharizadeh B, Akhras M, Nourizad N, Ghaderi M, Yasuda K, Nyrén P, Pourmand N. Methodological improvements of pyrosequencing technology. J. Biotech. 2006;124:504–511. doi: 10.1016/j.jbiotec.2006.01.025. [DOI] [PMC free article] [PubMed] [Google Scholar]
- Gharizadeh B, Zheng B, Akhras M, Ghaderi M, Jejelowo O, Strander B, Nyrén P, Wallin K-L, Pourmand N. Sentinel-based DNA genotyping using multiple sequencing primers for high-risk human papillomaviruses. Mol. Cell. Probe. 2006;20:230–238. doi: 10.1016/j.mcp.2006.01.002. [DOI] [PMC free article] [PubMed] [Google Scholar]
- Grünberg P, Schreiber R, Pang Y, Walz U, Brodsky MB, Sowers H. Layered Magnetic Structures: Evidence for Antiferromagnetic Coupling of Fe Layers across Cr Interlayers. J. Appl. Phys. 1987;61(8):3750–3752. [Google Scholar]
- Han S-J, Xu L, Wilson RL, Wang SX. A Novel Zero-Drift Detection Method for Highly sensitive GMR Biochips. IEEE Trans. Magn. 2006;42(10):3560–3562. [Google Scholar]
- Kleter B, Doorn L-J van, Schrauwen L, Molijn A, Sastrowijoto S, Schegget J ter, Lindeman J, Harmsel B ter, Burger M, Quint W. Development and Clinical Evaluation of a Highly Sensitive PCR-Reverse Hybridization Line Probe Assay for Detection and Identification of Anogenital Human Papillomavirus. J. Clin Microbiol. 1999;38(8):2508–2517. doi: 10.1128/jcm.37.8.2508-2517.1999. [DOI] [PMC free article] [PubMed] [Google Scholar]
- Li G, Sun S, Wilson RJ, White RL, Pourmand N, Wang SX. Spin valve sensors for ultrasensitive detection of superparamagnetic nanoparticles for biological applications. Sens. Actuators A. 2006;126:98–106. doi: 10.1016/j.sna.2005.10.001. [DOI] [PMC free article] [PubMed] [Google Scholar]
- Li G, Wang SX. Analytical and Micromagnetic Modeling for Detection of a Single Magnetic Microbead. IEEE Trans. Magn. 2003;39(5):3313–3315. [Google Scholar]
- Roda Husman A-M de, Walboomers JMM, van den Brule AJC, Meijer CJLM, Snijders PJF. The use of general primers GP5 and GP6 elongated at their 3'ends with adjacent highly conserved sequences improves human papillomavirus detection by PCR. J. Gen. Virol. 1995;76:1057–1062. doi: 10.1099/0022-1317-76-4-1057. [DOI] [PubMed] [Google Scholar]
- Schotter J, Kamp PB, Becker A, Pühler A, Brinkmann D, Schepper W, Brücklet H, Reiss G. A biochip based on magnetoresistive sensors. IEEE Trans. Magn. 2002;38(5):3365–3367. [Google Scholar]
- Schotter J, Kamp PB, Becker A, Pühler A, Reiss G, Brückl H. Comparison of a prototype magnetoresistive biosensor to standard fluorescent DNA detection. Biosens. Bioelectron. 2004;19:1149–1156. doi: 10.1016/j.bios.2003.11.007. [DOI] [PubMed] [Google Scholar]
- Villiers E-M de, Fauquet C, Broker TR, Bernard H-U, Hausen H zur. Classification of papillomaviruses. Virology. 2004;324:17–27. doi: 10.1016/j.virol.2004.03.033. [DOI] [PubMed] [Google Scholar]
- Xu L, Yu H, Han S-J, Osterfeld S, White RL, Pourmand N, Wang SX. Giant Magnetoresistive Sensors for DNA Microarray. accepted by International Magnetics Conference; May 4–8, 2008; Madrid, Spain. 2008. [DOI] [PMC free article] [PubMed] [Google Scholar]


