

Abstract
Tsetse flies occupy discontinuous habitats and gene flow among them needs to be investigated in anticipation of area-wide control programs. Genetic diversities were estimated at six microsatellite loci in seven Glossina morsitans submorsitans Newstead (Diptera: Glossinidae) populations and five microsatellite loci in six G. m. morsitans Westwood populations. Nei’s unbiased diversities were 0.808 and 76 alleles in G. m. submorsitans and 0.727 and 55 alleles in G. m. morsitans. Diversities were less in three laboratory cultures. Matings were random within populations. Populations were highly differentiated genetically. Populations were strongly subdivided, as indicated by fixation indices (FST) of 0.18 in G. m. morsitans and 0.17 in G. m. submorsitans. 35% of the genetic variance in G. m. submorsitans was attributed to differences between populations from The Gambia and Ethiopia. All available genetic evidence suggests that genetic drift is much greater than gene flow among G. morsitans s.l. populations.
Keywords: Glossina morsitans, gene flow, microsatellites, population genetics, tsetse flies, Africa
Introduction
Glossina (Glossina) morsitans sensu lato is the most widely distributed tsetse fly. Its distribution, however, is discontinuous and patchy, extending from Senegal in west Africa, easterly to the lowlands in western Ethiopia and southwards to Botswana, Zimbabwe and Mozambique. A disjunctive distribution is characteristic also of each subspecies, and is the result of historical forces involving climate and animal host distribution and abundance (Rogers, 1998).
The G. morsitans complex consists of three subspecies, G. m. morsitans Westwood, G. m. centralis Machado and G. m. submorsitans Newstead. The geographical distribution of subspecies is allopatric: G. m. submorsitans is distributed in the north below the Sahel, from Senegal to Ethiopia. Glossina m. morsitans occurs in Tanzania to Mozambique and eastern Zambia and Zimbabwe. Glossina m. centralis occurs in Angola, northern Botswana, Uganda, Zaire and western Zambia (Jordan, 1993). Laboratory breeding studies indicate that the subspecies cross freely in cages but there is post-mating reproductive isolation. Hybrid males are sterile and hybrid females are semi-sterile (Curtis, 1972; Gooding, 1990). Clearly these taxa have a common ancestor and share large regions of their genomes, but each has evolved different adaptations particularly to climate (Robinson et al., 1997a, b; Rogers, 2000).
Experiments using mark, release and recapture methods (Rogers, 1977) and analysis of population dynamics (Vale et al., 1984; Williams et al., 1992) indicate that G. morsitans is highly vagile. A strong propensity for dispersal predicts that gene flow among population clusters (i.e. among demes or subpopulations) would compensate for the genetic drift that characterizes small populations (Wright, 1978; Hartl & Clark, 1997). A high rate of gene flow makes gene frequencies among subpopulations more homogeneous. Study of the breeding structures of G. morsitans s.l. populations was carried out by analysis of variation in mitochondrial DNA via the single strand conformational polymorphism method (Black & DuTeau, 1997). The research indicated surprisingly high levels of genetic differentiation in G. m. morsitans (Wohlford et al., 1999), G. m. submorsitans (Krafsur et al., 2000) and G. m. centralis (Krafsur et al, 2001). Mitochondrial DNA is single-copy and inherited maternally. There is no recombination so the mitochondrial genome behaves as a single locus with many alleles. For the foregoing reasons, mitochondrial variation serves as a sensitive indicator of genetic drift and bottlenecks in population size (Avise, 1994). Indeed, history records bottlenecks in G. morsitans populations caused by the great rinderpest pandemic first recorded in sub-Saharan Africa in 1886 (Ford, 1971). An independent assay of genetic variation could help to confirm or deny the picture of highly differentiated populations among which there is little gene flow. Here we provide an independent assay of genetic variation in the same tsetse populations examined earlier. We use microsatellite loci to estimate the genetic parameters of diversity and gene flow. Microsatellites are short repetitive nucleotide sequences with conserved flanking regions that may be amplified by using the polymerase chain reaction. Microsatellite loci were recently developed in morsitans group flies (Baker & Krafsur, 2001).
Materials and methods
Sampling
Glossina m. submorsitans from The Gambia (five demes) and Ethiopia (two demes) were sampled by Drs Nigel Griffiths and Steve Mihok, as explained earlier (Krafsur et al., 2000). Glossina m. morsitans samples were from Kakumbi, Zambia, Changara, Mozambique, and Mana Angwa, Mana Pools, Rekomitjie and Makuti, all in Zimbabwe (Wohlford et al., 1999). The Glossina m. centralis were sampled in Zambia (Kasanka, Chunga), Namibia (Katima Mulilo) and Botswana (Kwando, Okavango). Glossina m. morsitans laboratory cultures were maintained at the International Centre for Insect Physiology and Ecology and sampled late in 1995. The culture originated in Kariba, Zimbabwe, in 1967 and was maintained at Langford, Bristol, U.K. (Jordan et al., 1970). Their history at ICIPE is confounded with supplementary stocks of various origins. The G. m. submorsitans laboratory culture was established from flies caught at the River Komoe, Burkina Faso (about 150km south-west of Bobo-Dioulasso) in late 1979 or early 1980 (Gooding, 1981). The culture was begun by Professor Ron Gooding with 25 puparia at the University of Alberta, where it was maintained at densities of 90–120 inseminated females for approximately 112 generations. It was selected for certain allozyme markers (Gooding, 1990). Assuming selective neutrality at diploid loci, it can be shown that the expected level of heterozygosity (diversity) with respect to the foundation stock is 0.61.
Processing samples and microsatellite amplifications
DNA was extracted from whole bodies by using a CTAB method (Shahjahan et al., 1995). The primers for micro-satellite loci were: CAG133, F 5′-ATT TTT GCG TCA ACG TGA-3′ and R 5′-ATG AGG ATG TTG TCC AGT TT-3′; GmcCAG2, F 5′-GCT TTT CTC GTC CCA TAA-3′ and R 5′-GCG TTG TTG ATGACT GTG-3′; Gmm22, F 5′-CGT AAA CGC GGG CTT GT-3′ and R 5′-CAA TTT GGC TGG CTG TCC-3′; Gmm5B, F 5′-GAA TTG TTA TGA GTG CAT GT-3′ and R 5′-ATG CGA CAC GAC ACA ATA AG-3′; Gmm9B, F 5′-TTT CCT ATA TTG CGA TTA-3′ and R 5′-CGT TTA CGT TAC CCA GAA-3′; GmsCAG2, F 5′-GCT TTT CTC GTC CCA TAA-3′ and R 5′-GCG TTG TTG ATG ACT GTG-3′ (Baker & Krafsur, 2001). PCR reactions consisted of 10 × PCR buffer, 0.4mm dNTP, 1.5mm MgCl2, 0.5 μm each of forward and reverse primers, 0.5–1 μL of template DNA, and 0.25 U Biolase® polymerase for a final volume of 10 μL. The thermocycling profile was 35 cycles of 94°C for 40 s, 50°C for 40 s, and 72°C for 30 s. Amplifications were performed in a PTC-100 programmable thermal cycler (MJ Research, Waltham MA, U.S.A.).
Acrylamide gel electrophoresis and silver staining
After amplification, the PCR reactions were diluted 1:5 in a loading buffer consisting of 10mm NaOH, 95% formamide, 0.05% bromophenol blue, and 0.05% xylene cyanol. The samples were denatured for 5min at 95°C just before acrylamide gel electrophoresis and then electrophoresed on a 5% denaturing polyacrylamide gel (32 × 50 cm × 0.4 mm thick) by using the Sequi-General GT Nucleic Acid Electrophoresis Cell (Bio-Rad). The gels were run at a constant 100 W and 50°C. After electrophoresis, the gels were fixed in 10% glacial acetic acid at I least 30 min and then silver stained by using the procedures of Black & DuTeau (1997). Alleles were scored according to their mobilities on polyacrylamide gels. Each allele was assigned a value relative to the same DNA bp standard by measuring their distances from the origin.
Data analysis
Chi-square contingency tests were used to test for homogeneity of allele frequencies among populations. Nei’s (1987) unbiased estimator of gene diversity he at a locus is 2n(1−xi2)/(2n−1) where x is the frequency of allele i and n is the number of flies examined. This gives the expected heterozygosity when mating is random and other Hardy–Weinberg criteria apply. Diversity over r loci is HE = he/r with variance (he−HE)2/[n(n−1)], where n is the number of flies in the sample.
F statistics were used to examine the goodness of fit of genotypic frequencies to Hardy–Weinberg expectations. The computational methods of Weir & Cockerham (1984) were used. The F statistics measure variance in allele frequencies and are appropriate for the infinite allele mutation model, but they may also be applied to loci in which the stepping stone mutation model applies (Gaggioti et al., 1999). Microsatellite loci fall somewhere between the two mutation models. ARLEQUIN 2.0 (Schneider et al, 2000) and FSTAT 2.9.3 (Goudet, 1995, 2001) were used to calculate most genetic statistics.
F statistics lead to estimates of gene flow in terms of the mean number of reproducing migrants per generation exchanged among populations, Nem, which was estimated by using several models. The private allele method of Slatkin (Slatkin & Barton, 1989) was used because allelic diversities were large, leading to overestimates of dispersal when based on F statistics.
Tests of selective neutrality included the Ewens–Watterson, Ewens–Watterson–Slatkin and Chakraborty’s tests, which were accomplished by using the ARLEQUIN software. These tests are based on the infinite allele mutation model, which is not entirely appropriate for microsatellites. Chakraborty’s test (Chakraborty, 1990) compares the number of alleles in a sample with the number expected in a stationary population at mutation-drift equilibrium.
The frequency of presumptively null alleles (caused by mutations at annealing sites) was estimated according to a maximum likelihood method in which only null heterozygotes are scored (Brookfield, 1996). The chief assumption is that any heterozygote deficiencies were caused only by null alleles.
The software BOTTLENECK vs. 1.2 (Piry et al., 1999) was used to determine if the microsatellite diversities confirmed historical evidence of a severe and prolonged bottleneck in G. morsitans populations (Ford, 1971; Rogers, 1995).
Results
GmsCAG29 oligonucleotide primers failed to amplify Changara G. m. morsitans DNA. Gmm22 primers did not amplify in Changara and Kakumbi G. m. morsitans. These results are presumptive evidence of fixed differences at annealing sites in these populations. Allelic frequencies at the amplified loci are available from E.S.K. by e-mail.
Mutation-drift equilibrium tests
Ewens–Watterson and Ewens–Watterson–Slatkin tests of selective neutrality and mutation-drift equilibrium were nonsignificant. Chakraborty’s test of population amalgamation indicated a significant excess of alleles in G. m. submorsitans in Chankar, Kudang and Kunting, all in The Gambia, and G. m. morsitans in Changara, Mozambique. An excess of alleles can arise when the sampled populations have arisen by fusion of two or more previously isolated populations and this is consistent with field studies in G. m. submorsitans (Rawlings et al., 1993). The foregoing tests support the hypothesis that tsetse populations were at, or close to, mutation-drift equilibrium.
Microsatellite diversities in populations
Population diversities (heterozygosities) are summarized in Table 1. Mean alleles per locus varied from 3.3 in a laboratory culture of G. m. submorsitans to 7.5 in the Kunting sample. The variation in means differed significantly among the natural populations in both subspecies (Table 1). Averaged over loci, most heterozygosities exceeded 50%. Only three loci amplified in the Changara G. m. morsitans, thereby accounting for the least diversities observed in wild populations. Heterozygosities in three laboratory cultures were about the same as those observed in natural populations, testifying to the careful husbandry necessary to maintain tsetse in culture (Gooding et al, 1997). However, allelic diversity in laboratory cultures was less than in wild populations, as may be expected by drift in closed populations (Maruyama & Fuerst, 1985). Heterozygosity in the Burkina Faso laboratory culture was 0.54 compared with the mean 0.69 for wild samples, about 78% versus the theoretical expectation of 58%. Allelic diversity in the Burkina Faso laboratory culture, by contrast, was 3.37/6.97, or 48% of the mean value for wild flies.
Table 1.
Population diversities (heterozygosities) averaged over microsatellite loci in two Glossina morsitans subspecies.
| Mean sample size per locus | Mean no. of alleles per locus | Mean heterozygosity
|
|||
|---|---|---|---|---|---|
| Population | Observed | Expected | FISa | ||
| G. m. morsitans: 5 locib | |||||
| Lab A | 19.4±1.6 | 3.6±0.7 | 0.424±0.119 | 0.394±0.118 | −0.076 |
| Lab B | 18.2±2.5 | 4.8 ± 1.1 | 0.570 ±0.062 | 0.613 ±0.059 | 0.070 |
| Changara | 14.0 ±5.3 | 3.4±1.3 | 0.332±0.153 | 0.345±0.156 | 0.038 |
| Kakumbi | 14.2±3.3 | 4.2±1.3 | 0.528 ±0.141 | 0.493 ±0.136 | −0.071 |
| Makuti | 21.2±1.5 | 6.0±1.8 | 0.535±0.137 | 0.551 ±0.123 | 0.029 |
| Rekomitjie | 23.6 ±0.2 | 6.6±1.9 | 0.578 ±0.099 | 0.587±0.115 | 0.015 |
| Mana Angwa | 22.6 ±1.2 | 6.2±1.7 | 0.621 ±0.091 | 0.590 ±0.076 | −0.053 |
| Mana Pools | 22.6 ±1.2 | 7.2±1.1* | 0.620 ±0.072 | 0.718 ±0.027 | 0.136 |
| G. m. submorsitans: 6 locic | |||||
| Lab (B. Faso) | 24.0 ±0.0 | 3.3±0.7 | 0.590±0.129 | 0.539±0.112 | −0.095 |
| Dankuku | 23.3 ±0.2 | 7.0±1.5 | 0.676±0.122 | 0.647±0.112 | −0.045 |
| Kunting | 20.8 ±1.6 | 7.5±1.3 | 0.732±0.081 | 0.720 ±0.068 | −0.017 |
| Kenaba | 22.7 ±0.7 | 7.3 ±1.7 | 0.676±0.113 | 0.694 ±0.094 | 0.026 |
| Kudang | 24.0 ±0.4 | 7.2±0.2 | 0.637 ±0.097 | 0.654±0.106 | 0.026 |
| Bansang | 19.3 ±0.4 | 7.3±2.3 | 0.705±0.143 | 0.669±0.142 | −0.054 |
| R. Ketto | 22.8 ±1.0 | 6.7±1.6 | 0.473 ±0.088 | 0.723 ±0.054 | 0.346d |
| Chankar | 22.7 ±0.6 | 5.8±0.8 | 0.762 ±0.029 | 0.726 ±0.039 | −0.050 |
FIS = 1 −HO/HE. Significance tests by randomized permutation.
Alleles per locus in natural populations differ (ANOVA: F = 72.4, d.f. = 5, 585, P < 0.001).
Alleles per locus in natural populations differ (ANOVA: F = 21.0, d.f. = 6, 967, P < 0.001).
P ≈ 0.0002 for randomization tests with larger F than observed.
Chi-square tests of homogeneity of allele frequencies in G. m. submorsitans indicated that populations differed significantly in The Gambia (χ2(272) = 997, P << 0.001), in Ethiopia (χ2(43) = 195.6, P << 0.001), and therefore over all populations (χ2(420) = 2022, P << 0.001). In G, m. morsitans, allele frequencies differed among populations at each locus (χ2(56) = 1452.6, P << 0.001). Clearly, tsetse populations were genetically differentiated.
Contrasts between expected and observed heterozygosities (Table 1) are a measure of departures from Hardy–Weinberg equilibria, and this is best expressed by using F statistics. FIS in Table 1 is a measure of departures from random mating in populations. Its expectation is −2N−1 (Weir, 1996) and the expected value, for samples of c. 24, is −0.02. Only G. m. submorsitans from the River Ketto showed a significantly large gap between expected and observed heterozygosities. The cause was not inbreeding, but the occurrence of null alleles. The paucity of heterozygotes at River Ketto occurred at Gmm8, GmsCAG29, GmcCAG2 and Gmm22. Estimated frequencies of null alleles were 0.13, 0.38, 0.24 and 0.26, respectively, assuming the heterozygote deficiencies were caused only by null alleles.
Single locus statistics and genetic differentiation within and among natural populations
The number of alleles per locus varied from six in GpCAG133 to 21 in Gmm22 (Table 2). Averaged over only the wild populations, heterozygosities (HE) varied from 0.585 at GpCAG133 to 0.915 at Gmm5B.
Table 2.
Single-locus heterozygosities (HE) and F statistics by the method of Weir and Cockerham in field collected G. m. morsitans and G. m. submorsitans.
| Locus | No. alleles | HEa | FIS | FST | FIT |
|---|---|---|---|---|---|
| G. m. submorsitans | |||||
| Gmm5B | 20 | 0.910 | −0.015 | 0.064 | 0.051 |
| Gmm8 | 8 | 0.740 | 0.086 | 0.071 | 0.151 |
| GmsCAG29 | 11 | 0.848 | 0.027 | 0.080 | 0.105 |
| GmcCAG2 | 7 | 0.705 | −0.059 | 0.232 | 0.187 |
| GpCAG133 | 9 | 0.723 | 0.010 | 0.532 | 0.537 |
| Gmm22 | 21 | 0.921 | 0.117 | 0.065 | 0.174 |
| Meansa | 12.67 | 0.808 | 0.035 | 0.166 | 0.195 |
| SE | 6.22 | 0.040 | 0.029 | 0.075 | 0.069 |
| 20 | 0.915 | −0.015 | 0.064 | 0.051 | |
| G. m. morsitans | |||||
| Gmm5B | 20 | 0.915 | −0.015 | 0.064 | 0.051 |
| Gmm8 | 7 | 0.658 | −0.021 | 0.257 | 0.242 |
| GmsCAG29 | 10 | 0.799 | −0.054 | 0.265 | 0.226 |
| GpCAG133 | 6 | 0.585 | 0.013 | 0.315 | 0.324 |
| Gmm22 | 12 | 0.678 | 0.025 | 0.125 | 0.12 |
| Meansa | 11.00 | 0.727 | 0.029 | 0.185 | 0.206 |
| SE | 5.57 | 0.058 | 0.030 | 0.054 | 0.032 |
Expected unbiased heterozygosity (Nei, 1987) over all populations.
Jackknife means and standard errors for F statistics.
FIS measures departures from random mating within populations (Table 2) and a significant departure was observed only at Gmm22 in G. m. submorsitans. Estimates averaged over loci, however, indicated that matings within populations were random. In contrast, departures from random mating among populations were substantial. Averaged over loci, FST was 0.166 in G. m. submorsitans and 0.185 in G. m. morsitans. The comparable estimate in G. m. centralis was 0.186 (Krafsur et al., 2001). All the foregoing estimates were significantly different from zero. Nei’s (1987) analogous statistic GST was 0.168 in G. m. submorsitans, 0.181 in G. m. morsitans and 0.185 in G. m. centralis. Analyses of variance, presented later, gave closely similar estimates.
Microsatellite diversities in subspecies
Mean heterozygosities varied from 0.70 in G. m. centralis (Krafsur et al., 2001), 0.727 in G. m. morsitans, to 0.808 in G. m. submorsitans. These mean heterozygosities differed significantly when tested by ANOVA (F = 104.3, d.f. = 2 and 447, P < 0.001). There was, however, little difference in the allelic frequency distributions among subspecies, so they were combined in Fig. 1. The frequency of most (54%) alleles varied between 1 and 10%.
Fig. 1.
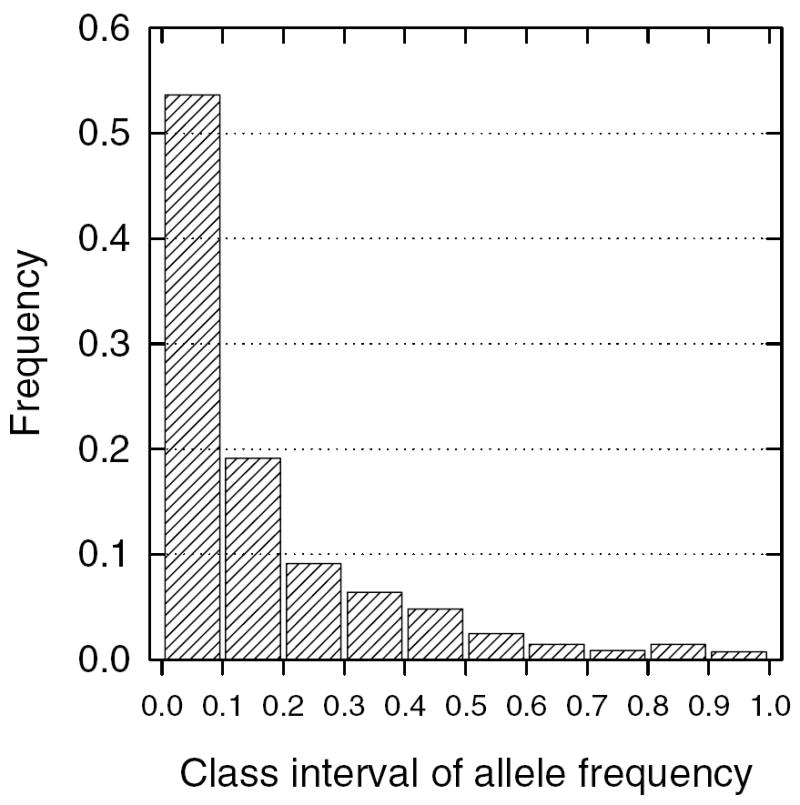
Distribution of allelic frequencies in G. morsitans sensu lato.
Seventy-six alleles were detected among six loci in G. m. submorsitans and 55 alleles among five loci in G. m. morsitans (Table 3). Fifty-three alleles among six loci were recorded G. m. centralis (Krafsur et al., 2001). The overall mean number of alleles per locus was 11 in G. m. morsitans, 12.7 in G. m. submorsitans and only 8.8 in G. m. centralis. These means differed significantly when tested by ANOVA (F = 18.8, d.f. = 2 and 447, P < 0.001). The proportions of private alleles (alleles unshared among populations) were homogeneous among subspecies (χ2(2) = 3.09, P ≈ 0.21) and averaged 16%. The frequency of private alleles, averaged over subspecies, was 0.082, leading to an average level of gene flow Nm = 0.90 and corresponding mean FST = 0.22. Nm and the corresponding FST values for each subspecies are included in Table 3.
Table 3.
Microsatellite private alleles, departures from random mating among populations FST, and average number of reproducing migrants per generation Nm according to the island model in Glossina morsitans subspecies.
| Taxon | No. populations | No. loci | No. alleles | Private allelesa | Freq. private alleles | Nmc | FSTd |
|---|---|---|---|---|---|---|---|
| G. m. morsitans | 6 | 5 | 55 | 12 | 0.097 | 0.68 | 0.27 |
| G. m. centralis | 7 | 6 | 53 | 5 | 0.095. | 0.70 | 0.26 |
| G. m. submorsitans | 7 | 6 | 76 | 13 | 0.055 | 1.81 | 0.12 |
Private alleles among taxa: χ2(2) = 3.09, P ≫ 0.21.
Average number of reproducing migrants per generation, estimated by the private allele method of Slatkin & Barton (1989).
FST ≫ (4Nm+1)−1.
Analysis of variance in allele frequencies
In G. m. morsitans, 18% of the variance in allele frequencies was among the six populations, and 82% lay within populations (Table 4). FST = 0.182, closely agreeing with the other estimates of this parameter. The variance components, hence the F statistics, all differed significantly from zero.
Table 4.
Analysis of variance in allele frequencies in G. m. morsitans by the method of Excoffier et al. (1992).
| Source of variation | d.f. | Sum of squares | Variance components | Percentage of variation |
|---|---|---|---|---|
| Among populations | 5 | 61.578 | 0.24434 | 18.22 |
| Within populations | 270 | 296.201 | 1.09704 | 81.78 |
| Total | 275 | 357.779 | 1.34138 |
Fixation Index FST = 0.182, P < 0.001.
In a hierarchical classification, G. m. submorsitans populations were assigned to one of two countries, and the variance in allele frequencies partitioned accordingly (Table 6). About 34% of the variance was attributed to countries and 65% lay within populations. Only a trivial 1% was attributed to populations within countries. FCT at 0.338, reflects the wide separation between easternmost and westernmost G. m. submorsitans and hardly differs from the FST estimate of 0.348.
Table 6.
Pairwise genetic distance measures for G. m. morsitans in terms of FST in upper diagonal and equivalent dispersal rates Nm in the lower diagonal.
| Bansang | Kenaba | Kunting | Kudang | Dankunku | R. Ketto | Chankar | |
|---|---|---|---|---|---|---|---|
| Bansang | 3/4 | 0.054 | −0.019 | 0.021 | 0.065 | 0.251 | 0.242 |
| Kenaba | 4.35 | 3/4 | 0.047 | 0.031 | 0.014 | 0.383 | 0.347 |
| Kunting | ∞ | 5.05 | 3/4 | 0.008 | 0.052 | 0.238 | 0.232 |
| Kudang | 11.82 | 7.84 | 30.55 | 3/4 | 0.059 | 0.231 | 0.228 |
| Dankunku | 3.58 | 18.06 | 4.57 | 3.98 | 3/4 | 0.415 | 0.370 |
| R. Ketto | 0.74 | 0.40 | 0.80 | 0.83 | 0.35 | 3/4 | 0.003 |
| Chankar | 0.78 | 0.47 | 0.82 | 0.85 | 0.42 | 85.67 | 3/4 |
Gene flow among populations
In G. m. submorsitans, pairwise estimates of FST varied essentially from zero to 0.06 within countries, and from 0.23 to 0.38 between countries (Table 6). The corresponding levels of dispersal Nm between countries was much less than one, predicting further differentiation by drift. Migrants within countries, however, were substantially above the ‘critical’ value of one (Wright, 1978). Pairwise estimates of FST in wild G. m. morsitans varied from 0.034 to 0.328 (Table 7). Mana Angwa vs. Makuti and Changara vs. Kakumbi were particularly low, suggesting high rates of gene flow. Gene flow between the other pairs were near unity or less. The laboratory cultures were more closely related to each other than to any particular wild sample.
Table 7.
Pairwise genetic distance measures for G. m. morsitans in terms of FST in upper diagonal and equivalent dispersal rates Nm in the lower diagonal.
| Lab A | Lab B | Rekomitjie | M.Pools | M.Angwa | Kakumbi | Changara | Makuti | |
|---|---|---|---|---|---|---|---|---|
| Lab A | – | 0.1058 | 0.2133 | 0.3283 | 0.2334 | 0.2561 | 0.2915 | 0.2522 |
| Lab B | 2.11 | – | 0.1998 | 0.2322 | 0.1944 | 0.1976 | 0.2235 | 0.2248 |
| Rekomitjie | 0.92 | 1.00 | – | 0.1948 | 0.1438 | 0.1186 | 0.2869 | 0.1318 |
| M. Pools | 0.51 | 0.83 | 1.03 | – | 0.1957 | 0.2088 | 0.2917 | 0.2521 |
| M. Angwa | 0.82 | 1.04 | 1.49 | 1.03 | – | 0.2207 | 0.2572 | 0.0336 |
| Kakumbi | 0.72 | 1.02 | 1.86 | 0.95 | 0.88 | – | 0.0587 | 0.2445 |
| Changara | 0.61 | 0.87 | 0.62 | 0.61 | 0.72 | 4.01 | – | 0.3122 |
| Makuti | 0.74 | 0.86 | 1.65 | 0.74 | 7.19 | 0.77 | 0.55 | – |
Discussion
Diversity estimates for Changara G. m. morsitans were flawed because two loci did not amplify. Amplification of two of four mitochondrial loci failed in the same samples (Wohlford et al., 1999), raising the possibility of fixed mutant annealing sites. The Changara population may therefore be more genetically differentiated than indicated by the available data and may, indeed, belong to a separate fly belt (Ford, 1971).
Allelic frequencies differed significantly among populations in both morsitans subspecies, indicating that gene flow was insufficient to overcome the force of genetic drift. Three possibilities can explain this genetic differentiation: (1) rates of dispersal were low; (2) strong and different selection regimes operate locally, and (3) populations were not in mutation-drift equilibrium. A transient disequilibrium would obtain as tsetse populations recovered from their earlier declines in density and range caused by the rinderpest epizootic of 1889–1896 (Ford, 1971). We were unable, however, to refute null hypotheses of mutation-drift equilibrium in our samples. Nevertheless, there were more alleles than expected, given the observed levels of heterozygosity in G. m. submorsitans from The Gambia. Coalescence of expanding populations can cause such a distribution (Chakraborty, 1990).
Gene diversities were substantial at all loci in G. morsitans s.l., testifying to historically abundant population sizes or remarkably high mutation rates. The microsatellite data offer no compelling evidence of earlier severe bottlenecks in subspecies. If mutation rates were particularly high, populations would remain at mutation-drift disequilibrium because only c. 800 generations had elapsed since the end of the rinderpest epizootic of 1889–1896 and sampling in 1996. Microsatellite loci in humans may show mutation rates as much as 10−3–10−4, although rates in Drosophila species are much less, c. 6 × 10⁻⁶ (Schug et al., 1997). Recovery from putative bottlenecks may be assumed to have been slow because the rapidity of mammalian host recovery from the rinderpest would have been a strongly limiting factor in tsetse population recovery and growth. Tsetse have low reproductive rates, with a population doubling time of c. 46 days, given a daily rate of increase of 1.5%. The historical record shows range expansion in G. m. morsitans and G. m. centralis of approximately 7 km/year (Ford, 1971; Williams et al, 1992), but data seem to be lacking for G. m. submorsitans. Thus, the great diversities in G. morsitans microsatellite loci would seem to indicate that many tsetse flies survived the rinderpest epizootic, perhaps as numerous small, scattered populations, largely undetected in southern Africa.
Departures from random mating within populations (FIS)
Observed heterozygosities were usually consistent with those expected on Hardy–Weinberg criteria. Averaged over loci, mating was random in populations (FIS≈ 0), with one exception. A large deficiency of heterozygotes was recorded at four of six loci in River Ketto G. m. submorsitans. In addition, when averaged over the wild G. m. submorsitans populations, Gmm22 deviated significantly from Hardy–Weinberg genotypic proportions. The cause of these departures from expectation had nothing to do with inbreeding because all loci selectively neutral loci would have been affected. There are alternative possibilities. One is that heterozygote deficiency was caused by a failure to achieve adequate resolution on gels to distinguish heterozygotes from homozygotes. A more likely explanation is the occurrence of mutant annealing sites associated with the problematic loci. Such mutations highlight a common problem with microsatellites, which is that the locus includes all amplified nucleotides plus the annealing sites, not just the primary sequence repeat. Thus, a distinct allele may represent a polymorphism that occurs at interstitial regions between primer annealing sites and the primary repeat itself.
Departures from random mating among populations (FST)
In contrast to FIS, mean FST estimates all differed significantly from zero, leading to the conclusion that genetic drift was much more potent than dispersal among populations. Of course, matings are far more likely within than between populations, but it takes very little gene flow to prevent much drift. For this reason, FSTs of ≥ 0.05 are generally considered to be evolutionarily significant (Wright, 1978). An estimate of 0.166 in G. m. submorsitans and 0.185 in G. m. morsitans compares with 0.186 in G. m. centralis (Krafsur et al., 2001). These estimates can be viewed as correlations between uniting gametes in populations relative to correlations between randomly chosen gametes in the population at large. The values are substantial, indicating large, and very comparable, measures of genetic drift in G. morsitans sensu lato. But they are underestimates because mean FST estimates were biased downward by high allele numbers. As heterozygosities approach unity, F approaches zero because F = 1−HO/HE, where HO is the observed and HE is the expected heterozygosity. Clearly, F cannot be greater than levels of homozygosity (Hedrick, 1999). Moreover, high mutation rates also depress FST estimates, leading to overestimates of gene flow.
Analyses of variance
The percentage of genetic variation among G. m. morsitans populations was 18.2%. A similar value (17.7%) was obtained in G. m. centralis (Krafsur et al., 2001). Hierarchical ANOVA in G. m. submorsitans showed that 33.8% of variation was between the two countries sampled and only 1 % among populations within countries. The corresponding FST estimates were 0.182 in G. m. morsitans, 0.177 in G. m. centralis and 0.35 in G. m. submorsitans. The latter estimate is double that afforded by the Weir and Cockerham method.
Gene flow
As measures of gene flow, the foregoing FSTs in G. m. morsitans and G. m. centralis indicate a mean level of exchange of about 1.14 reproducing flies per population per generation, according to Wright’s island model. In G. m. submorsitans, equivalent gene flow among all sampled populations was 1.26, and between Ethiopia and The Gambia it was 0.46 reproducing flies per generation. Estimates of gene flow based on private allele frequencies (Table 3) may be contrasted with estimates based on frequencies from all alleles (Tables 2, 4 and 5). The private allele method can furnish less biased estimates where heterozygosities are large. Private alleles indicated that gene flow in G. m. morsitans and G. m. centralis was less than one reproducing migrant per generation, thereby predicting that drift will lead to fixation of alternative alleles (Wright, 1978). The corresponding values of Nem and FST in G. m. submorsitans were considerably less than estimates provided by analysis of heterozygosities.
Table 5.
Analysis of variance in allele frequencies in G. m. morsitans by the method of Excoffier et al. (1992).
| Source of variation | d.f. | Sum of squares | Variance components | Percentage of variation | F statistics | Significance |
|---|---|---|---|---|---|---|
| Among countries | 1 | 12.273 | 0.10833 | 33.78 | FCT = 0.338 | < 0.0001 |
| Among populations within countries | 5 | 1.709 | 0.00333 | 1.04 | FSC = 0.016 | < 0.022 |
| Within populations | 275 | 57.486 | 0.20904 | 65.18 | FST = 0.348 | < 0.0001 |
| Total | 281 | 71.468 | 0.32070 |
Concluding remarks
The chief results of the research are twofold: there is much microsatellite diversity in G. morsitans s.l. and the variation is highly partitioned geographically. Thus, gene flow seems to be greatly restricted and this is consistent with all available genetic evidence, including chromosomal (Jordan et al., 1977; Southern, 1980), allozyme (Krafsur et al., 1997), mitochondrial (Wohlford et al., 1999; Krafsur et al., 2000) and microsatellite (Krafsur et al., 2001) polymorphisms. The chief question remaining is how to rationalize the picture of gene flow obtained by indirect means with that afforded by mark, release and recapture methods (Rogers, 1977), field sampling (Vale et al., 1984; Brightwell et al., 1992; Williams et al., 1992) and the historical record of G. morsitans recolonizing lands from which it presumably disappeared during the rinderpest (Ford, 1971).
Acknowledgments
Thanks to Nigel Griffiths and Steve Mihok for collecting most of the tsetse flies and Ron Gooding for the gift of G. m. submorsitans from his laboratory culture. Research was supported in part by USPHS grant no. AI40048. This is Journal Paper no. 19821 of the Iowa Agricultural and Home Economics Experiment Station, Project 3447 and supported in part by Hatch Act and State of Iowa funds.
References
- Avise JC. Molecular Markers, Natural History and Evolution. Chapman & Hall; New York: 1994. [Google Scholar]
- Baker MD, Krafsur ES. Identification and properties of microsatellite markers in tsetse flies Glossina morsitans sensu lato (Diptera: Glossinidae) Molecular Ecology Notes. 2001;1:234–236. doi: 10.1046/j.1471-8278.2001.00087.x. [DOI] [PMC free article] [PubMed] [Google Scholar]
- Black WCIV, Baer CF, Antolin MF, DuTeau NM. Population genomics: genome-wide sampling of insect populations. Annual Review of Entomology. 2001;46:441–469. doi: 10.1146/annurev.ento.46.1.441. [DOI] [PubMed] [Google Scholar]
- Brightwell R, Dransfield RD, Williams BG. Factors affecting seasonal dispersal of the tsetse flies Glossina pallidipes and G. longipennis (Diptera: Glossinidae) at Nguruman, south-west Kenya. Bulletin of Entomological Research. 1992;82:167–182. [PubMed] [Google Scholar]
- Brookfield JFY. A simple new method for estimating null allele frequency from heterozygote deficiency. Molecular Ecology. 1996;5:453–455. doi: 10.1111/j.1365-294x.1996.tb00336.x. [DOI] [PubMed] [Google Scholar]
- Chakraborty R. Mitochondrial DNA polymorphism reveals hidden heterogeneity within some Asian populations. American Journal of Human Genetics. 1990;47:87–94. [PMC free article] [PubMed] [Google Scholar]
- Curtis CF. Sterility from crosses between sub-species of the tsetse fly, G. morsitans. Acta Tropica. 1972;29:250–268. [PubMed] [Google Scholar]
- Ford J. The Role of Trypanosome in African Ecology: A Study of the Tsetse Fly Problem. George Allen & Unwin; London: 1971. [Google Scholar]
- Gooding RH. Genetic polymorphism in three species of tsetse flies (Diptera: Glossinidae) in Upper Volta. Acta Tropica. 1981;38:149–161. [PubMed] [Google Scholar]
- Gooding RH. Postmating barriers to gene flow among species and subspecies of tsetse flies (Diptera: Glossinidae) Canadian Journal of Zoology. 1990;68:1727–1734. [Google Scholar]
- Gooding RH, Feldmann U, Robinson AS. Care and maintenance of tsetse colonies. In: Crampton JM, Bear CB, Louis C, editors. Molecular Biology of Insect Disease Vectors: a Methods Manual. Chapman & Hall; London: 1997. pp. 41–55. [Google Scholar]
- Goudet J. FSTAT (vers. 1.2): a computer program to calculate F-statistics. Journal of Heredity. 1995;86:485–186. [Google Scholar]
- Goudet J. FSTAT, a Program to Estimate and Test Gene Diversities and Fixation Indices Version 2.9.3. 2001 http://www.unil.ch/izea/softwares/fstat.html Updated from Goudet (1995)
- Hard DL, Clark AG. Principles of Population Genetics. Sinauer Associates, Inc; Sunderland, MA: 1997. [Google Scholar]
- Jordan AM. Tsetse-flies (Glossinidae) In: Lane RP, Crosskey RW, editors. Medical Insects and Arachnids. Chapman & Hall; New York: 1993. pp. 333–382. [Google Scholar]
- Jordan AM, Nash TAM, Trewern MA. The performance of crosses between wild and laboratory-bred Glossina morsitans orientalis Vanderplank. Bulletin of Entomological Research. 1970;60:333–337. doi: 10.1017/S0007485300040840. [DOI] [PubMed] [Google Scholar]
- Krafsur ES, Endsley MA, Wohlford DL, Griffiths NT, Allsopp R. Genetic differentiation of Glossina morsitans centralis populations. Insect Molecular Biology. 2001;10:387–398. doi: 10.1046/j.0962-1075.2001.00277.x. [DOI] [PMC free article] [PubMed] [Google Scholar]
- Krafsur ES, Madsen M, Wohlford DL, Mihok S, Griffiths NT. Population genetics of G. morsitans submorsitans. Bulletin of Entomological Research. 2000;90:329–335. doi: 10.1017/s0007485300000456. [DOI] [PMC free article] [PubMed] [Google Scholar]
- Maruyama T, Fuerst PA. Population bottlenecks and non equilibrium models in population genetics. II. Number of alleles in a small population that was formed by a recent bottleneck. Genetics. 1985;111:675–689. doi: 10.1093/genetics/111.3.675. [DOI] [PMC free article] [PubMed] [Google Scholar]
- Nei M. Molecular Evolutionary Genetics. Columbia University Press; New York: 1987. [Google Scholar]
- Piry S, Luikart G, Cornuet JM. BOTTLENECK: a computer program for detecting recent reductions in the effective population size using allele frequency data. Journal of Heredity. 1999;90:502–503. [Google Scholar]
- Rawlings P, Ceesay ML, Wacher TJ, Snow WF. The distribution of the tsetse flies G. m. submorsitans and G. palpalis gambiensis (Diptera: Glossinidae) in The Gambia and the application of survey results to tsetse and trypanosomiasis control. Bulletin of Entomological Research. 1993;83:625B–632. [Google Scholar]
- Robinson TP, Rogers DJ, Williams B. Mapping tsetse habitat suitability in the common fly belt of Southern Africa using multivariate analysis of climate and remotely sensed vegetation data. Medical and Veterinary Entomology. 1997a;11:235–245. doi: 10.1111/j.1365-2915.1997.tb00401.x. [DOI] [PubMed] [Google Scholar]
- Robinson TP, Rogers DJ, Williams B. Univariate analysis of tsetse habitat in the common fly belt of Southern Africa using climate and remotely sensed vegetation data. Medical and Veterinary Entomology. 1997b;11:223–234. doi: 10.1111/j.1365-2915.1997.tb00400.x. [DOI] [PubMed] [Google Scholar]
- Rogers DJ. Remote sensing and the changing distribution of tsetse flies in Africa. In: Harrington R, Stock NE, editors. Insects in a Changing Environment. Academic Press; London: 1995. pp. 177–193. [Google Scholar]
- Rogers DJ. Satellite imagery and the prediction of tsetse distributions in East Africa. Proceedings of the Symposium on Diagnosis and Control of Livestock Disease Using Nuclear and Related Techniques: Towards Disease Control in the 21st Century IAEA; Vienna. 1997; IAEA; 1998. pp. 397–420. [Google Scholar]
- Rogers DJ. Satellites, time and the African trypanosomiases. Advances in Parasitology. 2000;47:131–171. doi: 10.1016/s0065-308x(00)47008-9. [DOI] [PubMed] [Google Scholar]
- Schneider S, Kueffer JM, Roessli D, Excoffier L. Arlequin Version 2.0: a Software for Population Genetic Data Analysis. Genetics and Biometry Laboratory, University of Geneva; Switzerland: 2000. [Google Scholar]
- Schug MD, Mackay TFC, Aquadro CF. Low mutation rates of microsatellite loci in Drosophila melanogaster. Nature Genetics. 1997;15:99–102. doi: 10.1038/ng0197-99. [DOI] [PubMed] [Google Scholar]
- Shahjahan RM, Hughes KJ, Leopold RA, DeVault JD. Lower incubation temperature increases yield of insect genomic DNA isolated by the CTAB method. BioTechniques. 1995;19:333–334. [PubMed] [Google Scholar]
- Slatkin M, Barton NH. A comparison of three indirect methods for estimating average levels of gene flow. Evolution. 1989;43:1349–1368. doi: 10.1111/j.1558-5646.1989.tb02587.x. [DOI] [PubMed] [Google Scholar]
- Southern DI. Chromosome diversity in tsetse flies. In: Blackman RL, Hewitt GM, Ashburner M, editors. Insect Cytogenetics Symposia of the Royal Entomological Society of London, Number Ten. Blackwell Scientific Publications; Oxford: 1980. pp. 225–243. [Google Scholar]
- Vale GA, Hursey BS, Hargrove JW, et al. The use of small plots to study populations of tsetse (Diptera: Glossinidae) Insect Science Applications. 1984;5:403–410. [Google Scholar]
- Weir BS. Genetic Data Analysis II. Sinauer Associates Inc; Sunderland, MA: 1996. [Google Scholar]
- Weir BS, Cockerham CC. Estimating F-statistics for the analysis of population structure. Evolution. 1984;38:1358–1370. doi: 10.1111/j.1558-5646.1984.tb05657.x. [DOI] [PubMed] [Google Scholar]
- Williams B, Dransfield R, Brightwell R. The control of tsetse flies in relation to fly movement and trapping efficiency. Journal of Applied Ecology. 1992;29:163–179. [Google Scholar]
- Wohlford DL, Krafsur ES, Griffiths NT, Marquez JG, Baker MD. Genetic differentiation of some Glossina morsitans morsitans populations. Medical and Veterinary Entomology. 1999;13:377–385. doi: 10.1046/j.1365-2915.1999.00185.x. [DOI] [PMC free article] [PubMed] [Google Scholar]
- Wright S. Evolution and the Genetics of Populations, Vol. 4. Variability Within and Among Natural Populations. University of Chicago Press; Chicago: 1978. [Google Scholar]