Abstract
Diacylglycerols (DAGs) are important lipid intermediates in cellular trafficking and signaling. Their concentrations are altered in diabetes, cancer, and other disease states. Quantification of DAGs in biological samples may provide critical information to uncover molecular mechanisms leading to various cellular functional disorders. Recent advances in lipidomics using mass spectrometry have greatly accelerated global lipid analysis and quantification. Quantification of DAGs by electrospray mass spectrometry (ESI/MS), however, is challenged by the absence of a permanent charge on the molecule, its low proton affinity and acidity, and its low abundance under normal biological conditions. We describe here the introduction of a quaternary ammonium cation to DAG molecules, using N-chlorobetainyl chloride, to afford a derivatized DAG that gives two orders of magnitude higher signal intensities than their underivatized sodium adducts. A linear calibration curve in which peak intensity ratios are plotted vs. molar ratios can be achieved by using ESI/MS with dilauroyl glycerol as the internal standard. Employing this new approach to this analyte, we found a nine fold increase of total DAGs in the livers of obese db/db mice compared to their heterozygous lean controls. This proven strategy can be used to detect and quantify DAG molecular species from biological samples using ESI/MS after one-step derivatization.
Introduction
Diacylglycerols (DAG) are glycerol derivatives in which two hydroxyl groups are substituted by fatty acyl groups through ester bond. DAGs are important intermediates in the biosynthesis and degradation of triacylglycerols (TAGs), glycerophospholipids, and glyceroglycolipids. 1 DAGs in membranes modify bilayer properties, possibly facilitating membrane fusion/fission events and affecting intracellular vesicular trafficking. 2, 3 DAGs also alter a number of membrane-related enzyme activities and play an important role in cell signaling. 4, 5 Various hormones (e.g., insulin, EGF) increase the release of DAGs from their precursors, opening downstream signaling pathways. 6–8 Modulation of DAGs in several disease states suggests that DAGs may be used as biomarkers for diagnosis of those diseases. 9, 10
DAGs may be measured with the DAG–kinase assay 11 or a pulse/chase experiment12, both of which require the use of radioactive material. Non radioactive, chemical approaches are also available for the quantification of DAGs in biological samples. 13–16 Typically, DAGs are separated from an extract of total lipids by using thin-layer chromatography (TLC) or high-pressure liquid chromatography (HPLC). Enriched DAGs can then be detected and quantified by using flame ionization detection (FID) 17 or evaporative light scatting detection (ELSD). 18 Alternatively, purified DAGs can be derivatized with a chromophore, the various derivatives separated by using reverse-phase HPLC, and quantified with UV detection. 13 Purified DAGs can also be derivatized to increase their volatility for separation of individual molecular species by gas chromatography and detection by FID 15,16 or negative-ion chemical ionization mass spectrometry. 14 Thus far, quantification of DAG molecular species requires two steps of chromatography separation, leading to long processing time and loss of analyte. Moreover, chromatographic separation of DAGs is seldom clean, and the outcome is overlapping peaks that interfere with good quantification.
The development of ESI/MS has greatly facilitated the analysis of charged, nonvolatile compounds including phospholipids in biological samples. 19–23 Employing appropriated internal standards, analysts can successfully quantify molecular species of different phospholipid classes under conditions where linear calibrations are achieved. Generally, a single internal standard can be used for each phospholipid class because molecular species with different carbon and double bond numbers within a lipid class give approximately similar ion responses. Owing to the lack of a permanent charge on the DAG molecular species, this class of lipids are usually analyzed by ESI/MS while detecting an [M + Li]+.24 Similar to TAG 25, however, the sensitivity of using the DAG [M + Li]+ in ESI/MS depends on chain length and unsaturation index. Correction factors to compensate for variable sensitivity may be established by using a series of standards, but the factors must be determined for each instrument and each set of working conditions.
A standard approach for quantifying an uncharged species by spray ionization methods is to introduce a permanent charge site and employ quantification strategies that work well for charged species. This reverse derivatization 26,27 would make DAGs less volatile and easier to introduce into the gas phase by ESI. Herein, we describe a strategy to attach a quaternary ammonium cation to DAG molecules by using N-chlorobetainyl chloride and to use the derivative, prepared in one step, for sensitive quantification over a wide dynamic range by using ESI/MS.
Experimental procedures
Materials
All synthetic 1,2-sn-diacylglycerol standards including 1,2,-sndilauroyl glycerol (12:0/12:0 DAG), 1,2-sn-dipalmitoyl-glycerol (16:0/16:0 DAG), 1-palmitoyl-2-oleoyl-sn-glycerol (16:0/18:1 DAG) and 1-stearoyl-2-arachidonoyl-snglycerol (18:0/20:4 DAG) were obtained as solutions in chloroform at a concentration of 1 mg/mL from Avanti Polar Lipids, Inc. (Alabaster, AL). 1,3-dilinoyl-rac-glycerol (18:2/18:2 1,3-DAG) was obtained from Sigma (St. Louis, MO). They were used as received. All solvents were HPLC grade and obtained from Fisher Scientific (Pittsburgh, PA). Anhydrous pyridine and methylene chloride were from Sigma (St. Louis, MO). N-chlorobetainyl chloride was from Tyger Scientific Inc. (Ewing, NJ).
Derivatization of Diacylglycerol
Between 1 and 100 nmol of diacylglycerol was dissolved in 0.5 mL anhydrous methylene chloride in a dry 5-mL glass tube with cap. Anhydrous pyridine (10 µL) and 10 mg N-chlorobetainyl chloride were added to the reaction solution. The tube was flushed with dry nitrogen, caped, and incubated at 42 °C with stirring. When the reaction was complete (within ~ 4 h as judged by TLC), the solvent was removed by a nitrogen stream, and the residues were extracted by using the Bligh and Dyer technique 28 to remove the salts. The lipid extracts were dried under a stream of nitrogen gas, dissolved in chloroform, filtered through a 0.2-µm Gelman acrodisc CR PTFE syringe filters, re-extracted, and dried again under a nitrogen stream. The final lipid residue was re-suspended in a 1:1 chloroform/methanol mixture prior to ESI-MS analysis.
Maintenance of Mice
Obese homozygous (db/db) and lean heterozygous (db/+) male mice were purchased from Charles River Labs (Wilmington, MA). Mice were housed separately, kept on a 12-h, light-dark cycle, and given free access to food (Pico-Vac standard lab rodent diet containing 20% protein and 5% fat) and water. All animal procedures were performed in accord with the Guide for the Care and Use of Laboratory Animals (National Academy of Sciences, 1996) and were approved by the Animal Study Committee of Washington University.
Preparation of Lipid Extracts from Mouse Liver
Mice at 10 weeks old were sacrificed by asphyxiation with carbon dioxide. The livers were excised quickly and immersed in ice-cold PBS. Each liver was quickly dried and immediately freeze-clamped at the temperature of liquid nitrogen. Liver wafers were pulverized into a fine powder with a stainless steel mortar and pestle. A tissue sample (~ 30 mg) was weighed from each mouse liver. Lipids of each individual liver sample were extracted by a modified Bligh and Dyer technique 28 utilizing 50-mM NaCl in the aqueous layer in the presence of 12:0/12:0 DAG (1 nmol/mg of wet weight) used as an internal standard. This molecular species of diacylglycerol represents < 1% of the total endogenous diacylglycerol mass. The lipid extracts were dried under a nitrogen stream and dissolved in chloroform. DAG was isolated by TLC as previously described 29 prior to derivatization described above. DAG derivatives were analyzed by ESI/MS in the positive-ion mode and quantified by comparisons of the individual ion peak intensities with those of the internal standard (i.e., 12:0/12:0 DAG) after correction for 13C isotope effects as was previously described. 25
Mass Spectrometry
ESI-MS with an Ion-Trap Mass Spectrometry
ESI mass spectra were obtained with a Finnigan Classic LCQ ion-trap mass spectrometer (San Jose, CA) with an ESI source. Samples were directly introduced into the instrument at a flow rate of 5 µL/min. The spray voltage was 5 kV, and the capillary temperature was 200 °C. All data were acquired in the positive-ion mode at unit mass resolving power by scanning between ions of m/z 500 and m/z 800. Normally, 3-min scans were averaged and processed using Finnigan Xcalibur 1.1 software.
ESI-MS with a Q-TOF Mass Spectrometry
Accurate mass measurements and MS/MS experiments were conducted with a Micromass Q-Tof Ultima mass spectrometer (Manchester, U.K.) to demonstrate the utility of better mass resolving power and a more accurate mass assignment than does the simple ion trap. The sample solution was directly introduced into the instrument at a flow rate of 5 µL/min. The capillary voltage was 3.0 kV, and cone voltage was 90 V. The source and desolvation temperatures were 80 and 150 °C, respectively. The cone gas flow was 40 L/h, and the desolvation gas flow was 400 L/h. Continuum mode TOF mass spectra were acquired in the positive-ion mode by using the TOF at 10,000 mass resolving power (full width at half maximum) for scans over the range of ions of m/z 500 to 800. Normally, 3-min scans were summed and processed using MassLynx 3.5.
To obtain accurate mass measurements for the molecular ion species, a lock mass solution (0.5 mM sodium trifluoroacetate in methanol/water 50/50) was injected before and after the sample injections. The resulting data were converted to mass centroids, from which accurate m/z’s were measured. The m/z values of the ion species of interest were then lock-mass corrected by using the accurate theoretical mass value of an ion produced from a “lock-mass” solution molecular ion that is closest in m/z to the unknown.
In the MS/MS mode, product-ion mass spectra were acquired with over the range of ions of m/z 50 and m/z 800. The optimized collision energy was set between 25.0 and 30.0 eV by using helium as collision gas at a pressure of 12 psi.
Results and Discussion
Standard mixture on the LCQ classic
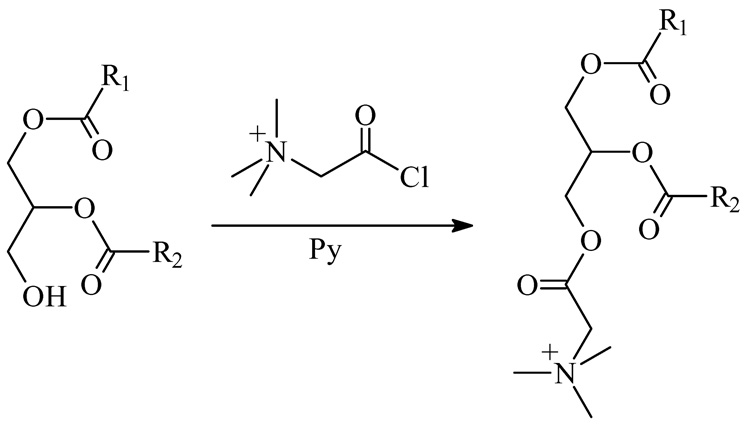
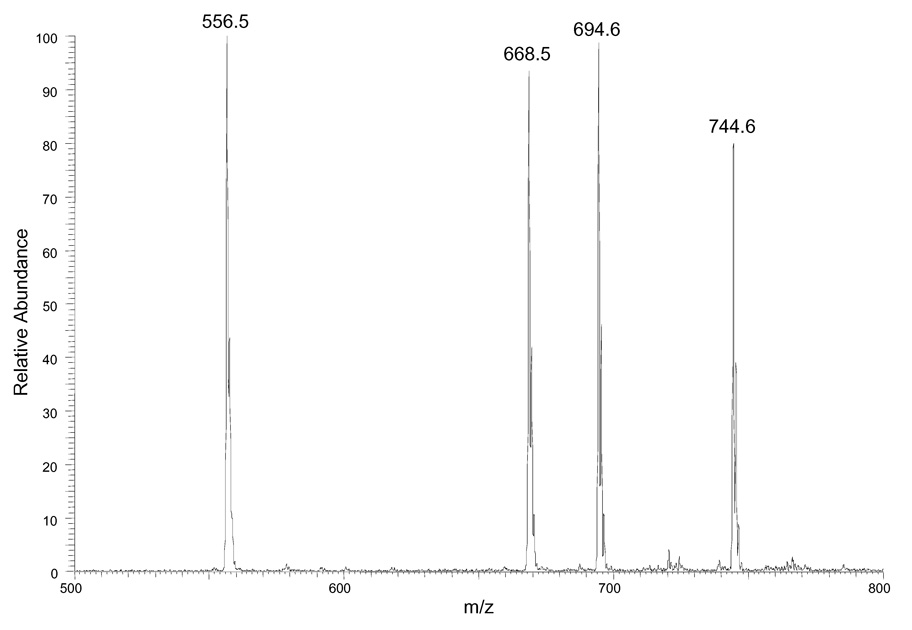
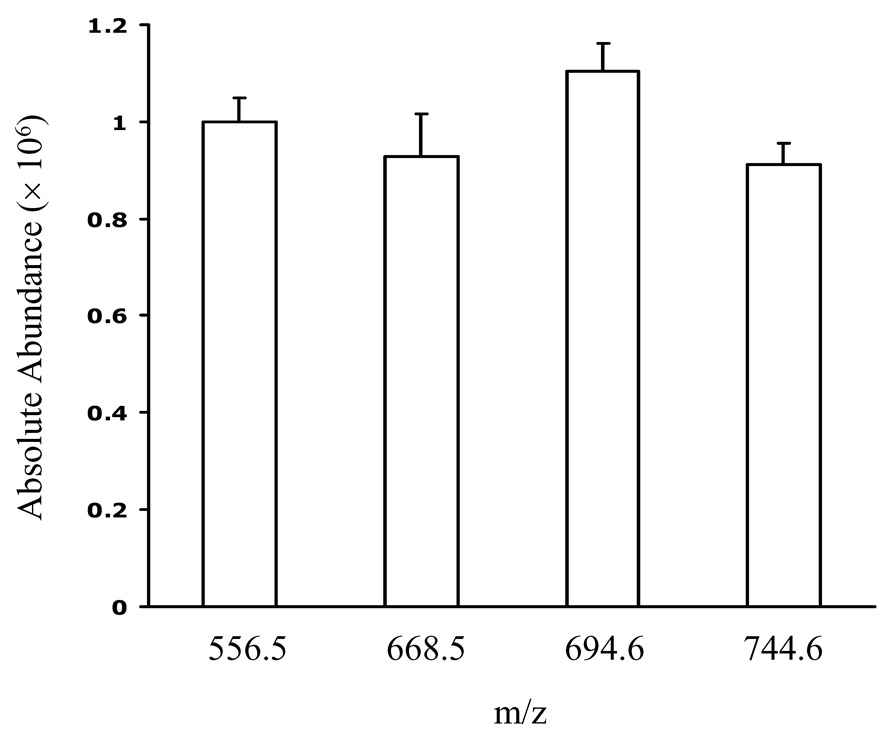
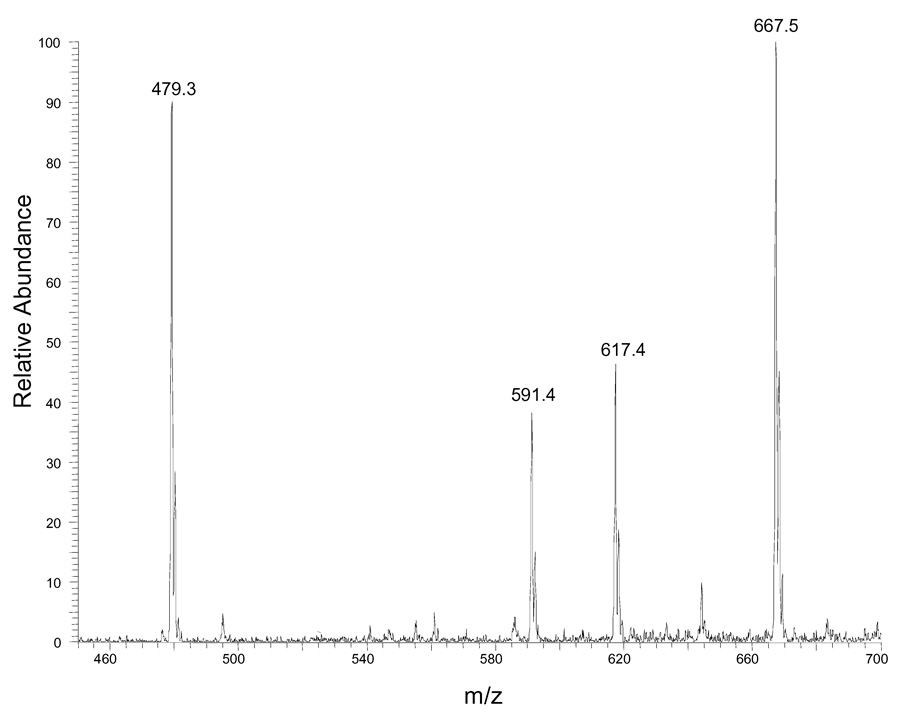
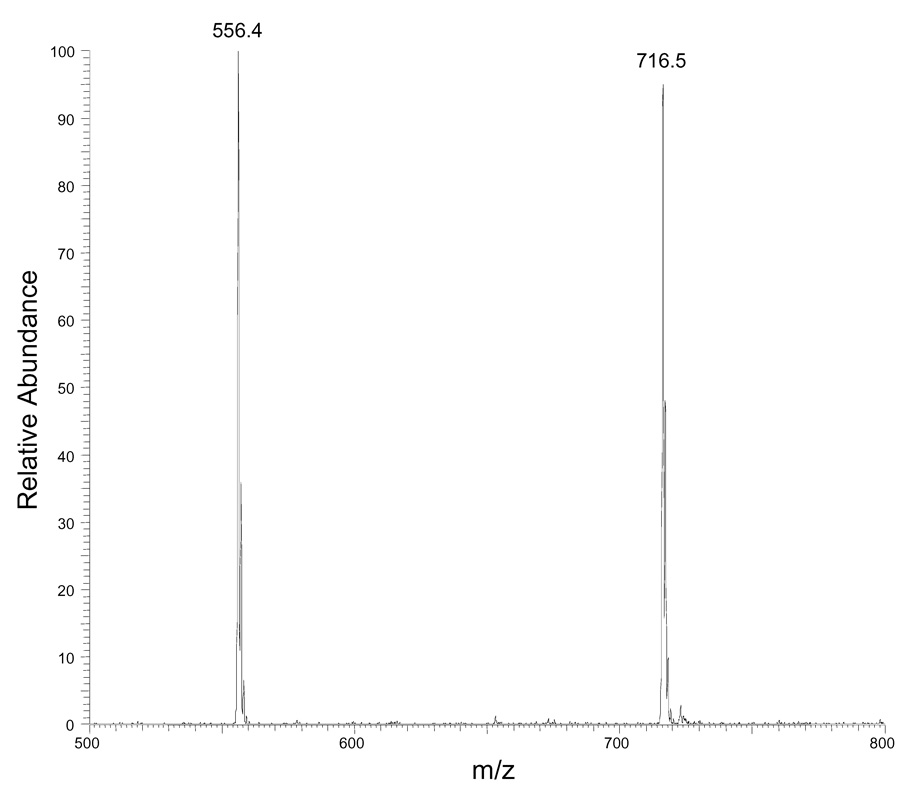
To test whether derivatization of DAG molecules with different side chain length and unsaturation indices afford similar ion responses, we prepared a standard mixture and derivatized the constituents so that they each contained a charge site. Treating a mixture of 10 nmol each of 12:0/12:0 DAG, 16:0/16:0 DAG, 16:0/18:1 DAG and 18:0/20:4 DAG with N-chlorobetainyl chloride (Scheme 1) yielded the test solution (10 pmol/µL of each DAG), which was diluted 100 times before injecting into the ion-trap mass spectrometer. The outcome was peaks representing the four major ions of m/z 556, 668, 694 and 744 from ionization of 12:0/12:0, 16:0/16:0, 16:0/18:1, and 18:0/20:4 DAGs that had been derivatized (Figure 1A). The signal intensity ratio for the four standards is (1 ± 0.05): (0.93 ± 0.09): (1.10 ± 0.06) : (0.91 ± 0.04) (n = 3) after adjusting for the fact that the signal intensity for the monoisotopic ion with respect to all molecular ion signals depends on the number of carbon atoms in the molecule (Figure 1B). The experimental ratios show less than a 10% deviation from theoretical ratio of 1:1:1:1. In contract, the same DAG mixture without derivatization gives four peaks representing the four major ions of m/z 479, 591, 617 and 667 from sodium adducts of 12:0/12:0, 16:0/16:0, 16:0/18:1, and 18:0/20:4 DAGs and their peak intensities are highly dependent on acyl chain length and unsaturation index (Figure 1C). This result is in accord with the concept that adding a charge site to this class of analytes minimizes effects of structure (e.g., carbon number) on response and provides modified analytes that give similar ion response in ESI/MS.
Scheme 1.
Derivatization chemistry for DAG with N-chlorobetainyl chloride.
Figure 1.
(A) ESI mass spectrum of equimolar mixtures of four DAG species (12:0/12:0, 16:0/16:0, 16:0/18:1, 18:0/20:4) after derivatization. (B) Signal intensities of four DAG standards after correcting for the variable 13C content of each analyte. The error bar shows the relative standard deviation (RSD) of each measurement (N = 3 for each point). (C) ESI mass spectrum of equimolar mixtures of four DAG species (12:0/12:0, 16:0/16:0, 16:0/18:1, 18:0/20:4) without derivatiozation. (D) ESI mass spectrum of equimolar mixtures of 1,2-DAG (12:0/12:0) and 1,3-DAG (18:2/18:2) after derivatization.
In order to examine whether 1,3-DAG may also be readily derivatized and whether 1,2-DAG derivative and 1,3-DAG derivative have similar mass response, 10 nmol each of 12:0/12:0 DAG and 18:2/18:2 1,3-DAG were derivatized and ESI/MS was performed as described above. The spectrum demonstrated that 1,3-DAG can also be quantitatively derivatized and its derivative shares similar ion response with 1,2-DAG derivative in ESI/MS (Figure 1D).
Quantification calibration curve and detection limit
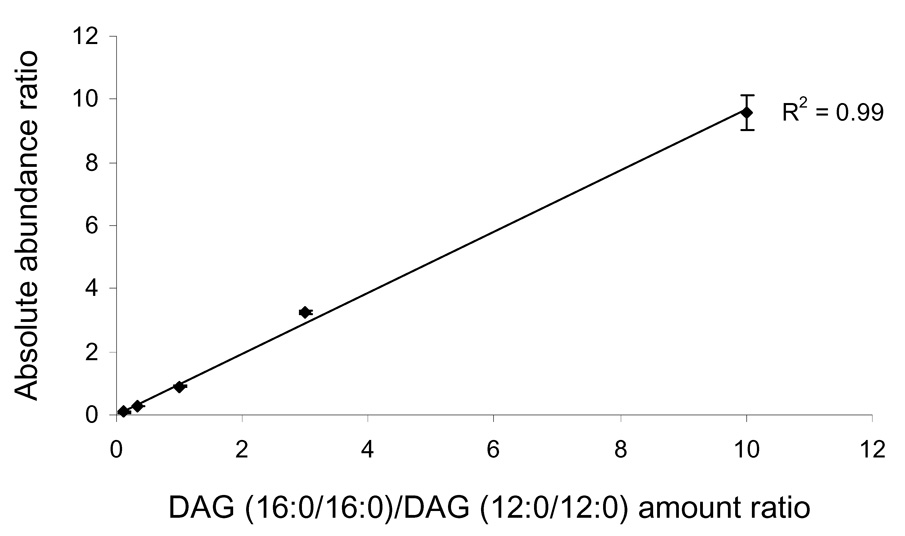
We then further examined the effect of different ratios of DAG to its internal standards to assess relative quantification. The standards were two DAG species (12:0/12:0 DAG, 16:0/16:0 DAG) that were mixed together at five different molar ratios: 1:10, 1:3, 1:1, 3:1, and 10:1 prior to derivatization. The relationship between ion peak intensity ratios and molar ratio is linear. The resulting calibration curve has a correlation efficient of 0.99 (Figure 2), and the relative standard deviations for quantification are between 2.0% to 5.8% for the various analytes. These results illustrate the high reproducibility and sensitivity that can be achieved for DAG quantification after derivatization.
Figure 2.
Calibration curves for the quantification of DAG (16:0/16:0) by ESI MS after derivatization. The internal standard is derivatized DAG (12:0/12:0).
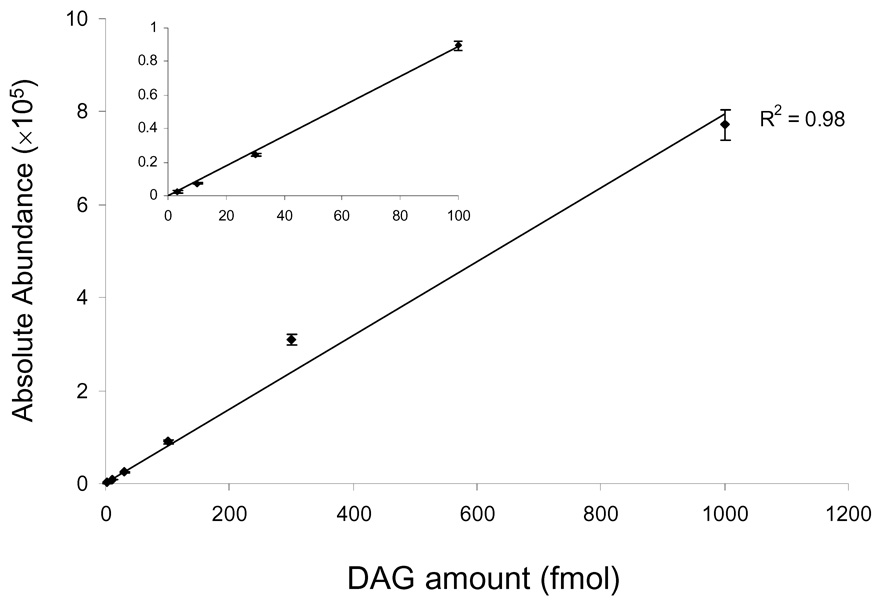
This strategy of DAG derivatization introduces a permanently charged quaternary ammonium head group and, thus, eliminates the requirement to accept positive ions (e.g., H+ or Na+) for ionization. The approach should also give improved detection limits because the ionization efficiency of a precharged species should be high. To test this possibility, we prepared a series of DAG standards (12:0/12:0) by dilution of a master solution and injected them into the ion trap instrument and acquired appropriate signal intensities. A detection limit of 10 fmol/µL with a signal-to-noise ratio of 3:1 was achieved, and this detection limit is approximately two orders of magnitude lower than can be obtained without any derivatization (e.g., using [M + Na]+ ions for detection). More importantly, plots of the signal intensity vs. the amounts of the analyte show a good linear correlation (Figure 3), suggesting the opportunity for direct quantification without using a single internal standards over a dynamic range of ~3 orders of magnitude.
Figure 3.
Plots of the absolute signal intensities vs. amounts of derivatized DAG (12:0/12:0). The inset magnifies the plots at low amounts.
Full MS and MS/MS on Q-TOF
We then turned to a higher performance instrument, the Q-TOF, to assess the advantages of improved mass resolving power and mass accuracy. The detection limits and dynamic range for calibration achieved on this instrument are comparable to those on the ion trap. Tandem mass spectrometry (MS/MS) experiments of the DAG species as precursor ions in the positive-ion mode show a common product ion of m/z 118.1 (data not shown), which is [HO-COCH2N(CH3)3]+ (Scheme 1). Unfortunately, product ions formed by the losses of fatty acid acyl chains are not detectable and no information to delineate the acyl components in DAG molecules is available. Fatty acyl chains of each molecular species, however, can be identified in the MS/MS mode for the DAGs by producing the precursors as lithium adducts, as previously described 24, instead of derivatizing them to form the charged species.
Biological samples
What is the prospect of using the currently developed strategy to quantify DAG molecular species in biological samples? To answer this question, we extracted lipids from livers of obese homozygous (db/db) and lean heterozygous (db/+) mice, after adding internal standard (i.e., 12:0/12:0 DAG), and isolated/purified the DAGs by using TLC. To assess the recovery of DAG in the TLC purification, we added 10 nmol of 16:0/16:0 DAG after TLC purification of 10 nmol of 12:0/12:0 DAG, derivatized the mixtures of these two standards, and analyzed them by ESI/MS in the positive-ion mode. The recovery is 95 ± 3%, assessed by comparing the signal ratio of m/z 556 and 668 ions (data not shown).
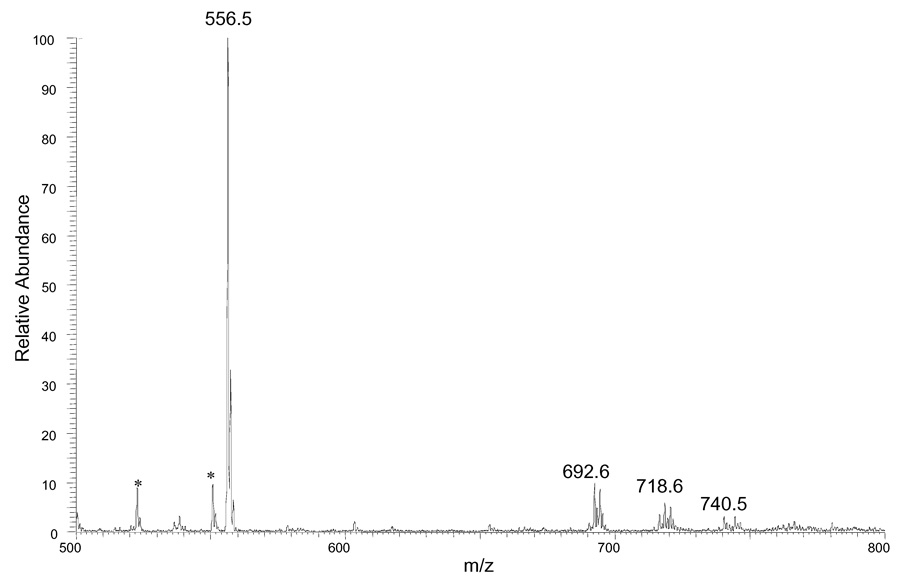
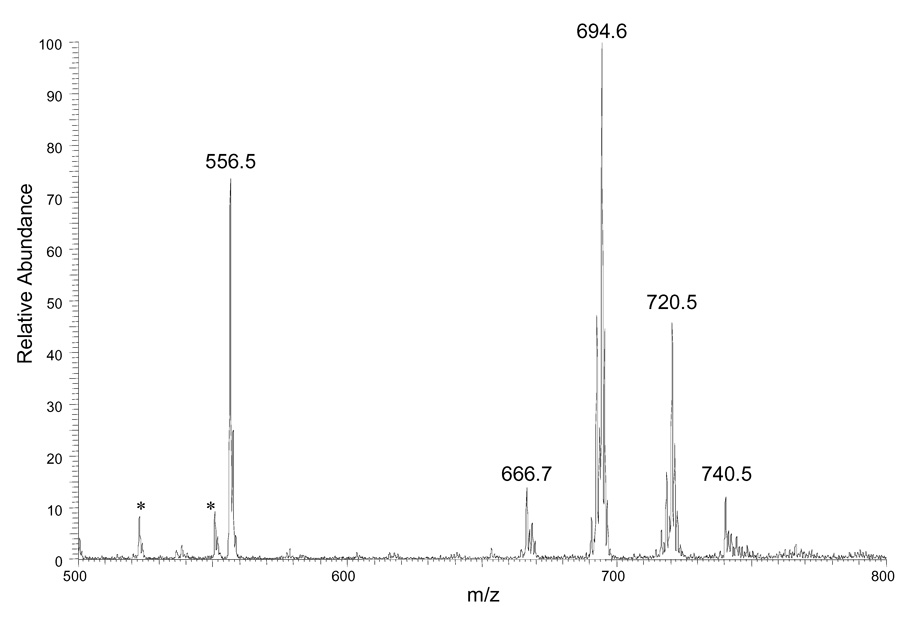
We then submitted DAG mixtures from mouse livers to this procedure. In Figure 5A and 5B, we show mass spectra of the derivatized extracts. The results demonstrate conclusively that the selectivity of the extraction and TLC are sufficient that the mass spectra of the extracts have few peaks other than those that represent the DAGs. This outcome is particularly promising because the derivatization reagent should modify any materials in the biological extracts that have a free OH group. The quantification of each DAG molecular species involves comparing its peak intensity with that of internal standard (12:0/12:0 DAG) after 13C correction to give the results summarized in Table 1. A comparison to lean control reveals that there is a dramatic increase in the amounts of DAG in the obese-mouse livers (Figure 4B vs. Figure 4A). The ratios of the various components are similar; the major components in the two samples are the same four materials (i.e., 34/2, 34/1, 36/3, and 36/2). Obese mouse livers, however, have approximately nine times more total DAGs than those from lean mice (see Table 1). This result is in good agreement with those from other studies using different strategies 30 and indicates that this derivatization approach can be used to quantify quickly molecular species of DAG in biological samples. We note, however, that the method does not allow us to distinguish isomers of the DAGs; that is, the quantification is of all species that are 34/2 or 38/4, for example.
Table 1.
Quantitation of Individual DAG Molecular Species in Mouse Livera
| DAG speciesb | m/z | Lean db/+ (n = 3) | Obese db/db (n = 3) |
|---|---|---|---|
| 32/1 | 666 | -c | 0.19 ± 0.03 |
| 32/0 | 668 | - | 0.09 ± 0.02 |
| 34/2 | 692 | 0.12 ± 0.02 | 0.72 ± 0.08 |
| 34/1 | 694 | 0.09 ± 0.02 | 1.3 ± 0.2 |
| 36/3 | 718 | 0.07 ± 0.01 | 0.25 ± 0.04 |
| 36/2 | 720 | 0.05 ± 0.01 | 0.64 ± 0.06 |
| 38/6 | 740 | 0.04 ± 0.01 | 0.18 ± 0.02 |
| 38/5 | 742 | 0.020± 0.005 | 0.10 ± 0.02 |
| 38/4 | 744 | 0.03 ± 0.01 | 0.07 ± 0.01 |
| Total | 0.41 ± 0.03 | 3.6 ± 0.4 |
Individual molecular species of DAG were identified and quantified from mouse livers as described in the Experimental Procedures. Each value represents the mean ± SEM. The values are in nmol/mg wet weight.
Total carbon number/total double bond number in two acyl chain
<1% of total DAG
Figure 4.
ESI mass spectra of derivatized DAG mixtures from (A) lean mouse livers (B) obese mouse livers. An identical amount of the DAG standard (12:0/12:0) (1 nmol/mg wet weight) was added to both tissue samples before the derivatization step to serve as internal standard. Unidentified peaks are labeled with a star.
We prepared a synthetic sample of three of the DAGs (32/0, 34/1, and 38/4) and the internal standard (24/0) in a ratio given in the table for the obese mouse liver. The ratio of the measured relative abundances of the molecular ions for 32/0:34/1:38/4 in this synthetic sample is 0.14:1.7: 0.12, which agrees reasonable well with the ratio determined in the biological sample (0.09:1.3:0.07).
Accurate mass measurements for selective DAG species from biological samples are possible with the Q-TOF. The observed masses for all tested species were obtained within five-parts-per-million of their theoretical ones (results summarized in Table 2), serving to confirm the identity of the derivatized DAG species from mouse livers. We can ask whether five-parts-per-million is sufficient to distinguish the analyte from other prospects. “A reasonable prospect” should be a closed-shell ion (should have an odd number of nitrogens), not have a hydrogen number that exceeds 2n + 2, where n is number of C and N atoms, and, if the composition has P, there must be at least three oxygen atoms for each phosphorus atom. Within 5 ppm of the measured accurate masses of the m/z 692 species, there are two reasonable prospects: C41H79O3N3P and C43H74O2N5. The first composition cannot be that of a DAG or of a derivative. The second is also not that of a DAG, and if it is a derivative, it would possess 11 rings and/or double bonds. For the m/z 694 species, there are no reasonable prospects. For the m/z 718 species, there are two reasonable prospects: C43H81O3N3P and C45H76O2N5. The first cannot be a DAG or a derivative, whereas the second can be a relatively unsaturated derivatized material (12 rings and/or double bonds) but not a DAG. For the species of m/z 720, there is one possibility: C45H78O2N5, which cannot be a DAG but could be a relatively highly unsaturated (11 rings and/or double bonds) derivatized material. The accurate mass, in addition to the fragmentation to give a m/z 118 ion and the elution characteristics by TLC, add considerable specificity to the assignment of a DAG in biological samples.
Table 2.
Summary of mass accuracy for selected DAG species from mouse livers (n = 3)
| DAG species | Theoretical mass (m/z) | Observed mass (m/z) | Deviation (ppm) |
|---|---|---|---|
| 34/2 | 692.5829 | 692.583 ± 0.002 | 3 |
| 34/1 | 694.5986 | 694.596 ± 0.002 | 3 |
| 36/3 | 718.5986 | 718.5996 ± 0.0004 | 0.6 |
| 36/2 | 720.6142 | 720.6148 ± 0.0004 | 0.6 |
Summary
We developed a strategy to introduce efficiently a charge site into DAG molecules for accurate quantification by using ESI/MS. After derivatization, different DAG species give nearly identical ion response in ESI/MS independent of their different side chains. Furthermore, the relationship of ion peak intensity ratio vs. molar ratio is linear of three orders of magnitude. Comparing to a direct analysis (i.e., one without derivatization) using a [M + Na]+ as read out, this new approach improves the detection limit by two orders of magnitude. Application of the method to the analysis of DAG in mouse livers shows that the total DAGs in obese mouse livers are elevated by nine folds in comparison to the amounts in lean controls. The limitation of this approach is that MS/MS does not give sufficient structural information to identify the nature and location of the various fatty acids.
Acknowledgements
This work was supported by National Institutes of Health Grants P41RR00954 (Gross, ML) and 2R01GM42259-31 (Stahl, PD).
References
- 1.Goni FM, Alonso A. Prog. Lipid Res. 1999;38:1–48. doi: 10.1016/s0163-7827(98)00021-6. [DOI] [PubMed] [Google Scholar]
- 2.Jun Y, Fratti RA, Wickner W. J. Biol. Chem. 2004;279:53186–53195. doi: 10.1074/jbc.M411363200. [DOI] [PubMed] [Google Scholar]
- 3.Barona T, Byrne RD, Pettitt TR, Wakelam MJO, Larijani B, Poccia DL. J. Biol. Chem. 2005;280:41171–41177. doi: 10.1074/jbc.M412863200. [DOI] [PubMed] [Google Scholar]
- 4.Lucas P, Ukhanov K, Leinders-Zufall T, Zufall F. Neuron. 2003;40:551–561. doi: 10.1016/s0896-6273(03)00675-5. [DOI] [PubMed] [Google Scholar]
- 5.Stahelin RV, Digman MA, Medkova M, Ananthanarayanan B, Melowic HR, Rafter JD, Cho W. J. Biol. Chem. 2005;280:19784–19793. doi: 10.1074/jbc.M411285200. [DOI] [PubMed] [Google Scholar]
- 6.Wang H, Yang C, Leskow FC, Sun J, Canagarajah B, Hurley JH, Kazanietz MG. Embo J. 2006;25:2062–2074. doi: 10.1038/sj.emboj.7601098. [DOI] [PMC free article] [PubMed] [Google Scholar]
- 7.Farese RV, Konda TS, Davis JS, Standaert ML, Pollet RJ, Cooper DR. Science. 1987;236:586–589. doi: 10.1126/science.3107122. [DOI] [PubMed] [Google Scholar]
- 8.Pettitt TR, Zaqqa M, Wakelam MJO. Biochem. J. 1994;298:655–660. doi: 10.1042/bj2980655. [DOI] [PMC free article] [PubMed] [Google Scholar]
- 9.Saburi Y, Okumura K, Matsui H, Hayashi K, Kamiya H, Takahashi R, Matsubara K, Ito M. Cardiovasc. Res. 2003;57:92–100. doi: 10.1016/s0008-6363(02)00608-9. [DOI] [PubMed] [Google Scholar]
- 10.Kim JK, Fillmore JJ, Chen Y, Yu C, Moore IK, Pypaert M, Lutz EP, Kako Y, Velez-Carrasco W, Goldberg IJ, Breslow JL, Shulman GI. Proc. Natl. Acad. Sci. USA. 2001;98:7522–7527. doi: 10.1073/pnas.121164498. [DOI] [PMC free article] [PubMed] [Google Scholar]
- 11.Preiss J, Loomis CR, Bishop WR, Stein R, Niedel JE, Bell RM. J. Biol. Chem. 1986;261:8597–8600. [PubMed] [Google Scholar]
- 12.Billah MM, Eckel S, Mullmann TJ, Egan RW, Siegel MI. J. Biol.Chem. 1989;264:17069–17077. [PubMed] [Google Scholar]
- 13.Lee C, Fisher SK, Agranoff BW, Hajra AK. J. Biol. Chem. 1991;266:22837–22846. [PubMed] [Google Scholar]
- 14.Hubbard WC, Hundley TR, Oriente A, MacGlashan DW., Jr Anal. Biochem. 1996;236:309–321. doi: 10.1006/abio.1996.0172. [DOI] [PubMed] [Google Scholar]
- 15.Pacheco YM, Perez-Camino MC, Cert A, Montero E, Ruiz-Gutierrez V. J. Chromatogr., B: Biomed. Sci. Appl. 1998;714:127–132. doi: 10.1016/s0378-4347(98)00231-x. [DOI] [PubMed] [Google Scholar]
- 16.Tserng K-Y, Griffin R. Anal. Biochem. 2003;323:84–93. doi: 10.1016/j.ab.2003.08.026. [DOI] [PubMed] [Google Scholar]
- 17.Striby L, Lafont R, Goutx M. J. Chromatogr. A. 1999;849:371–380. doi: 10.1016/s0021-9673(99)00589-0. [DOI] [PubMed] [Google Scholar]
- 18.Lin J-T, Turner C, Liao LP, McKeon TA. J. Liq. Chrom. Rel. Technol. 2003;26:773–780. [Google Scholar]
- 19.Ramanadham S, Hsu F-F, Bohrer A, Nowatzke W, Ma Z, Turk J. Biochemistry. 1998;37:4553–4567. doi: 10.1021/bi9722507. [DOI] [PubMed] [Google Scholar]
- 20.Fridriksson EK, Shipkova PA, Sheets ED, Holowka D, Baird B, McLafferty FW. Biochemistry. 1999;38:8056–8063. doi: 10.1021/bi9828324. [DOI] [PubMed] [Google Scholar]
- 21.Ivanova PT, Cerda BA, Horn DM, Cohen JS, McLaffertyq FW, Brown HA. Proc. Natl. Acad. Sci. USA. 2001;98:7152–7157. doi: 10.1073/pnas.131195098. [DOI] [PMC free article] [PubMed] [Google Scholar]
- 22.Han X, Gross RW. J. Lipid Res. 2003;44:1071–1079. doi: 10.1194/jlr.R300004-JLR200. [DOI] [PubMed] [Google Scholar]
- 23.Pulfer M, Murphy RC. Mass Spectrom. Rev. 2003;22:332–364. doi: 10.1002/mas.10061. [DOI] [PubMed] [Google Scholar]
- 24.Hsu F-F, Ma Z, Wohltmann M, Bohrer A, Nowatzke W, Ramanadham S, Turk J. J. Biol. Chem. 2000;275:16579–16589. doi: 10.1074/jbc.M908342199. [DOI] [PubMed] [Google Scholar]
- 25.Han X, Gross RW. Anal Biochem. 2001;295:88–100. doi: 10.1006/abio.2001.5178. [DOI] [PubMed] [Google Scholar]
- 26.Busch KL, Hsu BH, Wood KV, Cooks RG, Schwarz CG, Katritzky AR. J. Org. Chem. 1984;49:764–769. [Google Scholar]
- 27.De Pauw E, Pelzer G, Marien J, Piette JL, Pardon MC. Org. Mass Spectrom. 1985;20:692–693. [Google Scholar]
- 28.Bligh EG, Dyer WJ. Can. J. Biochem. Physiol. 1959;37:911–917. doi: 10.1139/o59-099. [DOI] [PubMed] [Google Scholar]
- 29.Ramanadham S, Hsu F-F, Bohrer A, Ma Z, Turk J. J. Biol. Chem. 1999;274:13915–13927. doi: 10.1074/jbc.274.20.13915. [DOI] [PubMed] [Google Scholar]
- 30.Shin O-H, da Costa K-A, Mar M-H, Zeisel SH. Biochim. Biophys. Acta. 1997;1358:72–78. doi: 10.1016/s0167-4889(97)00064-5. [DOI] [PubMed] [Google Scholar]


