

Abstract
To study the population structure of Glossina morsitans morsitans Westwood (Diptera: Glossinidae), polymerase chain reaction (PCR) and single-strand conformational polymorphism (SSCP) methods were used to estimate mitochondrial DNA diversity at four loci in six natural populations from Zambia, Zimbabwe and Mozambique, and in two laboratory cultures. The Zambian and Zimbabwean samples were from a single fly belt. Four alleles were recorded at 12S and 16S1, and five alleles at 16S2 and COI Nucleotide sequencing confirmed their singularities. Chi-square contingency tests showed that allele frequencies differed significantly among populations. Mean allele diversities in populations averaged over loci varied from 0.14 to 0.61. Little loss in haplotype diversity was detected in the laboratory cultures thereby indicating little inbreeding. Wright’s fixation index FST in the natural populations was 0.088 ± 0.016, the correlation of haplotypes within populations relative to correlations in the total. A function of its inverse allows an estimate of the mean equivalent number of females exchanged per population per generation, 5.2. No correlation was detected between pairwise genetic distance measures and geographical distances. Drift explains the high degree of differentiation.
Keywords: Glossina morsitans, mitochondrial variation, population genetics, tsetse flies
Introduction
Tsetse flies (Diptera: Glossinidae) have low reproductive rates, low population densities and discontinuous distributions (Ford, 1971; Rogers & Randolph, 1985). The foregoing suggest that tsetse populations may show pronounced degrees of genetic differentiation as a consequence of drift at selectively neutral loci. Interpopulation variation in tsetse flies was reviewed by Gooding (1992). Most variation, evaluated by allozymes and trypanosome susceptibilities, was between independently derived laboratory cultures and few natural populations were studied directly. Examination of 11 natural Glossina pallidipes Austen populations from Kenya, Zambia, Zimbabwe and Mozambique, however, showed remarkably high levels of genetic differentiation at allozyme loci (Krafsur et al., 1997).
Glossina morsitans is the most widespread tsetse. Three allopatric subspecies are known. This report is concerned only with G morsitans morsitans Westwood. In the late 19th century, a rinderpest pandemic all but eliminated morsitans’ mammalian hosts in much of southern Africa and the flies were confined to small refugia in the Zambezi river valley from which they have subsequently spread (Ford, 1971). The range of G. m. morsitans now encompasses foci in Malawi, Mozambique, Tanzania, Zambia and Zimbabwe. Four allopa-tric belts are described in Ford (1971) and Jordan (1993). We have samples from the westernmost, in Zambia and Zimbabwe, and a sample from Changara, Mozambique, in the southern belt. The objective of the research was to study gene flow in G. m. morsitans. If populations are small and discontinuous, drift will cause gene frequencies to diverge. Differing selection regimes could also cause genetic differentiation. However, the forces of drift and selection are compensated by migration and so it is appropriate to ask, what levels of exchange obtain among the sampled populations? In other words, how much dispersal has there been among populations? A survey of allozyme variation in G. m. morsitans showed only 20χ of the loci were polymorphic, and the mean heterozygosity was only 6.6%, a rather low value for insects (Krafsur & Griffiths, 1997). The method chosen to evaluate gene flow was to measure and partition mitochondrial DNA (mtDNA) variation within and among populations. mtDNA is useful in population analysis because it is single copy, non-recombining and maternally inherited. Typically, among-population variation is greater than within-population variation (Avise, 1994).
Inbreeding and selection may occur when establishing and maintaining insect cultures, therefore the biological representativeness of such cultures of field populations can legitimately be questioned. Inbreeding is accompanied by a loss in genetic diversity that is proportional to the number of founders, the number of generations elapsed and the harmonic mean population size. Thus, examination of diversity in cultured tsetse can provide an index of inbreeding. Selection may be inferred if haplotype frequencies deviate significantly from those expected in equilibrium populations under the infinite allele model (Chakraborty, 1990).
To detect mtDNA variation, the polymerase chain reaction (PCR) was used to amplify conserved mitochondrial loci, and the single-strand conformational polymorphism (SSCP) technique was used to reveal polymorphisms. The conserved DNA primers are given in Simon et al. (1994). SSCP can detect a single base difference in a 100–300-bp DNA segment with 99% accuracy and in a 300–450 base segment with 89χ accuracy (Hiss et al., 1994). The sensitivity of detecting mutations varies with conditions in complex ways and efficiency may be reduced to 65–75% for sequences 200–400bp (Bailey, 1995; Cotton, 1996). Thus, high detectabilities are unlikely to obtain under only one or two sets of experimental conditions that would allow the processing of large samples and multiple loci.
Materials and Methods
Sampling
Glossina m. morsitans were collected by using Epsilon F3 cloth traps in Kakumbi, on the River Luangwa in the South Luangwa National Park, Zambia; Mana Pools, Mana Angwa, Rekomitjie and Makuti, all in northern Zimbabwe; and in Changara, west central Mozambique. The traps had pthalogen blue exteriors and black interiors and were baited with acetone, phenol and octenol (Torr et al., 1989). Mana Pools, Rekomitjie, and Makuti are about 30km apart in a 60-km transect. Mana Angwa lies ≈ 92 km to the east of the transect. Mana Pools, Mana Angwa and Rekomitjie are on the River Zambezi or its tributaries. Game aggregate in the dry season at these sites. Makuti is on an escarpment at c. 1000 m. Changara was about 400km east of Mana Pools. Sampling locations are indicated in Fig. 1. The flies were killed, frozen in liquid nitrogen and shipped to Ames. In addition, we examined laboratory cultures maintained at the International Centre for Insect Physiology and Ecology and the Kenya Trypanosomiasis Research Institute. Their origins are confounded and histories unclear because the cultures have been supplemented at various times with pupae from the field and from other lab cultures.
Fig. 1.
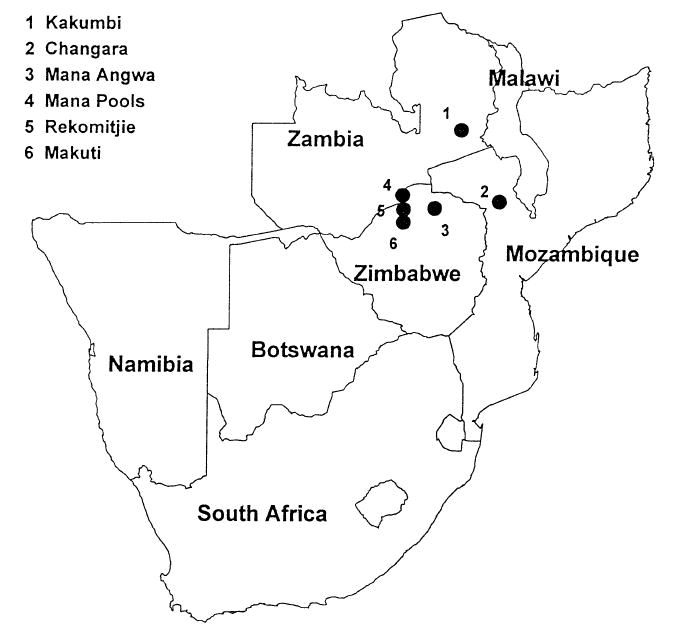
Sampling sites of G. m. morsitans in southern Africa.
DNA extraction
A CTAB (hexadecyltrimethylammonium bromide) extraction method was used in which each fly was placed in a 1.5-ml microcentrifuge tube, homogenized in 200 μl of high salt tris-ethylenediaminetetraacetate (TE), 200 μl of 2×CTAB, and 10μl of Triton-X. Next, 20 μl of pronase was added and the samples were placed at 37°C for 2–16 h. The supernatant was then removed to a clean tube and extracted with an equal volume of 24: 1 chloroform: isoamyl alcohol. The supernatant was then removed to a fresh tube, precipitated with 70% isopropanol and rinsed with 70% ethanol. The DNA was rehydrated in water or low salt TE.
Primers and polymerase chain reaction amplification
We examined variation at cytochrome oxidase subunit I, 12S ribosomal RNA, and 16S ribosomal RNA (Table 1). The primers are reviewed in Simon et al. (1994) and were purchased from the University of British Columbia Biotechnology Laboratory whose designations are given in Table 1. PCR reactions consisted of 10× PCR buffer, 0.4 mm dNTP, 1.5 mm MgCl2, 4 μg BSA, 0.25 μm each of forward and reverse primers, 0.5–1 μl of template DNA, and 0.5 μl Taq DNA polymerase for a final volume of 10 μl. Amplifications were performed in a PTC-100 programmable thermal cycler (MJ Research).
Table 1.
Mitochondrial loci amplified in G. m. morsitans.
| Locus | UBC designation | Simon et al. (1994) designation | Approx. size (bp) | Sequence |
|---|---|---|---|---|
| COI | MtD7 | Cl-J-1751 | 440 | 5′-GGA TCA CTG ATA TAG CAT TCC C-3′ |
| MtD9 | Cl-N-2191 | 5′-CCC GGT AAA ATT AAA ATA TAA ACT TC-3′ | ||
| 12S | MtD35 | SR-J-14233 | 350 | 5′-AAG AGC GAC GGG CGA TGT GT-3′ |
| MtD36 | SR-N-14588 | 5′-AAA CTA GGA TTA GAT ACC CTA TTA T-3′ | ||
| 16S1 | MtD32 | LR-J-12887 | 600 | 5′-CCG GTC TGA ACT CAG ATC ACG T-3′ |
| MtD34 | LR-N-13398 | 5′-CGC CTG TTT AAC AAA AAC AT-3′ | ||
| 16S2 | MtD29 | Nl-J-12585 | 300 | 5′-GGT CCC TTA CGA ATT TGA ATA TAT CCT-3′ |
| MtD31 | LR-N-12866 | 5′-ACA TGA TCT GAG TTC AA CCG G-3′ |
Acrylamide gel electrophoresis and single-strand conformational polymorphism
We used methods of Black & DuTeau (1996). After the PCR reactions were completed, 6 μl of loading buffer was added to the reaction mixture. The buffer consisted of 10 mm NaOH, 95% formamide, 0.05% bromophenol blue, and 0.05% xylene cyanol. The processed samples were then heated to 95°C for 4 min, cooled on ice to 0°C, and then immediately loaded on a native polyacrylamide gel.
The electrophoretic separations were performed by using Hoefer vertical slab gels. Two concentrations of acrylamide were used to resolve the samples. For 12S and 16S1, 8% acrylamide in a 1: 29 bis-acrylamide: acrylamide ratio was used. For COI and 16S2, 9% acrylamide in a 1:19 bis-acrylamide:acrylamide ratio was used. All gels contained 5% glycerol and 1× tris-borate-ethylenediaminetetraacetate (TBE). Gels were run at 20°C (8% gels) or 2°C (9% gels) at 250 V for 16 h at which time the xylene cyanol migrated about 13 cm. The lane markers were phiX174 DNA/Hinf I (Promega G1751).
To achieve consistency in identifying each haplotype from gel to gel, the distance from the origin of each band was measured and recorded together with distances migrated by lane markers. In addition, haplotype standards were run on each gel.
Silver staining of DNA
The gels were fixed in 250 ml of 10% glacial acetic acid solution for at least 20 min. After fixation the gels were rinsed with double glass-distilled water three times, followed by 30min in 0.15% (w/v) silver nitrate and 0.15% (v/v) 37% formaldehyde. Gels were again rinsed in double-distilled water three times, followed by development in chilled 3% Na2CO3 solution and 0.15% (v/v) 37% formaldehyde. After the appropriate degree of staining was reached, fixative solution was added to stop the reaction.
Phenotypes on gels were then scored and photographed by using a digital camera (BioVideo-500, Bioimaging Technologies, Brookfield, WI) connected to a Macintosh 6300 computer using the public domain NIH Image program (developed at the U.S. National Institutes of Health and available on the Internet at http://rsb.info.nih.gov/nih-image/).
Sequencing
The hypothesis was tested that putative alleles inferred from patterns on acrylamide gels corresponded to unique nucleotide sequences. DNA from flies showing the same allele at a locus was amplified in 30μl PCR reactions. Product concentrations of 5ng per 100 bp were submitted to the Iowa State DNA Sequencing and Synthesis Facility and sequenced by using the Sanger automated dideoxy method. Reactions were run by using the Applied Biosystems Prism Big Dye terminator cycle sequencing kit with AmpliTaq DNA polymerase FS, and electrophoresed on an Applied Biosystems Prism 377 DNA sequencer. Each PCR fragment was sequenced in both directions by using the SSCP primers, and chromatograms were assembled and conflicting base calls were corrected by using the program Auto Assembler 1.4.0. Four alleles at 16S1 and five at 16S2 were sequenced (Table 2). Variation between sequences was identified by using SeqApp 1.9 (Gilbert, 1992). No gaps were detected in the sequences. Of 876 nucleotides sequenced over the two loci, 43 (4.9%) were variable. We have sequenced a sum of forty gel phenotypes (presumptive alleles) from morsitans group flies. We found two of these gel phenotypes to have homologous nucleotide sequences, an error rate of 5%. Five putative alleles were found each to have two different sequences and one putative allele showed, on sequencing three flies, three different sequences. Thus, our SSCP gels underestimate nucleotide diversity.
Table 2.
Sequence variation in 16S1 and 16S2 haplotypes in G. m. morsitans. Positions where there was variation between individuals of the same haplotype are designated Y (C or T) and R (A or G). Two individuals of each haplotype were sequenced.
| Nucleotide positions | |
|---|---|
| 16S1 | 0 0 0 0 0 0 0 1 1 2 2 2 2 2 2 2 2 3 3 3 3 3 4 5 |
| 3 3 3 4 6 6 6 3 6 1 4 4 5 6 7 9 9 2 2 4 5 6 4 0 | |
| Allele | 1 2 3 8 2 3 4 9 6 3 8 9 6 0 6 7 9 8 9 3 2 2 5 3 |
| A | GTAGTATYAGTAAGTTATTAGAGT |
| B | A · · · · · · C · A · · · · · · · · · · · · A · |
| C | · · · · · · · C · · · · · · · · · · · G · · · · |
| D | AATAATATAAATTAAATGAGATAA |
| 16S2 | 0 0 0 0 1 1 1 1 1 1 1 1 1 2 2 2 2 2 2 |
| 5 5 9 9 0 2 4 6 6 6 7 8 8 1 1 2 3 4 8 | |
| 4 5 6 7 7 2 4 3 4 9 6 7 9 0 6 8 4 9 9 | |
| A | GGAATTCTTATAAAAGAGG |
| B | · · · · · · · · · · · · R · · R · · · |
| C | ATGGAATAAGCTGGTAGAA |
| D | AT · GAATAAGCTGGTAGAA |
| E | AT· · · · · · · · · TG · · A · A · |
Data analysis
Chi-square contingency tests were used to test for homogeneity of allele frequencies among populations. Chakraborty’s (1990) neutrality test was used to test the hypothesis that haplotypes were selectively neutral. The calculations were made with Arlequin version 1.1 software (Schneider et al, 1997). Wright’s (1978) fixation index FST, or the standardized variance in allele frequencies among populations, is the actual variance divided by the total limiting variance thus: FST = Σkσx2/Σk[(xT)(1 − xT)], where σx2 = Σ(x − xk)2/s. Here x is the frequency of allele xk and xT is the frequency over s populations. The foregoing statistics were calculated by using Biosys-1 (Swofford & Selander, 1981). An analogous measure of FST was provided by θ (the ‘coancestry coefficient’ of Weir & Cockerham, 1984) and it allows a jackknife estimate of its variance. θ, like FST, is the correlation of two random haplotypes in subpopulations relative to the total population. θ was estimated at three hierarchical levels, populations within regions, regions within the total, and populations relative to the total. Analysis of variance according to the methods of Weir (1996) and Excoffier et al. (1992) were used on the combined data set by using Arlequin (Schneider et al., 1997). Pairwise θ also were calculated by using Arlequin.
The unbiased estimate of genetic diversity at a locus is given by he= n(1 − Σxk2)/(n − 1), where n is the number of individuals (Nei, 1987). This is the probability that two randomly chosen individuals in the sampled population are different in their mtDNA. Gene identity between populations was calculated according to the relationship, Jij = Σxixj, for each pairwise combination of populations i and j. Mean diversity between populations is Hij = 1 − Jij. Hij has two elements, within-population variation HS and between-population variation Dij where Dij = Hij − HS and HS = (hei+ hej/2). The total diversity HT = HS + DST. DST estimates the mean diversity over all populations thus: DST = ΣDij/s2.
The absolute degree of gene differentiation is estimated by Dm = sDst/(s − 1) and is independent of gene diversity within populations. It measures the average minimum genetic distance between populations. The relative magnitude of gene differentiation among populations is GST = Dm/HT and is also unbiased by population diversity and size. GST is analogous to Wright’s FST. It is, however, constructed in terms of ratios of heterozygosities (which do not obtain at mitochondrial loci), while Wright’s and Weir’s measures are cast in terms of expectations and probabilities. Nei’s statistics were computed by using a spreadsheet.
Estimates based on the foregoing models allow estimates of the average amount of gene flow among populations by using Wright’s (1951) island model of population structure. The mean number of migrant females exchanged among popula-tions per generation Nm can be obtained from the relationship, GST or FST ≈ (2Nm + 1)−1 rearrangement of which leads to Nm ≈ (1 − FST)/2FST.
The pattern of relationships among populations was examined by using Wright’s (1978) modification of Roger’s genetic distance measure. Here distance D between population pairs x and y summed over k alleles = [0.5 ΣK (qx − qy)2]1/2. Now FST = [1/L ΣLD2]1/2 for L loci. Biosys-1 was used to do the foregoing computations.
The data are presented in single locus and combined formats. The combined format is given because mitochondrial loci are in complete linkage disequilibrium. The alleles at any particular locus are not independent of alleles at the other loci, but are fixed and inherited matrilineally.
Results
Seven populations of 18–39 flies each were examined at four loci and eight populations were examined at two loci (Table 3). Amplification of 16S1 and COI consistently failed in the Changara sample. A total of 18 alleles was found among the four loci. Four alleles were confined to only one population. Each locus was polymorphic in the Kakumbi and Mana Pools samples. An hypothesis of homogeneity in allele frequencies between the lab cultures, summed over all loci, was strongly rejected (χ[6]2 = 106.6, P ≈ 0) but the 16S1 allele frequencies were homogeneous. Lab A flies were strongly differentiated from all other samples. A high degree of differentiation at each locus was observed among all populations (χ[92]2 = 449.6, P ≈ 0). Considered apart from the lab cultures, the wild populations also were greatly differentiated (χ[65]2 = 312, P ≈ 0). Three geographically clustered samples that lie on a 90-km transect on the Zambezi escarpment in north-eastern Zimbabwe differed significantly from each other in allele frequencies (χ[24]2 = 151.9, P ≈ 0).
Table 3.
Sample sizes and allele frequencies at mitochondrial loci in G. m. morsitans.
| Locus & allele | Lab A | LabB | Kakumbi | Mana Angwa | Reko-mitjie | Mana Pools | Makuti | Changara |
|---|---|---|---|---|---|---|---|---|
| 12S | ||||||||
| n | 24 | 24 | 18 | 24 | 24 | 37 | 24 | 9 |
| A | 1.000 | 0.000 | 0.278 | 1.000 | 0.042 | 0.676 | 0.000 | 0.111 |
| B | 0.000 | 1.000 | 0.694 | 0.000 | 0.792 | 0.270 | 0.729 | 0.667 |
| C | 0.000 | 0.000 | 0.000 | 0.000 | 0.167 | 0.027 | 0.271 | 0.222 |
| D | 0.000 | 0.000 | 0.056 | 0.000 | 0.000 | 0.027 | 0.000 | 0.000 |
| 16S1 | ||||||||
| n | 24 | 24 | 18 | 24 | 24 | 39 | 24 | 0 |
| A | 0.750 | 0.500 | 0.389 | 0.833 | 0.521 | 0.462 | 0.625 | |
| B | 0.250 | 0.500 | 0.500 | 0.000 | 0.479 | 0.154 | 0.000 | |
| C | 0.000 | 0.000 | 0.000 | 0.083 | 0.000 | 0.051 | 0.375 | |
| D | 0.000 | 0.000 | 0.111 | 0.083 | 0.000 | 0.333 | 0.000 | |
| 16S2 | ||||||||
| n | 24 | 24 | 18 | 12 | 24 | 24 | 24 | 24 |
| A | 0.000 | 0.000 | 0.000 | 0.250 | 0.000 | 0.000 | 0.000 | 0.000 |
| B | 1.000 | 0.708 | 0.889 | 0.708 | 1.000 | 0.542 | 1.000 | 1.000 |
| C | 0.000 | 0.000 | 0.111 | 0.042 | 0.000 | 0.042 | 0.000 | 0.000 |
| D | 0.000 | 0.000 | 0.000 | 0.000 | 0.000 | 0.417 | 0.000 | 0.000 |
| E | 0.000 | 0.292 | 0.000 | 0.000 | 0.000 | 0.000 | 0.000 | 0.000 |
| CO1 | ||||||||
| n | 24 | 24 | 18 | 24 | 24 | 24 | 24 | 0 |
| A | 0.917 | 0.667 | 0.778 | 1.000 | 0.729 | 0.313 | 0.875 | |
| B | 0.000 | 0.000 | 0.000 | 0.000 | 0.000 | 0.354 | 0.000 | |
| C | 0.042 | 0.333 | 0.167 | 0.000 | 0.042 | 0.042 | 0.125 | |
| D | 0.000 | 0.000 | 0.000 | 0.000 | 0.208 | 0.167 | 0.000 | |
| E | 0.042 | 0.000 | 0.056 | 0.000 | 0.000 | 0.042 | 0.000 |
The distribution of the combined haplotypes (Table 4) shows 16 unshared of 27 combinations (59%) and each population, including the laboratory cultures, had at least two ‘private’ haplotypes. Of the 27 haplotypes, eight (30%) were singular. Haplotypes 1, 2 and 3 accounted for 52% of the total. Wild tsetse showed a mean 7.6 haplotypes and lab tsetse showed a mean 4.5 haplotypes.
Table 4.
Haplotype diversity in G. m. morsitans over four loci.
| Haplotype | Rekomitjie | M. Angwa | M. Pools | Makuti | Kakumbi | Lab A | LabB | Totals |
|---|---|---|---|---|---|---|---|---|
| 1 | 6 | 13 | 5 | 11 | 3 | 0 | 3 | 41 |
| 2 | 6 | 0 | 1 | 0 | 4 | 0 | 12 | 23 |
| 3 | 0 | 0 | 1 | 0 | 0 | 17 | 0 | 18 |
| 4 | 0 | 0 | 7 | 0 | 0 | 0 | 0 | 7 |
| 5 | 0 | 2 | 1 | 4 | 0 | 0 | 0 | 7 |
| 6 | 0 | 6 | 0 | 0 | 0 | 0 | 0 | 6 |
| 7 | 0 | 0 | 0 | 0 | 0 | 5 | 0 | 5 |
| 8 | 0 | 0 | 1 | 2 | 0 | 0 | 2 | 5 |
| 9 | 2 | 0 | 1 | 2 | 0 | 0 | 0 | 5 |
| 10 | 0 | 0 | 1 | 0 | 3 | 0 | 0 | 4 |
| 11 | 3 | 0 | 1 | 0 | 0 | 0 | 0 | 4 |
| 12 | 0 | 2 | 0 | 0 | 2 | 0 | 0 | 4 |
| 13 | 0 | 0 | 0 | 4 | 0 | 0 | 0 | 4 |
| 14 | 0 | 0 | 0 | 0 | 0 | 0 | 4 | 4 |
| 15 | 0 | 0 | 0 | 0 | 2 | 1 | 0 | 3 |
| 16 | 0 | 0 | 3 | 0 | 0 | 0 | 0 | 3 |
| 17 | 1 | 0 | 0 | 0 | 1 | 0 | 0 | 2 |
| 18 | 2 | 0 | 0 | 0 | 0 | 0 | 0 | 2 |
| 19 | 2 | 0 | 0 | 0 | 0 | 0 | 0 | 2 |
| 20 | 0 | 0 | 0 | 0 | 0 | 1 | 0 | 1 |
| 21 | 0 | 0 | 1 | 0 | 0 | 0 | 0 | 1 |
| 22 | 0 | 0 | 0 | 0 | 1 | 0 | 0 | 1 |
| 23 | 0 | 1 | 0 | 0 | 0 | 0 | 0 | 1 |
| 24 | 0 | 0 | 0 | 0 | 0 | 0 | 1 | 1 |
| 25 | 0 | 0 | 0 | 0 | 1 | 0 | 0 | 1 |
| 26 | 0 | 0 | 0 | 1 | 0 | 0 | 0 | 1 |
| 27 | 0 | 0 | 0 | 0 | 1 | 0 | 0 | 1 |
| Sum | 22 | 24 | 23 | 24 | 18 | 24 | 22 | 157 |
Unbiased estimates of diversity at each locus, he, ranged from 0 to 0.72 in samples (Table 5). Diversity is the probability that two randomly chosen flies have different haplotypes. 16S1 was polymorphic within each population (but was not resolved in Changara flies) and 16S2 was monomorphic in four populations. Lab A flies showed the least average single locus diversity and the Mana Pools sample showed the most. Considering haplotypes as the alleles at four loci to give combined estimates, Kakumbi flies showed the most diversity (Table 5) and Lab A the least. Single locus haplotype diversity, averaged over loci in the six feral populations, was 0.353 ± 0.039. Diversity combined over loci was 0.738 ± 0.058 for seven populations and 0.805 ± 0.045 for the five natural populations; mean diversity in the lab cultures was 0.571. Combined diversity was greater because there were eighteen alleles taken four at a time to form each haplotype.
Table 5.
Genetic diversities he at mitochondrial loci in G. m. morsitans populations.
| Haplotype | Kakumbi | Rekomitjie | Makuti | Mana Pools | Mana Angwa | Changara | Lab A | Lab B |
|---|---|---|---|---|---|---|---|---|
| 12S | 0.503 | 0.359 | 0.380 | 0.482 | 0 | 0.556 | 0 | 0 |
| 16S1 | 0.621 | 0.522 | 0.489 | 0.667 | 0.304 | – | 0.387 | 0.522 |
| 16S2 | 0.111 | 0 | 0 | 0.554 | 0.453 | 0 | 0 | 0.431 |
| COI | 0.386 | 0.423 | 0.228 | 0.723 | 0 | – | 0.163 | 0.416 |
| Average1 | 0.408 | 0.323 | 0.276 | 0.609 | 0.189 | 0.278 | 0.136 | 0.347 |
| Combined2 | 0.909 | 0.844 | 0.750 | 0.866 | 0.656 | – | 0.471 | 0.671 |
Mean of the four loci.
Haplotypes defined by alleles at the four loci. Two loci failed to amplify in Changara tsetse hence there are no data for them.
Application of Chakraborty’s (1990) amalgamation test for selective neutrality to the combined haplotype frequencies in each sample showed no significant deviations in the observed from expected frequencies (P > 0.25 or greater). Thus, there was no evidence for the operation of selection in field or laboratory tsetse.
The average pairwise haplotype diversity DST between the natural populations was 0.122 and varied at loci from 0.065 at 16S2 to 0.23 at 12S. The estimate for combined loci was 0.09, not significantly different from GST and FST estimates (Table 6).
Table 6.
Average gene diversity HS, total diversity HT, coefficient of gene differentiation DST, absolute degree of gene differentiation over all populations Dm, the relative amount of gene differentiation GST, and Wright’s correlation of allele frequencies within populations relative to the total FST in six feral G. m. morsitans populations.
| Locus
|
Loci
|
|||||
|---|---|---|---|---|---|---|
| Statistic | 12S | 16S1 | 16S2 | COI | Average | combined1 |
| HS | 0.382 | 0.521 | 0.186 | 0.352 | 0.347 | 0.805 |
| HT | 0.612 | 0.628 | 0.251 | 0.427 | 0.459 | 0.895 |
| DST | 0.230 | 0.108 | 0.065 | 0.075 | 0.112 | 0.090 |
| Dm | 0.276 | 0.128 | 0.078 | 0.088 | 0.134 | 0.108 |
| GST | 0.376 | 0.171 | 0.259 | 0.175 | 0.245 | 0.101 |
| FST | 0.373 | 0.217 | 0.229 | 0.218 | 0.271 | 0.084 |
In which haplotypes are defined by alleles at the four loci. There are only five populations in the combined sample because Changara did not amplify at two loci.
Wright’s (1978) fixation index FST measures the correlation of alleles within populations relative to the total (Table 6). Among the six feral populations, FST = 0.271, averaged over the four loci, leading to an estimated equivalent 1.3 females exchanged per population per generation. When the laboratory cultures were included, FST became 0.371 when averaged over loci. Nei’s (1987) GST is supposed to measure the same thing as FST. GST showed more interlocus variation than did FST. When averaged over loci, GST = 0.245, leading to an equivalent of 1.5 females exchanged per population.
Rather different estimates were obtained from the combined data set. For the natural populations, FST = 0.088 ± 0.016, and GST = 0.101, giving theoretical mean exchange rate estimates of 5.2 and 4.5 females, respectively. The small differences between FST and GST are not biologically significant. The difference in FSTs between the averaged loci and combined data set is substantial and caused largely by the inclusion of Changara in the former. Because two loci did not amplify in Changara tsetse, no comparable diversity combined over loci was obtained. The higher values of population differentiation obtained when Changara is included indicate that this population is more greatly differentiated from the others than the Zimbabwe–Zambia populations are from each other.
Analysis of variance (Table 7) on haplotype frequencies in the Zimbabwe–Zambia populations and laboratory cultures indicates that 9.7% of the total variance lay between the laboratory cultures and five natural populations, and 15.4% lay among populations within the two groups. Of the total variance, 75% was within the seven populations. Table 7 gives the associated hierarchical F statistics which show large values at the three levels. When haplotypes of only the five natural populations are considered, among-population variance becomes 8.8% of the total and FST = 0.088, considerably less than the estimate of FST = 0.25 obtained when the laboratory cultures are included.
Table 7.
Analysis of variance in haplotype frequencies by the method of Excoffier et al. (1992). All haplotypes are considered equidistant.
| Source | d.f. | Variance | % of total | F statistics | Significance1 |
|---|---|---|---|---|---|
| Among groups2 | 1 | 0.0471 | 9.7 | FGT = 0.097 | <0.05 |
| Among populations, within groups | 5 | 0.0751 | 15.4 | FSG = 0.171 | < 0.0001 |
| Within populations | 150 | 0.3649 | 74.9 | FST = 0.251 | < 0.0001 |
| Total | 156 | 0.4871 |
Probability of obtaining a greater variance and F by chance.
Groups are laboratory cultures and natural populations.
Genetic distances between pairs of populations (Table 8) show that Lab A was the most differentiated. Lab A allele frequencies were most closely related to those in the Mana Angwa flies. Lab B showed the strongest affinity with Kakumbi and Rekomitjie flies but the overall degree of differentiation of lab flies from the wild tsetse was greater than any pairwise degree of differentiation between natural populations. Probably more than genetic drift separates the lab cultures from the natural populations sampled.
Table 8.
Wright’s (1978) estimates of genetic distance. Upper diagonal: pairwise number of migrants.* The lower diagonal shows Roger modified genetic distances on basis of haplotypes combined over four loci.
| Lab A | Lab B | Kakumbi | Mana Angwa | Rekomitjie | Mana Pools | Makuti | |
|---|---|---|---|---|---|---|---|
| Lab A | – | 0.66 | 1.09 | 0.65 | 0.95 | 1.41 | 0.78 |
| Lab B | 0.674 | – | 1.98 | 1.14 | 1.72 | 1.91 | 1.79 |
| Kakumbi | 0.584 | 0.327 | – | 3.18 | 28.30 | 7.36 | 4.28 |
| Mana Angwa | 0.678 | 0.540 | 0.397 | – | 3.63 | 3.21 | 10.06 |
| Rekomitjie | 0.609 | 0.302 | 0.244 | 0.368 | – | 6.67 | 5.64 |
| Mana Pools | 0.574 | 0.457 | 0.322 | 0.388 | 0.320 | – | 5.16 |
| Makuti | 0.644 | 0.500 | 0.368 | 0.253 | 0.324 | 0.335 | – |
Average no. migrants = (1 − FST)/2FST.
Pairwise FSTs for the natural populations, when converted to a theoretical number of female migrants exchanged per generation, indicated three or more exchanges between any two natural populations. Changara, in all likelihood, would have shown much greater genetic distances from the Zimbabwe and Zambia populations and exchange rates less than one. Inspection of Table 8 suggests no obvious relationship between the magnitudes of genetic distance or migrant numbers and geographical distance among the natural populations.
Discussion
The SSCP method worked well in estimating variation at mitochondrial loci in a large number of samples. Among morsitans group tsetse, sequencing showed that of 20 sequence variants, 18 were readily detected on silver-stained acrylamide gels. This success rate of 90% is much greater than the 25–30% of amino acid substitutions that can be detected in allozyme studies. A bigger problem than missing sequence variants is outright failure of the PCR reaction. Amplification of 16S1 and COI consistently failed in the Changara sample and there was limited amplification at the 12S locus. Failure to amplify could have been caused by the vagaries of PCR but it was more likely caused by mutations of nucleotides at primer annealing sites in Changara flies. Nevertheless, for studying gene flow among populations, the ability to estimate allele frequencies in a large number of organisms is paramount.
There was much sequence variation in tsetse fly mitochon-dria as shown by diversity estimates that varied from 0.19 to 0.61 in the wild populations. COI was the most variable locus and 16S2 the least. Within-population diversities were substantial and no sample was monomorphic at more than two of four loci. The Lab A sample showed the least diversity but Lab B diversity was comparable to the samples from field populations. Lab A shared each of its alleles with at least one other population. The origins of both cultures are obscure, but Lab A is probably the oldest because it shows the least diversity, a consequence of drift (selective neutrality tests ruled out the operation of selection). It may be a subculture of the original G. m. morsitans colonized in Langford (Bristol, England) with puparia collected from Kariba in Zimbabwe (Jordan, 1970), not far from Rekomitjie. Neither tsetse culture showed evidence of inbreeding, testifying to the effective maintenance of multiple maternal lines.
Mitochondrial diversities were greatest in tsetse from Mana Angwa and Kakumbi, riverside locations where mammals aggregate during the dry seasons. The animals arrive from large areas and probably bring many tsetse with them, thereby effectively increasing the tsetse sampling area.
The mitochondrion is inherited as a unit in which there is no recombination. When loci were combined, 27 haplotypes were obtained. There would be 400 possible haplotypes were alleles at the four independent loci. By subtracting out the haplotypes found only in the laboratory cultures we obtain a distribution of twenty-three variants found in the natural populations. We are unable to arrange the haplotypes into a phylogenetic tree until further sequencing is accomplished.
The partitioning of haplotype variation into within and among population components shows how female morsitans populations are structured. Diversities among populations are proportional to the degree of genetic differentiation and this was estimated by several statistics. These statistics should be examined with respect to the geographical distribution of the subject G. m. morsitans populations. Of the four allopatric G. m. morsitans belts, we have samples from only two. Unfortunately, we were unable to obtain amplifications at two loci from the Changara sample, the only representative of the southern belt. The failure to obtain amplifications in Changara samples may have been caused by mutations at primer annealing sites and if so would indicate genetic distances from the western populations greater than our estimates provided.
GST and FST were about 2.5-fold greater in magnitude when averaged over loci than when combined. Twenty-seven haplotypes distributed among 157 flies showed less among-population variance than four and five haplotypes (alleles) averaged over four tightly linked loci. The combined haplotypes provide the best estimate but does not include Changara for reasons already stated. Sample size was further reduced because some flies in each sample failed to give reactions at one of the four loci.
FST and GST estimate the same thing but are different in their derivations. The differences between FST and GST estimates were minor. Wright (1978) and Weir (1996) developed their models in terms of probabilities and expecta-tions and this would seem to be most appropriate for haploid data; their models, moreover, make fewer assumptions about the evolutionary forces acting on allele frequencies (Weir, 1996).
Wright (1978) emphasized that FST measures the ‘extent to which the process of fixation [of alleles] has gone toward completion.’ The inverse, where mutation rates are negligible, is a measure of gene flow among populations. Thus, for FST = 0.088 the equivalent average is approximately five females exchanged per population. One exchange per generation is usually considered to provide the critical amount of gene flow below which gene frequencies would eventually drift to fixation. However, the FST estimate assumes populations at equilibrium, but G. m. morsitans has achieved its present distribution by advancing from one or more refugia in the Zambezi valley (Ford, 1971). Thus, there may be much less gene flow among populations than indicated by FST measures.
Because only two of the four broad G. m. morsitans fly belts were included in the present study, it would be important to sample transects through the Tanzania, Mozambique, Malawi and southern Mozambique belts. To do so would provide a greatly improved picture of the degrees of isolation among populations in these regions.
In summary, data show substantial differentiation among the sampled populations, a consequence of drift. This is not altogether surprising considering the comparatively small effective population sizes and fragmented distributions of G. m. morsitans. In terms of the equivalent number of migrants, however, the magnitude of FST from mitochondrial loci must be twice that estimated from genomic loci. Thus, our FST estimates may indicate considerable gene flow among popula-tions, but we have estimated gene flow on the basis of maternal lineages only. Males may be more subject to dispersal than the females. It therefore will be most interesting to evaluate gene flow for the same samples on the basis of genomic sequences. We are now developing microsatellite loci for just such an investigation.
Acknowledgments
Drs Steve Mihok and Paul Ndegwa kindly provided the G. morstans laboratory cultures. Research supported in part by USPHS grant no. AI40048. This is Journal Paper no. 18087 of the Iowa Agricultural and Home Economics Experiment Station, Project 3447, and supported in part by Hatch Act and State of Iowa funds. Nigel Griffiths was supported by Overseas Development Administration Project F0049.
References
- Avise JC. Molecular Markers, Natural History and Evolution. Chapman & Hall; London: 1994. [Google Scholar]
- Bailey AL. Single-stranded conformational polymorphisms. In: Innis MA, Gelfand DH, Sninsky JJ, editors. PCR Strategies. Academic Press, Inc.; New York: 1995. pp. 121–129. [Google Scholar]
- Black WC, DuTeau NM. RAPD-PCR and SSCP analysis for insect population genetic studies. In: Crampton JM, Beard CB, Louis C, editors. Molecular Biology of Insect Disease Vectors: a Methods Manual. Chapman & Hall; London: 1996. pp. 361–383. [Google Scholar]
- Chakraborty R. Mitochondrial DNA polymorphism reveals hidden heterogeneity within some Asian populations. American Journal of Human Genetics. 1990;47:87–94. [PMC free article] [PubMed] [Google Scholar]
- Cotton RGH. Mutation Detection. Oxford University Press; Oxford: 1996. pp. 32–58. [Google Scholar]
- Excoffier L, Smouse PE, Quattro JM. Analysis of molecular variance inferred from metric distances among DNA haplotypes: application to human mitochondrial DNA restriction data. Genetics. 1992;131:479–491. doi: 10.1093/genetics/131.2.479. [DOI] [PMC free article] [PubMed] [Google Scholar]
- Ford J. The Role of the Trypanosomiases in African Ecology. Clarendon Press; Oxford: 1971. [Google Scholar]
- Gilbert DG. SeqApp, a biological and sequence editor and analysis program for Macintosh computers. 1992 Published, electronically on the Internet, available at ftp://iubio.bio.indiana.edu/molbio/seqapp/
- Gooding RH. Genetic variation in tsetse flies and implications for trypanosomiasis. Parasitology Today. 1992;8:92–95. doi: 10.1016/0169-4758(92)90246-x. [DOI] [PubMed] [Google Scholar]
- Haiti DL. A Primer of Population Genetics. 2. Sinauer Associates Inc.; Sunderland, MA: 1988. [Google Scholar]
- Hiss RH, Norris DE, Dietrich CH, Whitecomb RF, West DF, Bosio CF, Kambhampati S, Piesman J, Antolin MF, Black WC. Molecular taxonomy using single-strand conformational polymorphism (SSCP) analysis of mitochondrial ribosomal DNA genes. Insect Molecular Biology. 1994;3:171–182. doi: 10.1111/j.1365-2583.1994.tb00164.x. [DOI] [PubMed] [Google Scholar]
- Jordan AM. Forty generations of inbreeding of G. morsitans morsitans Westwood (Diptera: Glossinidae) Bulletin of Entomological Research. 1970;70:557–562. [Google Scholar]
- Jordan AM. Tsetse-flies (Glossinidae) In: Lane RP, Crosskey RW, editors. Medical Insects and Arachnids. Chapman & Hall; New York: 1993. pp. 333–382. [Google Scholar]
- Krafsur ES, Griffiths N. Genetic variation at structural loci in the Glossina morsitans species group. Biochemical Genetics. 1997;35:1–11. doi: 10.1023/a:1022252311715. [DOI] [PubMed] [Google Scholar]
- Krafsur ES, Griffiths N, Brockhouse CL, Brady J. Breeding structure of G. pallidipes (Diptera: Glossinidae) populations in East and southern Africa. Bulletin of Entomological Research. 1997;87:67–73. [Google Scholar]
- Nei M. Molecular Evolutionary Genetics. Columbia University Press; New York: 1987. [Google Scholar]
- Rogers DJ, Randolph SE. Population ecology of tsetse. Annual Review of Entomology. 1985;30:197–216. doi: 10.1146/annurev.en.30.010185.001213. [DOI] [PubMed] [Google Scholar]
- Schneider S, Kueffer J-M, Roessli D, Excoffier L. Arlequin, Version 1.1: A Software for Population Genetic Data Analysis. Genetics and Biometry Laboratory, University of Geneva; Switzerland: 1997. [Google Scholar]
- Simon C, Frati F, Beckenbach A, Crespi B, Liu H, Flook P. Evolution, weighting, and phylogenetic utility of mitochon-drial gene sequence and a compilation of conserved polymerase chain reaction primers. Annals of the Entomology Society of America. 1994;87:651–701. [Google Scholar]
- Swofford DL, Selander RB. biosys-1: a fortran program for the comprehensive analysis of electrophoretic data in population genetics and systematics. Journal of Heredity. 1981;72:281–283. [Google Scholar]
- Torr SJ, Parker AG, Leigh-Brown G. The responses of Glossina pallidipes Austen (Diptera: Glossinidae) to odour-baited traps and targets in Somalia. Bulletin of Entomological Research. 1989;79:99–108. [Google Scholar]
- Weir B. Genetic Data Analysis II. Sinauer Associates Inc; Sunderland, MA: 1996. [Google Scholar]
- Weir B, Cockerham CC. Estimating F-statistics for the analysis of population structure. Evolution. 1984;38:1358–1370. doi: 10.1111/j.1558-5646.1984.tb05657.x. [DOI] [PubMed] [Google Scholar]
- Wright S. The genetical structure of populations. Annals of Eugenics. 1951;15:323–354. doi: 10.1111/j.1469-1809.1949.tb02451.x. [DOI] [PubMed] [Google Scholar]
- Wright S. Evolution and the Genetics of Populations, Vol 4 Variability Within and Among Natural Populations. University of Chicago Press; Chicago: 1978. [Google Scholar]