

Abstract
Background
Case fatality rates following acute myocardial infarction (MI) have decreased markedly over the last three decades. Some subgroups may have benefited more than others, but this hypothesis has not been evaluated in a large nationally-representative cohort. Accordingly, we sought to assess long-term temporal trends in mortality following hospitalization for MI and to assess whether these trends differ by gender, race, or age in a cohort of elderly patients.
Methods
We studied a cohort of 4.9 million Medicare beneficiaries ≥65 years hospitalized for MI between 1984 and 2003 and calculated the proportion that died in-hospital, within 30 days and within 1 year of hospitalization. We used multivariable risk models to estimate relative and absolute changes in case fatality rate according to race, gender, and age groups.
Results
After adjustment for age, gender, and race, between 1984 and 2003 there was a 54.3% (95% CI: 53.7, 54.8), 39.7% (39.1, 40.3%), and 23.0% (22.5, 23.5) reduction in the risk of inhospital, 30-day, and 1-year mortality, respectively. Relative and absolute reductions were greater in whites than blacks, with the biggest differences observed for 1-year mortality. Small and inconsistent differences were seen by gender after stratifying by race. Patients aged ≥ 90 years experienced the smallest relative reductions in case fatality rates, with the biggest differences observed for 1-year mortality.
Conclusions
Among US Medicare beneficiaries, short-term MI case fatality rates have decreased significantly in all groups, but more so among whites than blacks. Additional studies are needed to clarify the basis for these observations.
Keywords: Myocardial infarction, mortality, case fatality rate, Medicare, elderly, temporal trends
Introduction
In-hospital and short-term mortality following acute myocardial infarction (MI) have decreased markedly over the last three decades,1 reflecting in part the introduction, improvement, and increased utilization of cardiac reperfusion procedures including thrombolytic therapy and percutaneous coronary intervention, and adjunctive therapies such as aspirin and β blockers.2-4 However, there is evidence to suggest that some patient groups have benefited more than others. For example, data from the Worcester Heart Attack Study indicate greater relative reductions in case fatality rates among patients aged <65 as compared to those aged ≥65 years,5 and among non-Hispanic whites as compared to Hispanics.6
While improvements in MI case fatality rates have been reported across all age groups, few studies have evaluated in detail the secular trends in case fatality rates among elderly patients aged ≥65 years. Studying this segment of the population is of inherent interest given its current size and the coming of age of the baby-boomer generation in the years ahead. In 2000, the elderly made up just over 12 percent of the US population, but this proportion is expected to grow to 21% by 2050. Moreover, 65% of all hospitalizations for MI7 and 80% of all MI deaths occur among the elderly.8
Accordingly, we evaluated temporal trends in case fatality rates in a nationally-representative cohort of 4.9 million elderly patients hospitalized for MI during the 20 year period between 1984 and 2003, and assessed whether these trends differed by gender, race, or age.
Methods
Medicare is a US federal health insurance program which reimburses in-patient costs for most citizens and permanent residents aged ≥65 years. We obtained administrative data for all claims submitted to the Centers for Medicare and Medicaid Services by US short-stay hospitals for services provided to Medicare beneficiaries. For each hospitalization, we obtained data on age, gender, race, admission date, discharge date, length of stay, date of death, principal discharge diagnosis (coded according to the International Classification of Diseases, Ninth Revision, Clinical Modification (ICD-9-CM), and discharge status. The principal discharge diagnosis is defined as the ICD-9-CM diagnosis code identifying the diagnosis, condition, problem or other reason for the admission shown in the medical record to be chiefly responsible for the services provided. The date of death field is derived from the Medicare enrollment database and cross-referenced with the Social Security Administration’s Master Beneficiary Record which has been shown to have a high sensitivity and specificity.9, 10 A small number (<1%) of duplicate claims were identified and removed. Patients hospitalized for MI and transferred one or more times were identified and treated as a single admission with the date of admission derived from the initial admission record, and the date of discharge, discharge status, and date of death derived from the last admission record. This study was approved by the Institutional Review Board of the Beth Israel Deaconess Medical Center.
The study population consisted of Medicare beneficiaries aged ≥65 years hospitalized between 1984 and 2003 with a primary discharge diagnosis of MI (ICD-9-CM: 410.xx). This case definition has been shown to have a high positive predictive value which has been stable over time.11, 12 We defined in-hospital case fatality rate as the proportion of hospitalized patients who were discharged dead. We defined 30-day and 1-year case fatality rates as the proportion of hospitalized patients whose date of death was 30 or 365 days after the date of admission, respectively. The race of each patient was coded as white, black, or other (which included Hispanic, Asian, North American Native, other, unknown, or missing). The positive predictive value for white or black race has been shown to be >95% for each over this time period.13 All analyses were restricted to patients identified as either black or white because the group identified as ‘other’ represents a poorly defined heterogeneous population that together made up <5% of hospitalizations.
Overall Trends
Crude case fatality rates were calculated for each year between 1984 and 2003. We used risk ratio (i.e.: log-binomial) regression models14 to estimate relative changes in case fatality rates adjusting for age (6 categories: 65-69, 70-74, 75-79, 80-84, 85-89, ≥90), race (white, black), and gender. Specifically, we modeled the probability of death as a function of age, race, and gender assuming a multiplicative model. This modeling approach is appropriate since the parameter of interest in this setting is the risk ratio rather than the odds ratio as might be estimated from a logistic regression model.
Trends by Race and Gender
We estimated race - and gender-specific case fatality rates standardized to the age distribution of the entire US population in 2000, as estimated by the 2000 US decennial census. Separately, we used multivariable risk models to estimate absolute (binomial regression) and relative (log-binomial regression) changes in MI case fatality rate between 1984 and 2003 by race and gender, adjusting for age.14
Trends by Age Group
We estimated age - specific case fatality rates standardized to the race and gender distribution of the US population aged ≥65 years, as estimated by the 2000 US decennial census. Separately, we used multivariable risk models to estimate absolute (binomial regression) and relative (log-binomial regression) changes in MI case fatality rate between 1984 and 2003 by age group, adjusting for race and gender.14
Analyses were performed using SAS version 9 (SAS Institute Inc., Cary, North Carolina). Multivariable risk models were fit using the GENMOD procedure and all models were checked to ensure that predicted probabilities fell between 0 and 1.14 In all models the unit of analysis was individual hospitalizations. All reported p values are based on 2-sided tests at the α = 0.05 level.
Results
Between 1984 and 2003, there were more than 6.8 million hospitalizations in the US with a principle discharge diagnosis of MI among Medicare beneficiaries aged ≥ 65 years. After excluding cases with race other than white or black, accounting for duplicate records, and accounting for hospital transfers, 5.9 million hospitalizations among 4.9 million unique individuals were available for analysis. The majority (84.1%) of patients were hospitalized for MI only once during the observation period. Among the remaining patients, the median number of hospitalizations was 2.
Overall Trends
Crude in-hospital, 30-day, and 1-year MI case fatality rates decreased throughout the 20 year observation period (Table 1). For example, crude 30-day mortality decreased from 25.3% in 1984 to 17.2% in 2003. Hospitalized patients were predominantly white with approximately equal numbers of men and women. Average age and the proportion of patients identified as black or women increased during the observation period. Length of hospital stay decreased monotonically from a mean of 11.2±13.8 days (mean±SD) (median: 10) in 1984 to 6.6±6.4 days (median: 5) in 2003.
Table I.
Characteristics of Medicare beneficiaries aged ≥65 years hospitalized with a primary discharge diagnosis of MI, 1984-2003.*
| 1984 | 1988 | 1991 | 1994 | 1997 | 2000 | 2003 | |
|---|---|---|---|---|---|---|---|
| Cases (n) | 268,646 | 270,312 | 284,949 | 307,041 | 315,746 | 308,106 | 305,038 |
| Male (%) | 51.7 | 50.8 | 51.2 | 51.2 | 50.6 | 49.3 | 49.6 |
| Age, years (mean ± SD) | 75.5 ± 7.1 | 76.0 ± 7.3 | 76.3 ± 7.4 | 76.4 ± 7.5 | 77.5 ± 7.6 | 78.4 ± 7.9 | 78.7 ± 8.2 |
| Race (%) | |||||||
| White | 94.6 | 94.3 | 94.1 | 93.8 | 93.4 | 92.8 | 92.2 |
| Black | 5.4 | 5.7 | 5.9 | 6.2 | 6.6 | 7.2 | 7.8 |
| Length of Stay, days (mean ± SD) | 11.2 ± 13.8 | 10.0 ± 12.1 | 10.0 ± 12.8 | 9.4 ± 15.6 | 8.5 ± 13.1 | 7.0 ± 7.2 | 6.6 ± 6.4 |
| Crude Mortality (%) | |||||||
| In-Hospital | 23.0 | 21.3 | 18.7 | 16.2 | 14.5 | 13.4 | 11.9 |
| 30-d | 25.3 | 24.1 | 21.3 | 19.4 | 18.1 | 18.1 | 17.2 |
| 1 yr | 40.2 | 38.8 | 35.7 | 33.5 | 33.0 | 35.0 | 34.5 |
Data shown for selected years only.
We used multivariable risk models to estimate the relative change in case fatality rates adjusting for age, gender, and race (Fig. 1). After adjustment, between 1984 and 2003 there was a 54.3% (95% CI: 53.7, 54.8), 39.7% (39.1, 40.3%), and 23.0 (22.5, 23.5) reduction in the risk of inhospital, 30-day, and 1-year mortality, respectively.
Figure 1.
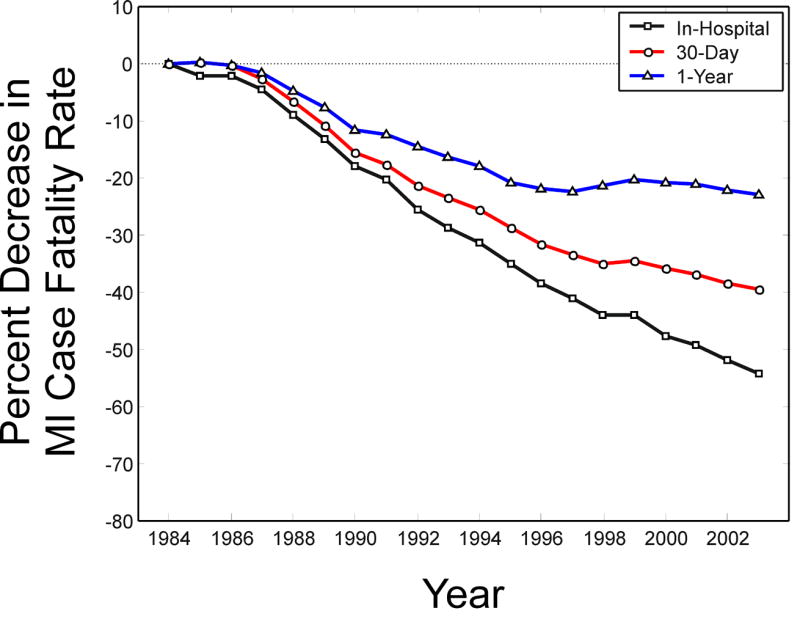
Trends in MI case fatality rates - Percent change in case fatality rate among Medicare beneficiaries aged ≥65 years hospitalized with a primary discharge diagnosis of MI between 1984 and 2003, adjusted for age, gender, and race using a multivariable risk model. Trends in 1-year (▲), 30-day (●), and in-hospital (■) mortality are shown.
Trends by Race and Gender
Age-standardized case fatality rates decreased substantially during the observation period regardless of race and gender (Fig. 2). Interestingly, between 1984 and the mid-1990s, in-hospital and 30-day case fatality rates were appreciably lower among blacks as compared to whites, while 1-year case fatality rates were only marginally lower in the initial years. The most pronounced and prolonged improvements in case fatality rates over time were observed for white men and women. For example, between 1984 and 2003, age-standardized 30-day mortality decreased from 25.2% to 14.3% in white men, from 25.2% to 14.4% in white women, from 20.9% to 15.5% in black men, and from 21.6% to 15.1% in black women. Similar results were evident when in-hospital or 1-year mortality was considered (Fig. 2).
Figure 2.
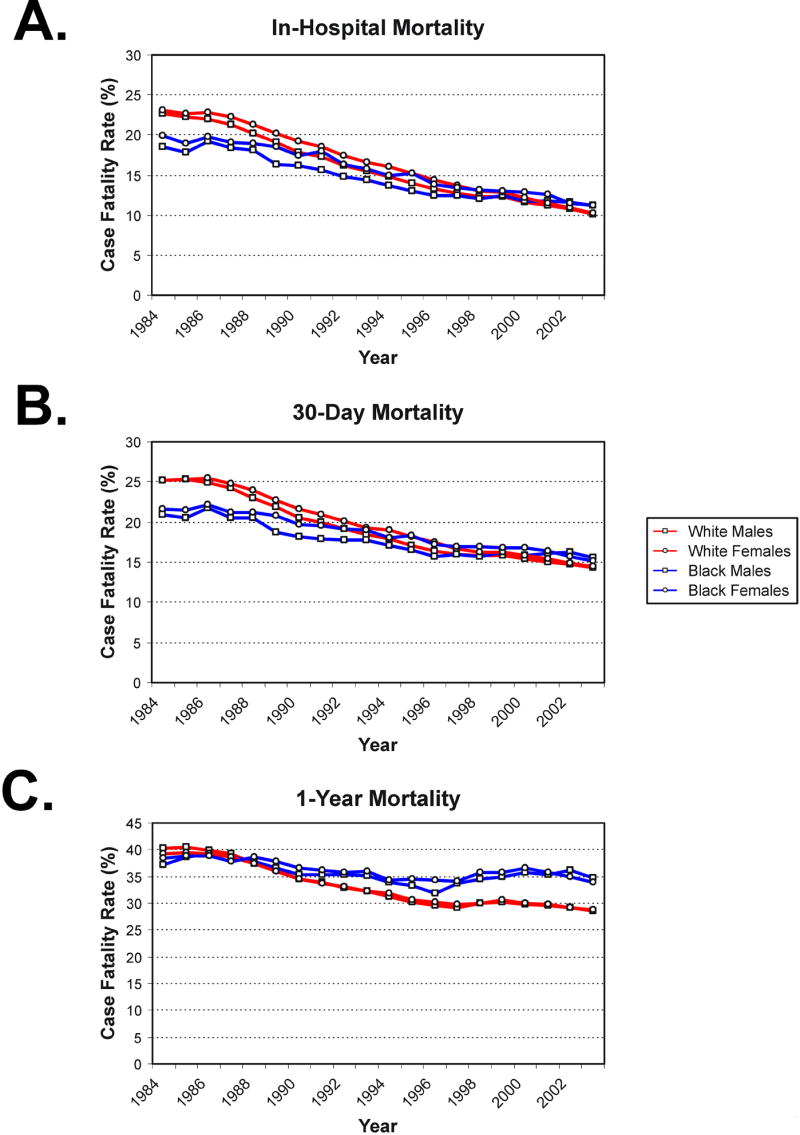
Trends by race and gender-Trends in MI case fatality rate among Medicare beneficiaries stratified by race and gender. Estimates are standardized to the overall age distribution of the US population using data from the 2000 US decennial census. Trends in (A) in-hospital, (B) 30-day, and (C) 1-year mortality are shown.
We used multivariable risk models to estimate absolute and relative changes in MI case fatality rate between 1984 and 2003 by race and gender (Table 2). Absolute and relative reductions in case fatality rates were significantly greater among whites than blacks regardless of gender. For example, white women experienced a 1.8-fold greater absolute reduction in 30-day case fatality rate and a 3-fold greater absolute reduction in 1-year mortality than that experienced by black women. Stratifying by race, only small and inconsistent differences were seen comparing men versus women, although some of these differences were statistically significant (Table 2).
Table II.
Absolute and relative reductions (95% CI) in MI case fatality rate among Medicare beneficiaries, 1984-2003, by race and gender.*
| In-Hospital
|
30-Day
|
1-Year
|
||||||||||
|---|---|---|---|---|---|---|---|---|---|---|---|---|
| 1984 Rate | 2003 Rate | Absolute Reduction |
Relative Reduction | 1984 Rate | 2003 Rate | Absolute Reduction |
Relative Reduction | 1984 Rate | 2003 Rate | Absolute Reduction |
Relative Reduction | |
| White Men | 22.7 | 10.1 | 11.8
(11.5, 12.1) |
55.0
(54.2, 55.8) |
25.2 | 14.3 | 10.5
(10.2, 10.8) |
41.9
(41.0, 42.8) |
40.3 | 28.7 | 11.5
(11.2, 11.8) |
26.2
(25.5, 26.9) |
| White Women | 23.1 | 10.3 | 13.4†
(13.1, 13.7) |
54.4
(53.7, 55.2) |
25.2 | 14.4 | 11.1†
(10.8, 11.4) |
39.0†
(38.1, 39.9) |
39.3 | 28.8 | 10.3†
(10.0, 10.7) |
21.6†
(20.8, 22.3) |
| Black Men | 18.6 | 11.2 | 6.6†
(5.5, 7.7) |
39.2†
(34.4, 43.6) |
20.9 | 15.5 | 4.9†
(3.7, 6.1) |
25.2†
(20.1, 30.0) |
37.2 | 34.8 | 2.0†
(0.5, 3.4) |
5.0†
(1.1, 8.8) |
| Black Women | 20.0 | 11.2 | 8.7†‡§
(7.6, 9.7) |
42.7††
(39.0, 46.1) |
21.6 | 15.1 | 6.2†‡
(5.0, 7.3) |
27.1†‡
(23.0, 31.0) |
38.5 | 33.8 | 3.4†‡
(2.1, 4.8) |
8.0†‡
(4.9, 11.1) |
Case fatality rates (%) are age-standardized. Absolute and relative reductions in the case fatality rate are expressed as percent change and estimated from regression models adjusting for age.
p<0.05 as compared to white men.
p<0.05 as compared to white women.
p<0.05 as compared with black men.
Trends by Age Group
Race-and gender-standardized case fatality rates increased monotonically with advancing age regardless of calendar year (Fig. 3). Temporal reductions in standardized case fatality rates were observed in all age groups. For example, between 1984 and 2003, standardized 30-day mortality decreased from 17.4% to 10.2% among patients 65-69 years old, and from 41.3% to 31.7% among patients 90 years and older.
Figure 3.
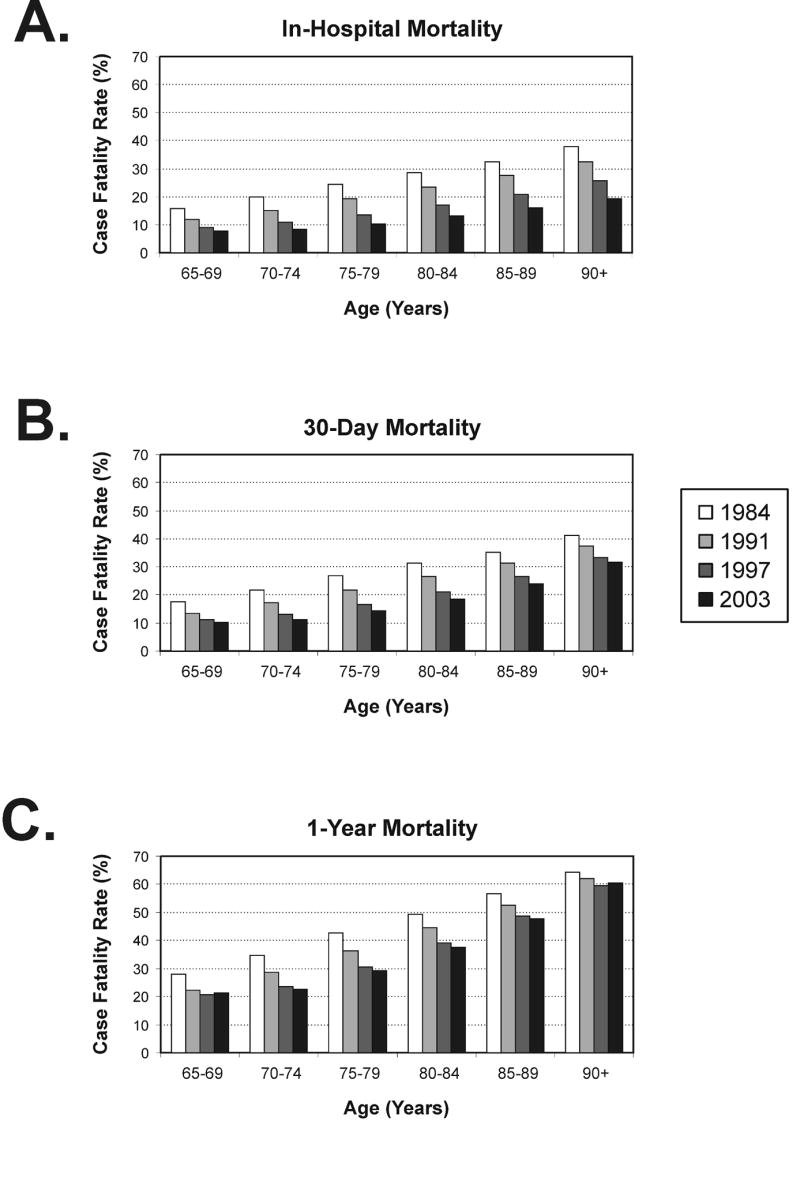
Trends by age group - Trends in MI case fatality rate among Medicare beneficiaries by age group. Estimates are standardized to the gender and race distribution of the US population aged ≥ 65 years using data from the 2000 US decennial census. Trends in (A) in-hospital, (B) 30-day, and (C) 1-year mortality are shown.
We used multivariable risk models to estimate absolute and relative changes in case fatality rate between 1984 and 2003 by age group, adjusting for race and gender (Table 3). For in-hospital mortality the greatest absolute reduction was observed among patients aged ≥ 90 years while the greatest relative reduction was observed among patients aged 70-74 years. For 30-day mortality, 80-84 year olds saw the greatest absolute reductions while 70-74 year olds experienced the greatest relative reduction. For 1-year mortality, the greatest absolute and relative reductions were witnessed by 75-79 and 70-74 year olds, respectively.
Table III.
Absolute and relative reductions (95% CI) in MI case fatality rate among Medicare beneficiaries, 1984-2003, by age group.*
| In-Hospital
|
30-Day
|
1-Year
|
||||||||||
|---|---|---|---|---|---|---|---|---|---|---|---|---|
| 1984 Rate | 2003 Rate | Absolute Reduction |
Relative Reduction | 1984 Rate | 2003 Rate | Absolute Reduction |
Relative Reduction | 1984 Rate | 2003 Rate | Absolute Reduction |
Relative Reduction | |
| 65-69 | 15.7 | 7.8 | 7.6
(7.2, 8.0) |
49.7
(47.8, 51.4) |
17.4 | 10.2 | 6.9
(6.6, 7.3) |
40.7
(38.8, 42.6) |
27.9 | 21.4 | 6.5
(6.0, 7.0) |
23.1
(21.4, 24.7) |
| 70-74 | 19.8 | 8.2 | 11.5†
(11.1, 11.9) |
58.5†
(57.2, 59.9) |
21.8 | 11.1 | 10.8†
(10.3, 11.2) |
49.5†
(48.0, 50.9) |
34.7 | 22.6 | 12.4†
(11.9, 12.9) |
35.6†
(34.3, 36.8) |
| 75-79 | 24.4 | 10.4 | 14.1†
(13.7, 14.5) |
57.5†
(56.3, 58.6) |
26.7 | 14.4 | 12.6†
(12.1, 13.0) |
46.7†
(45.4, 47.9) |
42.7 | 29.3 | 13.8†
(13.2, 14.3) |
32.0†
(30.9, 33.0) |
| 80-84 | 28.6 | 13.1 | 15.8†
(15.3, 16.3) |
54.6†
(53.4, 55.7) |
31.4 | 18.6 | 13.0†
(12.5, 13.5) |
41.0
(39.7, 42.2) |
49.3 | 37.6 | 12.1†
(11.5, 12.7) |
24.3
(23.2, 25.3) |
| 85-89 | 32.4 | 15.9 | 16.5†
(15.9, 17.2) |
51.0
(49.6, 52.3) |
35.3 | 24.1 | 11.2†
(10.5, 12.0) |
31.8†
(30.2, 33.4) |
56.5 | 47.7 | 8.9†
(8.1, 9.7) |
15.8†
(14.6, 17.0) |
| ≥90 | 37.8 | 19.3 | 18.6†
(17.5, 19.6) |
49.2
(47.5, 50.9) |
41.3 | 31.7 | 9.7†
(8.6, 10.8) |
23.5†
(21.3, 25.7) |
64.4 | 60.5 | 4.0†
(2.9, 5.1) |
6.2†
(4.5, 7.8) |
Case fatality rates (%) are race and gender-standardized. Absolute and relative reductions in the case fatality rates are expressed as percent change and estimated from regression models adjusted for race and gender.
p<0.05 as compared to those aged 65-69 years.
Discussion
In this nationally-representative cohort of elderly patients, we found that in-hospital and short-term mortality following MI decreased dramatically over the 20-year period between 1984 and 2003, overall and within subgroups defined by race, gender, and age. However, the magnitude of this improvement varied significantly between subgroups.
Several,2, 15, 16 but not all,3, 17 national and community-based studies have previously shown that in-hospital mortality following MI has improved over time. The National Registry of Myocardial Infarction (NRMI) – the largest study to date – reviewed the medical records of 1.5 million patients hospitalized for MI at participating US hospitals and found that crude in-hospital mortality fell from 11.2% in 1990 to 9.4% in 1999.15 Our results are closer to those of the Worcester Heart Attack Study, a large prospective community-based study which provides the longest running assessment published to date (25-years). In that study the authors found that among 10,440 residents of Worcester, Massachusetts hospitalized with MI, crude in-hospital mortality fell from 19.9% in 1975-1978 to 12.0% in 2001.2
There is a relative paucity of research regarding long-term outcomes following MI, but the results of the current and previous studies suggest improvements in recent years. For example, investigators from the Cooperative Cardiovascular Project Pilot saw a statistically significant 13% (95% CI: 6, 19%) reduction in risk-adjusted 1-year mortality among Medicare beneficiaries in 4 US states between 1992 and 2001.3 In Worcester in the 20 years to 1995, age-adjusted and risk-adjusted 1-year mortality also decreased, although the observed decreases were only statistically significant in some years.18
We observed that substantially greater absolute and relative improvements in case fatality rates have been realized among whites as compared to blacks. Importantly, in-hospital and 30-day case fatality rates at the beginning of the observation period differed by race, with substantially lower rates among blacks. This short-term survival advantage among elderly blacks has been shown to persist even after adjustment for major risk factors, disease severity, treatment choices, and sociodemographic characteristics.19, 20 We observed the largest differences by race for 1-year mortality where improvements were 2 to 5-fold greater in white patients than in black patients although rates were similar in the early part of the observation period. Because we did not have data on clinical characteristics or treatment choices these differences are not necessarily attributable to discrepancies in access or quality of care, although recent results suggest that such discrepancies still exist in the US.20-22
Consistent with previous studies,23, 24 within each race short-and long-term case fatality rates were similar among men and women at all time points. We observed only small and inconsistent differences in mortality trends among men versus women of the same race. Although some contrasts reached statistical significance, the small magnitude and inconsistency in the direction of the association suggests that these may be spurious findings.
Consistent with previous studies,5, 25 race-and gender-standardized case fatality rates increased monotonically with advancing age regardless of calendar year. Our observation that in-hospital mortality improved substantially over time in all age groups is in agreement with results from the Worcester Heart Attack study.5 Interestingly, although patients ≥ 90 years experienced the smallest relative reduction in mortality they saw the largest absolute reduction, likely reflecting the higher absolute risk in this age group. Temporal improvements in 30-day and 1-year mortality were also evident at all ages, but with less relative or absolute improvement evident among older patients. For example, among patients aged ≥ 90 years there was only a 6.2% relative reduction and 4.0% absolute reduction in 1-year mortality during the observation period.
Our study has some potential limitations. First, because only Medicare beneficiaries aged ≥65 years were included in this study our results may not be generalizable to younger individuals or those not eligible for coverage under the Medicare program. Second, because we did not have data on clinical covariates including the presence of co-morbid conditions and complications, location or severity of the infarct, delay times between symptom onset and treatment, or treatment modalities used, our estimates of case fatality rates are not adjusted for risk of death or hospital characteristics. Particularly important in this regard is the potential that the use of cardiac troponins in the modern era has resulted in the identification of infarcts with less myocardial necrosis than was previously possible with less sensitive biomarkers.26 Third, patients that did not present to the hospital for treatment or those that died prior to hospitalization are not included in this study. Fourth, we did not evaluate whether trends differed by geographic region, although the management of patients hospitalized with MI has been shown to vary across the country.27, 28 Thus, it is possible that the observed trends could reflect, at least in part, temporal changes in the distribution of MI severity among hospitalized patients resulting from shifts in the prevalence of specific cardiovascular risk factors, primary and secondary prevention efforts, community awareness, and diagnostic criteria, rather than changes in the risk of death following an MI of a given severity. The direction and magnitude of these effects is unknown. Moreover, differential patterns in in-hospital versus out-of-hospital deaths by race, gender, or age group could limit the generalizability of our results. However, we are not aware of any evidence suggesting that these differential patters are changing over time.
Notwithstanding these potential limitations, this study of >4.9 million Medicare beneficiaries hospitalized for MI over a 20 year period provides the largest analysis of temporal trends in MI case fatality rate published to date. Moreover, the use of a nationally-representative cohort of patients minimizes potential non-generalizability that can arise from voluntary registries or community-based studies. These data show that despite overall favorable trends in MI mortality, important differences in by race and age remain. Additional studies are needed to clarify the basis for these disparities.
Acknowledgments
The project described was supported by grants F32-ES013804 and K99-ES015774 from the National Institute of Environmental Health Sciences (NIEHS), NIH and R827353 from the US Environmental Protection Agency (EPA). Its contents are solely the responsibility of the authors and do not necessarily represent the official views of the NIEHS, NIH, or EPA.
Footnotes
Financial Disclosures: None reported.
Publisher's Disclaimer: This is a PDF file of an unedited manuscript that has been accepted for publication. As a service to our customers we are providing this early version of the manuscript. The manuscript will undergo copyediting, typesetting, and review of the resulting proof before it is published in its final citable form. Please note that during the production process errors may be discovered which could affect the content, and all legal disclaimers that apply to the journal pertain.
References
- 1.National Heart Lung and Blood Institute. Morbidity and Mortality: 2004 Chart Book on Cardiovascular, Lung, and Blood Diseases. Rockville, MD: US Department of Health and Human Services, National Institutes of Health; 2004. [Google Scholar]
- 2.Goldberg RJ, Spencer FA, Yarzebski J, Lessard D, Gore JM, Alpert JS, et al. A 25-year perspective into the changing landscape of patients hospitalized with acute myocardial infarction (the Worcester Heart Attack Study) Am J Cardiol. 2004;94(11):1373–8. doi: 10.1016/j.amjcard.2004.07.142. [DOI] [PubMed] [Google Scholar]
- 3.Masoudi FA, Foody JM, Havranek EP, Wang Y, Radford MJ, Allman RM, et al. Trends in acute myocardial infarction in 4 US states between 1992 and 2001: clinical characteristics, quality of care, and outcomes. Circulation. 2006;114(25):2806–14. doi: 10.1161/CIRCULATIONAHA.106.611707. [DOI] [PubMed] [Google Scholar]
- 4.Ford ES, Ajani UA, Croft JB, Critchley JA, Labarthe DR, Kottke TE, et al. Explaining the decrease in U.S. deaths from coronary disease, 1980-2000. N Engl J Med. 2007;356(23):2388–98. doi: 10.1056/NEJMsa053935. [DOI] [PubMed] [Google Scholar]
- 5.Goldberg RJ, McCormick D, Gurwitz JH, Yarzebski J, Lessard D, Gore JM. Age-related trends in short-and long-term survival after acute myocardial infarction: a 20-year population-based perspective (1975-1995) Am J Cardiol. 1998;82(11):1311–7. doi: 10.1016/s0002-9149(98)00633-x. [DOI] [PubMed] [Google Scholar]
- 6.Yarzebski J, Bujor CF, Lessard D, Gore JM, Goldberg RJ. Recent and temporal trends (1975 to 1999) in the treatment, hospital, and long-term outcomes of Hispanic and non-Hispanic white patients hospitalized with acute myocardial infarction: a population-based perspective. Am Heart J. 2004;147(4):690–7. doi: 10.1016/j.ahj.2003.10.023. [DOI] [PubMed] [Google Scholar]
- 7.Kozak LJ, Lees KA, DeFrances CJ. National Hospital Discharge Survey: 2003 annual summary with detailed diagnosis and procedure data. Vital Health Stat. 2006;13(160):1–206. [PubMed] [Google Scholar]
- 8.Hoyert DL, Heron MP, Murphy SL, Kung HC. Deaths: final data for 2003. Natl Vital Stat Rep. 2006;54(13):1–120. [PubMed] [Google Scholar]
- 9.Lash TL, Silliman RA. A comparison of the National Death Index and Social Security Administration databases to ascertain vital status. Epidemiology. 2001;12(2):259–61. doi: 10.1097/00001648-200103000-00021. [DOI] [PubMed] [Google Scholar]
- 10.Cowper DC, Kubal JD, Maynard C, Hynes DM. A primer and comparative review of major US mortality databases. Ann Epidemiol. 2002;12(7):462–8. doi: 10.1016/s1047-2797(01)00285-x. [DOI] [PubMed] [Google Scholar]
- 11.Kiyota Y, Schneeweiss S, Glynn RJ, Cannuscio CC, Avorn J, Solomon DH. Accuracy of medicare claims-based diagnosis of acute myocardial infarction: estimating positive predictive value on the basis of review of hospital records. Am Heart J. 2004;148(1):99–104. doi: 10.1016/j.ahj.2004.02.013. [DOI] [PubMed] [Google Scholar]
- 12.Fisher ES, Whaley FS, Krushat WM, Malenka DJ, Fleming C, Baron JA, et al. The accuracy of Medicare’s hospital claims data: progress has been made, but problems remain. Am J Public Health. 1992;82(2):243–248. doi: 10.2105/ajph.82.2.243. [DOI] [PMC free article] [PubMed] [Google Scholar]
- 13.Arday SL, Arday DR, Monroe S, Zhang J. HCFA’s racial and ethnic data: current accuracy and recent improvements. Health Care Financ Rev. 2000;21(4):107–16. [PMC free article] [PubMed] [Google Scholar]
- 14.Spiegelman D, Hertzmark E. Easy SAS calculations for risk or prevalence ratios and differences. Am J Epidemiol. 2005;162(3):199–200. doi: 10.1093/aje/kwi188. [DOI] [PubMed] [Google Scholar]
- 15.Rogers WJ, Canto JG, Lambrew CT, Tiefenbrunn AJ, Kinkaid B, Shoultz DA, et al. Temporal trends in the treatment of over 1.5 million patients with myocardial infarction in the US from 1990 through 1999: the National Registry of Myocardial Infarction 1, 2 and 3. J Am Coll Cardiol. 2000;36(7):2056–63. doi: 10.1016/s0735-1097(00)00996-7. [DOI] [PubMed] [Google Scholar]
- 16.Ergin A, Muntner P, Sherwin R, He J. Secular trends in cardiovascular disease mortality, incidence, and case fatality rates in adults in the United States. Am J Med. 2004;117(4):219–27. doi: 10.1016/j.amjmed.2004.03.017. [DOI] [PubMed] [Google Scholar]
- 17.Roger VL, Jacobsen SJ, Weston SA, Goraya TY, Killian J, Reeder GS, et al. Trends in the incidence and survival of patients with hospitalized myocardial infarction, Olmsted County, Minnesota, 1979 to 1994. Ann Intern Med. 2002;136(5):341–8. doi: 10.7326/0003-4819-136-5-200203050-00005. [DOI] [PubMed] [Google Scholar]
- 18.Goldberg RJ, Yarzebski J, Lessard D, Gore JM. A two-decades (1975 to 1995) long experience in the incidence, in-hospital and long-term case-fatality rates of acute myocardial infarction: a community-wide perspective. J Am Coll Cardiol. 1999;33(6):1533–9. doi: 10.1016/s0735-1097(99)00040-6. [DOI] [PubMed] [Google Scholar]
- 19.Manhapra A, Canto JG, Vaccarino V, Parsons L, Kiefe CI, Barron HV, et al. Relation of age and race with hospital death after acute myocardial infarction. Am Heart J. 2004;148(1):92–8. doi: 10.1016/j.ahj.2004.02.010. [DOI] [PubMed] [Google Scholar]
- 20.Popescu I, Vaughan-Sarrazin MS, Rosenthal GE. Differences in Mortality and Use of Revascularization in Black and White Patients With Acute MI Admitted to Hospitals With and Without Revascularization Services. JAMA. 2007;297(22):2489–2495. doi: 10.1001/jama.297.22.2489. [DOI] [PubMed] [Google Scholar]
- 21.Weitzman S, Cooper L, Chambless L, Rosamond W, Clegg L, Marcucci G, et al. Gender, racial, and geographic differences in the performance of cardiac diagnostic and therapeutic procedures for hospitalized acute myocardial infarction in four states. Am J Cardiol. 1997;79(6):722–6. doi: 10.1016/s0002-9149(96)00857-0. [DOI] [PubMed] [Google Scholar]
- 22.Vaccarino V, Rathore SS, Wenger NK, Frederick PD, Abramson JL, Barron HV, et al. Sex and racial differences in the management of acute myocardial infarction, 1994 through 2002. N Engl J Med. 2005;353(7):671–82. doi: 10.1056/NEJMsa032214. [DOI] [PMC free article] [PubMed] [Google Scholar]
- 23.Goldberg RJ, Gorak EJ, Yarzebski J, Hosmer DW, Jr, Dalen P, Gore JM, et al. A communitywide perspective of sex differences and temporal trends in the incidence and survival rates after acute myocardial infarction and out-of-hospital deaths caused by coronary heart disease. Circulation. 1993;87(6):1947–53. doi: 10.1161/01.cir.87.6.1947. [DOI] [PubMed] [Google Scholar]
- 24.White AD, Rosamond WD, Chambless LE, Thomas N, Conwill D, Cooper LS, et al. Sex and race differences in short-term prognosis after acute coronary heart disease events: the Atherosclerosis Risk In Communities (ARIC) study. Am Heart J. 1999;138(3 Pt 1):540–8. doi: 10.1016/s0002-8703(99)70158-4. [DOI] [PubMed] [Google Scholar]
- 25.Mehta RH, Rathore SS, Radford MJ, Wang Y, Wang Y, Krumholz HM. Acute myocardial infarction in the elderly: differences by age. J Am Coll Cardiol. 2001;38(3):736–41. doi: 10.1016/s0735-1097(01)01432-2. [DOI] [PubMed] [Google Scholar]
- 26.Roger VL, Killian JM, Weston SA, Jaffe AS, Kors J, Santrach PJ, et al. Redefinition of myocardial infarction: prospective evaluation in the community. Circulation. 2006;114(8):790–7. doi: 10.1161/CIRCULATIONAHA.106.627505. [DOI] [PubMed] [Google Scholar]
- 27.O’Connor GT, Quinton HB, Traven ND, Ramunno LD, Dodds TA, Marciniak TA, et al. Geographic variation in the treatment of acute myocardial infarction: the Cooperative Cardiovascular Project. Jama. 1999;281(7):627–33. doi: 10.1001/jama.281.7.627. [DOI] [PubMed] [Google Scholar]
- 28.Pilote L, Califf RM, Sapp S, Miller DP, Mark DB, Weaver WD, et al. Regional variation across the United States in the management of acute myocardial infarction. GUSTO-1 Investigators. Global Utilization of Streptokinase and Tissue Plasminogen Activator for Occluded Coronary Arteries. N Engl J Med. 1995;333(9):565–72. doi: 10.1056/NEJM199508313330907. [DOI] [PubMed] [Google Scholar]