

SUMMARY
Cytochrome P450 (CYP) 4F mediated leukotriene B4 (LTB4) metabolism modulates inflammation during injury and infection. Here we show that in addition to LTB4, the recombinant rat CYP4Fs catalyze omega-hydroxylations of lipoxin A4, and hydroxyeicosatetraeonic acids. CYP4F gene regulation studies in primary hepatocytes reveal that pro-inflammatory cytokines interleukin (IL) -1β, IL-6 and tumor necrosis factor (TNF) -α produce a general inductive response whereas IL-10, an anti-inflammatory cytokine, suppresses CYP4F expression. The molecular mechanism behind IL-6 related induction of CYP4F4 and 4F5 is partially Signal Transducer and Activator of Transcription 3 (STAT3) dependent. When hepatocytes are subjected to high concentrations of LTB4 or prostaglandin E2, lipid mediators of inflammation, only an increase in CYP4F5 mRNA expression is observed. Collectively, the results from isozyme activity and substrate driven CYP4F induction do not support the notion that an autoregulatory pathway could control the excessive concentrations of LTB4 during an inflammatory challenge to hepatocytes.
Keywords: Cytochrome P4504F, eicosanoids, cytokines, STAT3, Inflammation, Interleukin-6, Leukotriene B4
INTRODUCTION
Although inflammation is an integral part of the host defense mechanism against pathogens or tissue injury, it often produces a myriad of unwanted complications. Immediately after injury or bacterial infection, polymorphonuclear leukocytes (PMNLs) are activated and recruited to the site of inflammation by soluble mediators causing cell adherence, transcapillary migration and chemotaxis [1]. Eicosanoids such as LTB4 and hydroxyeicosatetraenoic acids (HETEs) are potent chemotactic agents, which act primarily on PMNLs to enhance their adherence to endothelial tissue [2, 3]. Metabolism of LTB4 by cytochrome P450 (CYP) 4F3 to the 20-hydroxy derivative in the PMNL leads to dramatic loss of its chemotactic and aggregation activity [4, 5]. Additionally CYP4Fs are responsible for removal of circulating LTB4 in the liver, a major organ for this inflammatory mediator inactivation [6-11]. However, little is known about the regulation of hepatic eicosanoid uptake and their subsequent breakdown during either systemic or localized inflammatory conditions.
Unlike CYP4As, which are induced by hypolipidemic drugs and peroxisomal proliferators [12], the CYP4Fs are repressed after these treatments [13-15]. Recently, however, two separate reports confirmed that all-trans-retinoic acid induces CYP4F3 expression and increases its associated protein activity in differentiating human leukemia-60 cells [16, 17]. Christmas et al., have elegantly demonstrated that the CYP4F3 gene encodes two functionally distinct enzymes that differ only by the selection of exon 4 (CYP4F3A) or exon 3 (CYP4F3B) [18, 19]. CYP4F3A and 4F3B are generated from distinct transcription start sites in neutrophils and liver [18] and the alternate usage of exons 3 and 4 results in differential substrate preference and subsequent metabolism [19].
Similar to the human isoforms, the heterologously expressed rat CYP4Fs are quite active against LTB4 [15, 20-24]. The goals of this study were to test the catalytic activities of rat CYP4Fs against the eicosanoid substrates considered to play a role in inflammation. Secondly, we posited that the CYP4F subfamily might be able to modulate the extent of inflammation through control of these mediators. One way to provide support for this hypothesis is to test whether the expression of CYP4Fs changes during an inflammatory response, since these changes may be required to adjust the levels of these inflammatory mediators.
We have previously shown that lipopolysaccharide administration produces an isoform specific response in hepatic and renal CYP4F mRNA expression in both mice and rats [6, 25]. The present study investigates CYP4F regulation upon pro- and anti-inflammatory cytokine challenges. We also tested whether in silico-predicted binding of IL-6 response element binding proteins such as the Signal Transducer and Activator of Transcription 3 (STAT3) contribute to the IL-6 mediated effects on CYP4F gene expression. Finally we explored CYP4F participation in an autoregulatory pathway that might control LTB4 metabolism.
MATERIALS AND METHODS
Materials
Male Fischer 344 (F344) rats (150-200 g) from Harlan Sprague Dawley (Indianapolis, IN) were used for hepatocyte isolation. 5’ Rapid amplification of cDNA ends by PCR (5’ RACE) kits, Superscript II and Taq DNA polymerase, Cell culture medium (Waymouth’s MB 752/1), insulin, antibiotics, murine recombinant IL-1β, IL-6, IL-10, TNF-α, Type IV collagenase and TA cloning vector kits were purchased from Invitrogen Life Technologies (Carlsbad, CA). Purified LTB4, prostaglandin (PG) E2 and arachidonic acid were purchased from Cayman Chemical Company (Ann Arbor, MI). HETEs, lipoxins (LXs) and PGs were obtained from Funakoshi Co. (Tokyo, Japan). STAT3 inhibitor peptide was obtained from EMD Biosciences (San Diego, CA). CYP4F standard amplicons, primers and probes were custom synthesized by IDT DNA Technology Inc. (Coralville, IA). Saccharomyces cerevisiae, strain AH22 (a, leu2, his4, can1, cir1), was purchased from ATCC (Manassas, VA). The yeast expression vector pAAH5 carrying the ADH1 promoter and terminator was a gift from Dr. B.D. Hall, University of Washington. All other chemicals utilized in the experiments reported here, where not specifically defined, were of reagent grade quality or higher.
Recombinant Expression of CYP4Fs in yeast cells
The cDNA clones for rat CYP4Fs were obtained as previously described [15, 21]. HindIII sites were engineered by polymerase chain reaction (PCR) on each end of CYP4F1, 4F4 and 4F5 cDNAs. The purified CYP4F constructs with HindIII sites were ligated into TA cloning vector PCR 2.1, transformed into E.coli (DH5α) cells and grown on Luria-Bertani-Ampicillin selection media. Positive clones identified by EcoRI digestion were sent for sequencing (SeqWright Houston, TX) and the clones containing the complete sequence for each rat CYP4F isoform without any mutations were chosen for expression. The modified CYP4F cDNA fragments with HindIII sites at both ends were digested from PCR 2.1 and inserted into the HindIII sites of the pAAH5 vector. The CYP4F constructs were transfected into 100 μL competent yeast cells in the presence of 50% polyethylene glycol (PEG) 400 with a 1 hr incubation at 30°C followed by 5 min incubation at 42°C. This mixture was plated on sterile YNBD agar plates (0.67% yeast nitrogen base, 2% glucose, 20 mg/L histidine and 2% agar) and incubated at 30°C for 3 days. Several colonies were picked and cultivated in concentrated SD medium (8% glucose, 5.4% nitrogen base without amino acids, and 160mg/mL histidine) at 30°C with continuous shaking at 250 RPM [5].
Microsome preparation
Yeast microsomes were prepared as described previously [5]. Briefly, cells were gently washed three times with ice cold sterile water, centrifuged at 3000 g and resuspended in ice cold S0.65 buffer (0.65 M sorbitol, 10 mM Tris, 0.1 mM EDTA and 0.1 mM DTT) containing a cocktail of protease inhibitors (1 mM PMSF, 1 μg/mL leupeptin & 0.7 μg/mL pepstatin). The resuspended cells were broken by passage through a French press three times at 4°C. The broken cells were centrifuged at 12,000g for 20 min and the supernatant fraction was collected. The supernatant was further centrifuged at 100,000g for 45 min, the pellet washed in fresh buffer and again centrifuged at 100,000g for 45 min. The final pellet was dissolved in buffer S0.65 (1/10 of starting volume) lacking the protease inhibitors. Control microsomes were prepared from yeast transformed with the plasmid without an insert. The total protein concentration in microsomes was determined with the bicinchoninic acid procedure using bovine serum albumin (BSA) as the standard.
Eicosanoid activity assays
The activity assays for the eicosanoid substrates were performed using high performance liquid chromatography (HPLC) methods as previously described [26-31]. LTB4 ω-hydroxylase activity was determined by incubating the reaction mixture containing CYP4Fs (6-10 pmol), 20 mM Hepes buffer (pH 7.5) including 340 mM sucrose, 1 mM EDTA, and 1 mM dithiothreitol (DTT), 1 mM NADPH, and 60 μM LTB4, in a total volume of 0.1 mL, at 37°C for 20 min. The reaction products were then extracted with ethyl acetate and measured. LXA4, LXB4 and HETE ω-hydroxylation activities were determined using 60 μM concentrations of each substrate by the methods described earlier. Prostaglandin ω-hydroxylating activities were determined in 0.1 M sodium phosphate reaction buffer (pH 7.4) with 100 μM substrates. No significant difference in activities was observed upon addition of cytochrome b5 or cytochrome P450 reductase to the assay system due to the presence of endogenous NADPH-dependent reductases in the microsomes. For kinetic analysis of LTB4 ω-hydroxylation, the reaction mixtures were incubated for 30 min. The activities were in the linear range for the incubation time from 0 to 40 min. The range of substrate concentrations used for the kinetic analysis were, 0, 10, 20, 40, 60, 100 and 150 μM. Kinetic parameters were calculated using Hanes-Woolf’s plot. Each data point is a mean of at least two independent determinations.
CYP4F Transcription Start Site (TSS) Identification by 5’ RACE
To determine the transcriptional initiation site of CYP4F genes, the 5’ RACE system was used according to the manufacturer’s instructions. Using rat liver or brain total RNA (2 μg) as template, first-strand cDNA synthesis was performed using a gene specific primer called GSP1 for individual CYP4F isoforms listed in Supplemental Material Table S1. Single-stranded cDNA was separated from unincorporated dNTPs and primer using GlassMax spin cartridges. A 5’-poly (C) tail was added using dCTP and terminal deoxynucleotidyltransferase. Poly (C)-tailed cDNA was amplified by PCR using an anchor primer supplied with the kit and the second gene specific primer GSP2 corresponding to each isoform (Supplemental Material Table S1). The PCR product was used as template for a second round of PCR using nested primers supplied by the manufacturer and the third gene specific primer GSP3 for each isoform (Supplemental Material Table S1). The final PCR products, visualized on 1.5% agarose gels (Supplemental Figure S1), were excised and gel purified using Quantum PrepR Freeze ‘N Squeeze DNA gel extraction spin columns (BIO-RAD, Hercules CA). Purified PCR DNA was subcloned into the TA cloning vector and individual clones were sequenced by SeqWright (Houston, TX).
Genome searches, in-silico sequence analyses and accession numbers
The cDNA sequences from accession numbers BC081808, U39206 and U39207 were individually chosen to probe in-silico DNA sequences homologous to the gene of interest. Using small stretches of these probes, Basic Local Alignment Search Tool (BLAST) searches of GenBank against many databases in the Website of the National Center for Biotechnology Information of the National Institutes of Health (www.ncbi.nlm.nih.gov/) were performed. The accession numbers of sequences from the rat genome used in structure analysis of CYP4F1, 4F4 and 4F6 were AC109942, AC094689 AC109942.6 respectively. The genomic organization and Intron-Exon boundaries around CYP4F genes were determined by examining the consensus sequence following the ‘gt……ag’ rule of intronic splicing. Genomic sequences encompassing exons of the CYP4F1, 4F4 and 4F6 genes were submitted to Genebank third party annotation program BANKIT (NCBI).
Hepatocyte isolation and culture
Rat hepatocytes were isolated by in-situ collagenase perfusion as described previously [6]. The viability of hepatocyte preparations was between 70-85% (trypan blue exclusion) and the yield was 200-400 ×106 viable cells/liver. The hepatocytes were plated in Waymouth’s medium containing 0.15 mM insulin on 60 mm culture dishes coated with 0.4 mL Matrigel (2.0 mg/mL) at a density of 3.5×10⁶ cells per dish. Medium was changed to remove the dead cells 4 hrs after the plating and every 48 hours thereafter. Due to rapid loss of CYP4F expression in the first 48h (loss of up to 80%) after isolation, cells were cultured for 5 days before beginning treatments to allow for recovery of stable expression of CYP4Fs.
Treatments
Hepatocytes were treated on day 5 by changing to medium containing vehicle (called control elsewhere) or 5ng/mL IL-lβ, IL-6, TNF-α or IL-10. Hepatocytes were separately preincubated with either vehicle or 100μM STAT3 inhibitor peptide (STAT3ip), followed by IL-6 challenge an hour later. For the eicosanoid study, cells were treated with either 1 μM LTB4, 0.3 μM PGE2, or 1μM arachidonic acid. Eight and twenty-four hours after treatment, cell viability assessed by trypan blue exclusion for control cells was similar to that of the treatments. None of the treatments resulted in any significant increases in the number of dead or living cells recovered from the culture medium.
RNA isolation and Quantitative Real Time PCR (QRTPCR) analysis
Total RNA was prepared and all samples were DNAse treated using RQ1 DNAse (Promega, Madison WI). The quality of the isolated RNA was assessed by electrophoresis on 1% agarose gels based on the integrity of 28S and 18S bands after ethidium bromide staining. CYP4F mRNA expression analysis was carried out using QRTPCR as described previously [13]. BLT1, BLT2 and r-cyclophilin reverse transcriptase PCR were performed with 1μg of liver or isolated hepatocyte total RNA using the superscript one step RT-PCR kit (Invitrogen, Carlsbad, CA). After an initial step of reverse transcription at 50°C (30 min), PCR was done following conditions described in mental Material Table S2. To ensure that each PCR reaction was performed within the linear range of amplification, test reactions were performed at 20, 25, 30 and 35 cycles. PCR products were resolved on 1.5% agarose gels and visualized using ethidium bromide staining.
Statistical Analysis
QRTPCR results are presented as Mean ± SEM from at least five independent sets of samples replicated twice. Comparisons were made using one-way analysis of variance with a post hoc Tukey’s multiple range test. Values of P < 0.05 were considered statistically different.
RESULTS
Characterization of CYP4F activity for eicosanoid substrates
Recombinant rat CYP4Fs were expressed in a yeast system, microsomes were isolated for activity analysis [21] and the kinetic values were validated in parallel for 4F4, 4F5 and 4F6 with 4F1 for comparative purposes. The reduced CYP4F-CO complexes had typical absorption maxima at 450 nm. Control microsomes did not contain any substantial amount of CYP as judged from the CO difference spectra and showed no activity towards any of the substrates tested. The specific contents obtained for CYP4F1*, 4F4, 4F5 and 4F6 in the yeast expression system were 60, 72, 67 and 79 pmol P450/mg protein respectively. Recombinant CYP4F microsomes showed appreciable LTB4 ω-hydroxylase activity. They also catalyzed ω-hydroxylation of 6-trans LTB4, LXA4, PGA1, and several monohydroxy-eicosatetraenoic acids such as 5-HETE, 8-HETE, and 12-HETE (Table 1). CYP4F1 was found to be the most active 4F in eicosanoid metabolism followed by CYP4F4, CYP4F5 and CYP4F6. Interestingly CYP4F4 activity was rather specific for LTB4 as it showed no catalysis of any of the other eicosanoids tested. The kinetic parameters of CYP4Fs in catalyzing LTB4 ω-hydroxylation exhibit simple Michaelis-Menten kinetics over the range of substrate concentrations employed. While CYP4F1 has the highest apparent Vmax, CYP4F4 shows the lowest Km values (45.5 μM) against LTB4 (Table 2). The Km values of CYP4F1 (134.0 μM), CYP4F5 (129.0 μM) and CYP4F6 (100.9 μM) for LTB4 all lie within a narrow range but the turnover numbers (nmol/min/nmol P450) for CYP4F5 (0.31) and 4F6 (0.24) are significantly lower in comparison to CYP4F1 (6.50) and 4F4 (4.02).
Table 1.
Catalytic activity of recombinant CYP4Fs
| SUBSTRATES | Activities (nmol/min/nmol P450) | |||
|---|---|---|---|---|
| CYP4F1* | CYP4F4 | CYP4F5 | CYP4F6 | |
| LTB4 | 2.56 | 2.38 ± 0.47 | 0.22 ± 0.01 | 0.30 ± 0.12 |
| 6-TRANS LTB4 | 3.14 | 1.70 ± 0.15 | N.D. | N.D. |
| LIPOXIN A4 | 4.46 | N.D. | N.D. | N.D. |
| LIPOXIN B4 | N.D. | N.D. | 0.21 ± 0.08 | 0.09 ± 0.01 |
| 5-HETE | 3.56 | N.D. | N.D. | N.D. |
| 8-HETE | 12.5 | N.D. | N.D. | N.D. |
| 12-HETE | 0.87 | N.D. | 0.75 ± 0.29 | 0.61 ± 0.01 |
| PGA1 | 0.39 | 0.01 ± 0.001 | N.D. | N.D. |
In-vitro metabolism of various eicosanoid substrates was performed using recombinant CYP4Fs. The activities are represented as mean value of three independent examinations and standard errors. Reaction conditions were as described in Methods section. Briefly, 6 pmol of CYP4F enzyme was incubated for a range of 60 to 100 μM of substrate for 20 min in 0.1mL Hepes or sodium phosphate reaction buffer followed by ω-hydroxylated metabolite determinations using previously described HPLC methods.
CYP4F1 values were previously reported in Kikuta et al. (1999). N.D. stands for not detected.
Table 2.
Kinetic parameters of CYP4Fs in catalysis of LTB4 ω-hydroxylation
| Km (μM) | Vmax (nmol/min/nmol P450 | |
|---|---|---|
| CYP4F1* | 134.0 | 6.50 |
| CYP4F4 | 45.5 | 4.02 |
| CYP4F5 | 129.0 | 0.31 |
| CYP4F6 | 100.9 | 0.24 |
Reaction conditions were as described in Methods section. The range of substrate concentrations used for the kinetic analysis were, 0, 10, 20, 40, 60, 100 and 150 μM. Kinetic parameters were calculated using Hanes-Woolf’s plot. Each analysis was performed at least two times.
CYP4F1 values were previously reported in Kikuta et al. (1999).
Determinations of transcription start sites and Intron-Exon distribution of CYP4F genes
CYP4F genes form a close cluster on rat chromosome 7q11 suggesting gene duplication events. CYP4F6 and CYP4F1 are located closer together (on the + strand) in that order followed by CYP4F4 and CYP4F5 (on the − strand). The genomic organization reveals that CYP4F genes contain 13 exons that are quite similar in size (Supplementary Figure 1). It is the size of introns that marks high diversity among these isoforms. All intron-exon boundaries conform to the gt…ag rule and the exact boundaries and sizes for CYP4F1, 4F4 and 4F6 are shown in Supplemental Material Tables S3A, B, C and D. CYP4F5 genomic structure analysis was previously carried out [33] and was used here for comparative purposes. The different intron sizes result in different gene lengths for these isoforms. CYP4F1, 4F4, 4F5 and 4F6 genes span 11.52 Kb, 16.35 Kb, 14.5 and 29.76 Kb, respectively (Supplementary Figure 1). Also, the first exon of CYP4F genes only includes the 5’ untranslated region (UTR), and the ATG initiation codon is located in exon 2 (Figure 1).
Figure 1. Cytokine mediated regulation of CYP4F expression in primary hepatocytes.

Rat hepatocytes were treated with either vehicle or IL-1β (5ng/3mL), IL-6 (5ng/3mL), TNF-α (5ng/3mL) and IL-10 (5ng/3mL). RNA was harvested at 8hr or 24 hr post-treatment and expression of CYP4F isoforms quantitated by QRTPCR as described earlier. Each data point represents the Mean ± SEM of five independent culture plates and is expressed as percent control. * indicates P < 0.05 compared to control.
In order to analyze the proximal promoter region, the transcription start sites of CYP4F isoforms were determined. Interestingly, for CYP4F1, a mixture of PCR products with two different 5’-UTR sequences was amplified. These products include the same open reading frame sequence but with a 23- or 17-bp 5’-UTR (Supplementary Figure 1). This result indicates that CYP4F1 gene transcription is initiated from two distinct sites. We named CYP4F1 mRNAs with 23-bp and 17-bp UTRs as CYP4F1A and CYP4F1B, respectively. The presence of the 17-bp sequence in only two out of the ten clones from liver RNA and one out of six from brain RNA suggests that CYP4F1B accounts for only about 20% of total CYP4F1 mRNAs. Also, CYP4F1B mRNA contains only 12 exons such that the second exon of the CYP4F1A becomes the first exon in this case but with an addition of 17 bp from intron 1 on the 5’ side (Supplementary Figure 1). This makes the first exon size for CYP4F1B 216 bp instead of 22 bp.
Transcription start sites of CYP4F genes are shown in the Supplemental Figure S2. The transcription of CYP4F1A and CYP4F1B both start from a guanosine. For CYP4F4, transcription starts from a thymine located 18-bp upstream of the first nucleotide of the cDNA sequence originally identified by Kawashima and Strobel (1995) and this results in a 158-bp 5’-UTR [34]. CYP4F5 gene structure has been previously characterized and contains an 83 bp 5’UTR [33]. CYP4F6 gene on the other hand was found to be transcribed from a cytosine resulting in an 88-bp 5’-UTR.
Isoform specific response of CYP4Fs to pro- and anti-inflammatory cytokines
To examine whether cytokine signaling regulates CYP4Fs under inflammatory circumstances, effects of some pro- and anti-inflammatory cytokines on CYP4F gene expression were tested (Figure 1). QRTPCR using Taqman assays where increases in fluorescence due to the cleavage of the reporter dye relative to the starting values of delta normalized reporter fluorescence (ΔRn), were carried out and results were plotted against cycle number. Ct values (the PCR cycle number required for fluorescence intensity to exceed an arbitrary threshold in the exponential phase of the amplification) were then determined for a series of standards. Standard curves were generated by plotting Ct versus the log of the amount of amplicon for specific CYP4F isoform, and were used to compare the relative amount of a particular CYP4F mRNA in the samples. Typical Ct values obtained for CYP4F1, 4F4, 4F5 and 4F6 in the whole liver were 20.5, 22.5, 30 and 23.5 respectively. Ct values for all CYP4Fs in the five day cultured hepatocytes were around 2-3 cycles higher compared with intact liver samples.
IL-6 treatment of hepatocytes in particular induced CYP4F1, 4F4 and 4F5 levels whereas IL-10, an anti-inflammatory cytokine, caused a sharp decline of these three forms. CYP4F6 expression remained unchanged in all these treatments. Quantitatively, CYP4F5 showed the largest increase from control after IL-1β (up to 2.7-fold at 8hr; up to 8-fold at 24hr), IL-6 (up to 6.5-fold at 8hr; up to 16-fold at 24hr) and TNF-α (up to 4.6-fold at 8hr; statistically insignificant at 24hr) treatments all of which increased in amplitude at 24hr with respect to the time point 8hr except for TNF-α (P<0.05). While CYP4F1 expression at 8hr showed an initial suppression of 70% upon IL-6 administration, the levels at 24hr were induced nearly 2.3-fold compared to control (P<0.05). IL-1β treatment increased 4F1 expression by 30% at 24hr which is consistent with results previously reported [6]. TNF-α treatment similar to IL-6 resulted in approximately 80% reduction in 4F1 expression from control at 8hr (P<0.05) but the suppression was lost by 24hr. As observed earlier at 24hr [6], CYP4F4 expression after IL-1β treatment was reduced to 40% of control. TNF-α, in contrast to IL-1β, led to the suppression of 4F4 much earlier with a nearly 60% decrease in expression observed at 8hr (P<0.05). Like CYP4F5, IL-6 administration resulted in substantial induction of CYP4F4 mRNA both at 8hr (3-fold higher from control) and 24hr (7-fold higher from control) post-treatment (P<0.05). Treatment of cells with the anti-inflammatory cytokine IL-10 for 8hr resulted in up to 90% reduction of CYP4F1 and 4F4 expression and 56% reduction in 4F5 mRNA levels (P<0.05). This effect persisted for at least 24hr subsequent to IL-10 administration.
Involvement of STAT3 in IL-6 mediated induction of CYP4Fs
In order to test whether STAT3 was involved in IL-6 related CYP4F4 and 4F5 induction, STAT3 inhibitor peptide (STAT3ip), a highly selective and potent blocker of STAT3 activation [35], was utilized. One-hour incubation of cells with the cell permeable analog of STAT3iP prior to IL-6 administration resulted in approximately 70% (at 8hr) and 50% (at 24hr) reduction of IL-6 stimulated CYP4F4 expression (P<0.05) (Figure 2). CYP4F5 displayed a slower onset of inhibition by STAT3iP with nearly 30% reduction from IL-6 stimulated cells at 8hr that increased up to 58% at 24hr post-treatment (P<0.05).
Figure 2. STAT3 inhibitor partially blocks IL-6 stimulation of CYP4F4 and 4F5.

Rat hepatocytes were treated with 100μM Stat3iP or vehicle and an hour later challenged with IL-6 (6ng/mL). RNA was harvested at 8hr or 24hr post-treatment and expression of CYP4F isoforms quantitated by QRTPCR. Each data point represents the Mean ± SEM of five independent culture plates and is expressed as percent reduction in CYP4F expression from IL-6 treatment at 8 or 24hr set as 100%. * indicates P < 0.05 compared to control.
Autoinduction of CYP4Fs as a modality to contain cellular LTB4 levels
On of the objectives of this study was to determine whether arachidonic acid or its proinflammatory metabolites LTB4 and PGE2 could affect CYP4F gene expression which could potentially regulate its own breakdown via CYP4F induction in hepatocytes. As shown in Figure 3A, LTB4 treatment resulted in a 50% increase in CYP4F5 mRNA expression from control at 8hr that persisted up to 24hr (P<0.05). There was no significant effect of LTB4 treatment on CYP4F1, 4F4 and 4F6 expression. Like LTB4, PGE2 administration also caused induction of only CYP4F5 expression both at 8hr and 24hr post-treatment; however, the level of increase with PGE2 was nearly 2-fold (P<0.05). CYP4F4 in contrast showed a 40% decrease in expression from control at 8hr after PGE2 treatment (P<0.05). Treating the hepatocytes with combination of LTB4 and PGE2 resulted in larger induction of CYP4F5 expression than was produced by the individual agents at 8hr but this induction was diminished by 24hr. Mild decreases in CYP4F1, 4F4 and 4F6 levels were observed at 8hr upon combined LTB4 and PGE2 treatment. Arachidonic acid administration did not produce any significant change in CYP4F gene expression (Figure 3A). We also tested for the presence of the two LTB4 receptors, BLT1 and BLT2, in the liver and cultured hepatocytes (Figure 3B). Both BLT1 and BLT2 were easily detected in the whole liver. However, in the hepatocytes, BLT2 expression was much stronger than BLT1. A moderate up regulation of low affinity BLT2 receptor was seen after the LTB4 treatment of hepatocytes in comparison to the vehicle treated controls.
Figure 3. A. Effects of eicosanoid treatment on CYP4F expression in primary hepatocytes.
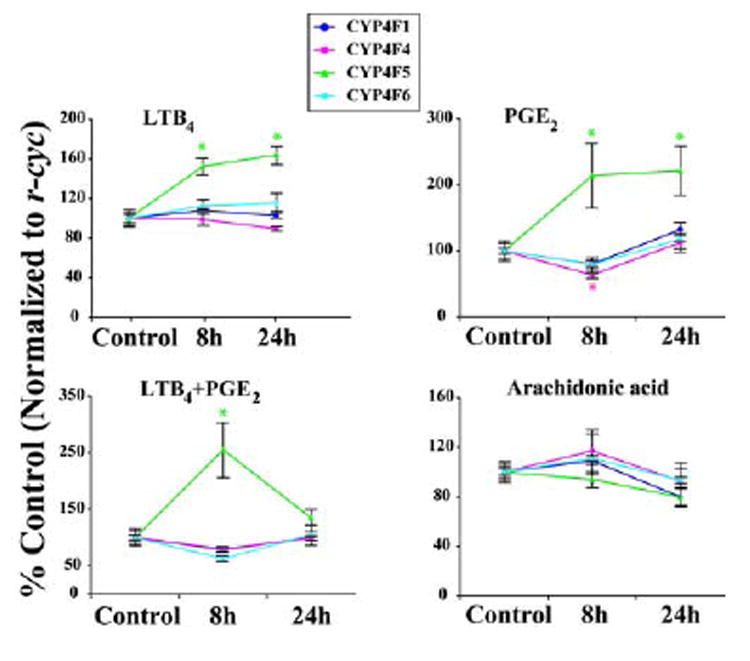
Rat hepatocytes were treated with either vehicle or LTB4 (1μM), PGE2 (0.3μM), LTB4 (1μM) + PGE2 (0.3μM) and Arachidonic acid (1μM). RNA was harvested at 8hr or 24 hr post-treatment and expression of CYP4F isoforms quantitated by QRTPCR. Each data point represents the Mean ± SEM of five independent culture plates and is expressed as percent control. * indicates P < 0.05 compared to control.
B. BLT1 and BLT2 mRNA expression in rat liver and isolated hepatocytes. BLT1 and BLT2 reverse transcriptase PCR was done as described in the Methods section. r-cyclophilin was used as a loading control.
DISCUSSION
CYP4Fs metabolize LTB4 to its inactive hydroxy products that are incapable of amplifying an inflammatory response [36]. Lipoxins, on the other hand are trihydroxyeicosanoids that are recognized as potent mediators in resolving inflammation [37]. Boucher et al. were the first to report that rat liver microsomes hydroxylate LXA4 and LXB4 at the ω- or (ω-1)-position [38]. We have shown that LXA4 is ω-hydroxylated more rapidly than LTB4 by the purified CYP4F1 but 4F1 has no activity toward LXB4. Since CYP4F1 can metabolize both pro- and anti-inflammatory eicosanoids, we speculate that hepatic regulation of this isozyme may be critical in the adaptive response to inflammation.
Bylund et al. showed that CYP4F5 and 4F6 prefer to hydroxylate LTB4 at the ω-1 and ω-2 positions respectively [20]. Our results are consistent with their findings as we see minimal catalysis of LTB4 at the ω-position by CYP4F5 and 4F6. Although CYP4F1 and 4F4 ω-hydroxylated both LTB4 and 6-trans LTB4, the low activity observed for CYP4F5 and 4F6 was specific to LTB4 and no metabolism of 6-trans LTB4 was seen. The first committed step in LTB4 biosynthesis is the formation of leukotriene A4 (LTA4) by 5-lipoxygenase. LTA4 hydrolase hydrates this triene epoxide to LTB4 which plays an important role as a chemotactic factor for the human PMNL [3]. In addition, there is a competitive non-enzymatic hydrolysis of LTA4 leading to the formation of epimeric dihydroxyeicosatetraenoic acid, 6-trans-LTB4. Although 6-trans-LTB4 is substantially less potent compared to the enzymatic product LTB4, there is evidence to suggest that it retains significant biological activity [39].
Among several HETEs examined, 8-HETE was found to be the most efficient substrate for the recombinant CYP4F1. 8(S)-HETE is generated from arachidonic acid by 8(S)-lipoxygenase, which was reported to be located in the mouse skin and inducible by treatment with phorbol esters [40]. At present, the exact physiological and pathophysiological roles of 8(S)-HETE remain to be elucidated. CYP4F5 and CYP4F6 on the other hand showed activities for LXB4 and 12-HETE. Hence the data from this study in conjunction with other recent reports [36] strengthen the notion that the CYP4F subfamily previously thought to be specific in LTB4 catalysis has a much broader range of substrates. Moreover, the ability of CYP4F isozymes to produce site-specific eicosanoid metabolites [20, 41, 42], the biological roles of which remain unknown, may provide them an isoform-specific function. Therefore, it seems reasonable to explore their detailed tissue-specific regulation and expression to gain more insights into their functional properties.
The acute phase response is characterized by a coordinate change in the production of hepatic and plasma proteins acting additively or synergistically to protect the host. Many of these proteins are directly or indirectly regulated by cytokines such as IL-1, IL-6 and TNF-α[43]. Previous studies from our laboratories demonstrated that hepatic CYP gene expression is transcriptionally altered by lipopolysaccharide treatment in a pattern of response consistent with an acute phase reaction [6, 25, 43, 44]. It will be interesting to determine if the interaction of these transcription factors with the regulatory region of the CYP4F genes is responsible for such alterations.
In an effort to test whether IL-6 regulates CYP4Fs, we studied its effects on isolated hepatocytes and found that IL-6 induces CYP4F mRNA expression. One signal transduction pathway that leads to induction of target gene expression after cytokine stimulation is the Janus kinase (Jak)- Signal Transducer and Activator of Transcription (STAT) pathway [45, 46]. IL-6 acts principally via the IL-6 receptor-gp130 glycoprotein complex. Upon receptor activation, latent cytoplasmic transcription factors STATs are selectively recruited to the receptor chains via interaction between the SH2 domain of the STATs and the receptor tyrosine phosphopeptides [45]. Recruited STATs are phosphorylated on a specific tyrosine residue and then dissociate from the receptor, form homo- and heterodimers that translocate to the nucleus, bind to cognate DNA response elements, and activate target gene transcription [45, 46]. STAT3 is one of these latent cytoplasmic transcription factors that control the expression of many genes in response to an IL-6 stimulus.
STAT3iP has been developed as a highly selective and potent inhibitor that suppresses STAT3 activation mediated by Src [35]. We found that STAT3iP partially abrogated IL-6 stimulation of CYP4F4 and 4F5 expression. Thus the upregulation of CYP4F isoforms by IL-6 is, at least to a certain extent, controlled by STAT3 dimerization and subsequent nuclear translocation. Apart from STAT3, C/EBPs also have the ability to regulate hepatic response to IL-6 resulting in activation or repression of transcription [47]. It is suggested that this protein contributes to the regulation of the acute-phase response of the liver. Since putative C/EBP binding sequences are predicted on CYP4F promoters, it is possible that they also contribute to the inductive response of CYP4Fs associated with IL-6.
In addition to IL-6, TNF-α was also able to induce CYP4Fs; however, the induction time was more rapid with TNF-α. IL-10 on the other hand produced a significant decrease in CYP4F expression. These findings are especially interesting since IL-10 is a pleiotropic cytokine that controls many inflammatory processes [48]. The anti-inflammatory effects of IL-10 are achieved through the suppressed production of inflammatory proteins such as IL-1, IL-6, IL-8, IL-12, TNF, granulocyte-macrophage colony stimulating factor and granulocyte colony stimulating factor [48, 49]. Thus the inhibitory effect on CYP4F expression caused by IL-10 could be due to the suppression of the constitutive pathways, which are directed by the factors responsible for basal expression of CYP4Fs. On the other hand, it is possible that IL-10 exerts a direct transcriptional control on CYP4F gene regulation. Nevertheless, the opposite regulation of CYP4Fs by pro- and anti-inflammatory cytokines provides a platform to modulate an inflammatory response. For instance, the release of pro-inflammatory cytokines during early phases might curtail progression of inflammation by up regulating hepatic CYP4F mediated breakdown of LTB4 and HETEs, both of which augment inflammatory responses. Accordingly in the resolution phase, where eicosanoid production switches from pro-inflammatory leukotrienes and prostaglandins to inflammation-resolving lipoxins [50-52], anti-inflammatory cytokines may facilitate repair by suppressing CYP4F mediated lipoxin breakdown. However, inherent to the lower CYP4F expression in the hepatocytes in comparison to the intact liver, the proposed cytokine regulation of CYP4Fs must be validated in vivo.
Lastly, we demonstrate that hepatocytes subjected to high concentrations of arachidonic acid, LTB4 or PGE2 show no upregulation of CYP4F1, 4F4 and 4F6. Even though LTB4 and PGE2 both induce CYP4F5 mRNA expression, the low catalytic activity of CYP4F5 in comparison to CYP4F1 and 4F4 does not support a prospective feedback mechanism in which LTB4 may induce its own metabolism. Consistent with our results, Fiedler et al. have reported unchanged LTB4 metabolism after pre-treatment of rat hepatocytes with the substrate LTB4 [53]. Although both high and low affinity LTB4 receptors namely BLT1 and BLT2 were detected in the whole liver, BLT2 was much more abundant in the hepatocytes compared to BLT1. This means that BLT1 receptor expression in the liver is primarily in the cell types other than hepatocytes. These could be the macrophages, PMNLs or other cells associated with immune surveillance function. This is consistent with the previously published expression profiles of these two receptors in humans and mice [54]. Interestingly we found that BLT2 mRNA was modestly up regulated by LTB4 treatment but its significance in CYP4F regulation is not yet clear. Taken together the high expression of BLT2 and relatively high dose of LTB4 used in this study, CYP4F5 induction after LTB4 treatment seems to be mechanistically related to the BLT2 rather than BLT1 signaling.
In summary, our findings provide evidence that cytokines regulate levels of CYP4F enzymes, which not only catabolize LTB4 but also take part in catalysis of other eicosanoids in the arachidonic acid cascade. Of potential interest is the identification of the pathways and transcription factors that govern expression of CYP4F isoforms during inflammation since some of the 4F substrates have counter-regulatory functions.
Supplementary Material
Table S1. Sequences of 5’ RACE primers for rat CYP4F genes.
Table S2. Sequences of primers for rat LTB4 receptor expression.
Table S3. Sequences around splicing sites of rat CYP4F genes.
Figure S1 Genomic Structure and Intron-Exon distribution of CYP4F genes.
- Determination of transcription start site by RACE-PCR.
- Identification of transcription start sites (TSS).
Acknowledgments
This work was supported by grants R01 MH070054 and RO1 NS044174 from NIH and US Department of the Army grant T5 0004268 for Texas Training and Technology against Trauma and Terrorism to Dr. Henry W Strobel grant GM 46897 to Dr. Edward T Morgan and Medical School Dean’s Research Scholarship awarded to Dr. Auinash Kalsotra.
Abbreviations used are
- CYP
Cytochrome P450
- QRTPCR
quantitative real-time PCR
- RXR
retinoic X receptor
- PPAR
peroxisome proliferator activated receptor
- GR
glucocorticoid receptor
- ER
estrogen receptor
- HNF
hepatocyte nuclear factor
- STAT3
signal transducer and activator of transcription 3
- BCA
Bicinchoninic Acid
- BSA
Bovine serum albumin
- IL-1
interleukin-1
- IL-6
interleukin-6
- IL-10
interleukin-10
- TNF-α
tumor necrosis factor-α
- YNBD
yeast nitrogen base and dextrose
- TSS
transcription start site
Footnotes
Publisher's Disclaimer: This is a PDF file of an unedited manuscript that has been accepted for publication. As a service to our customers we are providing this early version of the manuscript. The manuscript will undergo copyediting, typesetting, and review of the resulting proof before it is published in its final citable form. Please note that during the production process errors may be discovered which could affect the content, and all legal disclaimers that apply to the journal pertain.
References
- 1.Springer TA. Cell. 1994;76:301–314. doi: 10.1016/0092-8674(94)90337-9. [DOI] [PubMed] [Google Scholar]
- 2.Goetzl EJ, Brash AR, Tauber AI, Oates JA, Hubbard WC. Immunology. 1980;39:491–501. [PMC free article] [PubMed] [Google Scholar]
- 3.Ford-Hutchinson AW, Bray MA, Doig MV, Shipley ME, Smith MJ. Nature. 1980;286:264–265. doi: 10.1038/286264a0. [DOI] [PubMed] [Google Scholar]
- 4.Powell WS. J Biol Chem. 1984;259:3082–3089. [PubMed] [Google Scholar]
- 5.Kikuta Y, Kusunose E, Endo K, Yamamoto S, Sogawa K, Fujii-Kuriyama Y, Kusunose M. J Biol Chem. 1993;268:9376–9380. [PubMed] [Google Scholar]
- 6.Kalsotra A, Cui X, Antonovic L, Robida AM, Morgan ET, Strobel HW. FEBS Lett. 2003;555:236–242. doi: 10.1016/s0014-5793(03)01240-7. [DOI] [PubMed] [Google Scholar]
- 7.Kikuta Y, Kusunose E, Kondo T, Yamamoto S, Kinoshita H, Kusunose M. FEBS Lett. 1994;348:70–74. doi: 10.1016/0014-5793(94)00587-7. [DOI] [PubMed] [Google Scholar]
- 8.Sumimoto H, Kusunose E, Gotoh Y, Kusunose M, Minakami S. J Biochem (Tokyo) 1990;108:215–221. doi: 10.1093/oxfordjournals.jbchem.a123183. [DOI] [PubMed] [Google Scholar]
- 9.Hagmann W, Korte M. Biochem J. 1990;267:467–470. doi: 10.1042/bj2670467. [DOI] [PMC free article] [PubMed] [Google Scholar]
- 10.Wheelan P, Hankin JA, Bilir B, Guenette D, Murphy RC. J Pharmacol Exp Ther. 1999;288:326–334. [PubMed] [Google Scholar]
- 11.Jin R, Koop DR, Raucy JL, Lasker JM. Arch Biochem Biophys. 1998;359:89–98. doi: 10.1006/abbi.1998.0880. [DOI] [PubMed] [Google Scholar]
- 12.Johnson EF, Palmer CN, Griffin KJ, Hsu MH. Faseb J. 1996;10:1241–1248. doi: 10.1096/fasebj.10.11.8836037. [DOI] [PubMed] [Google Scholar]
- 13.Kalsotra A, Anakk S, Boehme CL, Strobel HW. Drug Metab Dispos. 2002;30:1022–1028. doi: 10.1124/dmd.30.9.1022. [DOI] [PubMed] [Google Scholar]
- 14.Chen L, Hardwick JP. Arch Biochem Biophys. 1993;300:18–23. doi: 10.1006/abbi.1993.1003. [DOI] [PubMed] [Google Scholar]
- 15.Kawashima H, Kusunose E, Thompson CM, Strobel HW. Arch Biochem Biophys. 1997;347:148–154. doi: 10.1006/abbi.1997.0342. [DOI] [PubMed] [Google Scholar]
- 16.Mizukami Y, Sumimoto H, Takeshige K. Biochem Biophys Res Commun. 2004;314:104–109. doi: 10.1016/j.bbrc.2003.12.062. [DOI] [PubMed] [Google Scholar]
- 17.Kikuta Y, Yamashita Y, Kashiwagi S, Tani K, Okada K, Nakata K. Biochim Biophys Acta. 2004;1683:7–15. doi: 10.1016/j.bbalip.2004.03.007. [DOI] [PubMed] [Google Scholar]
- 18.Christmas P, Ursino SR, Fox JW, Soberman RJ. J Biol Chem. 1999;274:21191–21199. doi: 10.1074/jbc.274.30.21191. [DOI] [PubMed] [Google Scholar]
- 19.Christmas P, Jones JP, Patten CJ, Rock DA, Zheng Y, Cheng SM, Weber BM, Carlesso N, Scadden DT, Rettie AE, Soberman RJ. J Biol Chem. 2001;276:38166–38172. doi: 10.1074/jbc.M104818200. [DOI] [PubMed] [Google Scholar]
- 20.Bylund J, Harder AG, Maier KG, Roman RJ, Harder DR. Arch Biochem Biophys. 2003;412:34–41. doi: 10.1016/s0003-9861(03)00030-4. [DOI] [PubMed] [Google Scholar]
- 21.Kikuta Y, Kusunose E, Ito M, Kusunose M. Arch Biochem Biophys. 1999;369:193–196. doi: 10.1006/abbi.1999.1271. [DOI] [PubMed] [Google Scholar]
- 22.Xu F, Falck JR, Ortiz de Montellano PR, Kroetz DL. J Pharmacol Exp Ther. 2004;308:887–895. doi: 10.1124/jpet.103.059626. [DOI] [PubMed] [Google Scholar]
- 23.Bylund J, Hidestrand M, Ingelman-Sundberg M, Oliw EH. J Biol Chem. 2000;275:21844–21849. doi: 10.1074/jbc.M001712200. [DOI] [PubMed] [Google Scholar]
- 24.Bylund J, Bylund M, Oliw EH. Biochem Biophys Res Commun. 2001;280:892–897. doi: 10.1006/bbrc.2000.4191. [DOI] [PubMed] [Google Scholar]
- 25.Cui X, Kawashima H, Barclay TB, Peters JM, Gonzalez FJ, Morgan ET, Strobel HW. J Pharmacol Exp Ther. 2001;296:542–550. [PubMed] [Google Scholar]
- 26.Kalsotra A, Turman CM, Kikuta Y, Strobel HW. Toxicol Appl Pharmacol. 2004;199:295–304. doi: 10.1016/j.taap.2003.12.033. [DOI] [PubMed] [Google Scholar]
- 27.Kikuta Y, Kusunose E, Sumimoto H, Mizukami Y, Takeshige K, Sakaki T, Yabusaki Y, Kusunose M. Arch Biochem Biophys. 1998;355:201–205. doi: 10.1006/abbi.1998.0724. [DOI] [PubMed] [Google Scholar]
- 28.Sumimoto J, Takeshige K, Minakami S. Eur J Biochem. 1988;172:315–324. doi: 10.1111/j.1432-1033.1988.tb13889.x. [DOI] [PubMed] [Google Scholar]
- 29.Sumimoto H, Isobe R, Mizukami Y, Minakami S. FEBS Lett. 1993;315:205–210. doi: 10.1016/0014-5793(93)81165-v. [DOI] [PubMed] [Google Scholar]
- 30.Mizukami Y, Sumimoto H, Isobe R, Minakami S. Biochim Biophys Acta. 1993;1168:87–93. [PubMed] [Google Scholar]
- 31.Marcus AJ, Safier LB, Ullman HL, Broekman MJ, Islam N, Oglesby TD, Gorman RR. Proc Natl Acad Sci U S A. 1984;81:903–907. doi: 10.1073/pnas.81.3.903. [DOI] [PMC free article] [PubMed] [Google Scholar]
- 32.Heinemeyer T, Wingender E, Reuter I, Hermjakob H, Kel AE, Kel OV, Ignatieva EV, Ananko EA, Podkolodnaya OA, Kolpakov FA, Podkolodny NL, Kolchanov NA. Nucleic Acids Res. 1998;26:362–367. doi: 10.1093/nar/26.1.362. [DOI] [PMC free article] [PubMed] [Google Scholar]
- 33.Cui X, Strobel H. Gene. 2002;297:179. doi: 10.1016/s0378-1119(02)00885-5. [DOI] [PubMed] [Google Scholar]
- 34.Kawashima H, Strobel HW. Biochem Biophys Res Commun. 1995;217:1137–1144. doi: 10.1006/bbrc.1995.2887. [DOI] [PubMed] [Google Scholar]
- 35.Turkson J, Ryan D, Kim JS, Zhang Y, Chen Z, Haura E, Laudano A, Sebti S, Hamilton AD, Jove R. J Biol Chem. 2001;276:45443–45455. doi: 10.1074/jbc.M107527200. [DOI] [PubMed] [Google Scholar]
- 36.Kikuta Y, Kusunose E, Kusunose M. Prostaglandins Other Lipid Mediat. 2002;68-69:345–362. doi: 10.1016/s0090-6980(02)00039-4. [DOI] [PubMed] [Google Scholar]
- 37.Serhan CN. Prostaglandins. 1997;53:107–137. doi: 10.1016/s0090-6980(97)00001-4. [DOI] [PubMed] [Google Scholar]
- 38.Boucher JL, Delaforge M, Mansuy D. Biochem Biophys Res Commun. 1991;177:134–139. doi: 10.1016/0006-291x(91)91958-f. [DOI] [PubMed] [Google Scholar]
- 39.Palmblad J, Malmsten CL, Uden AM, Radmark O, Engstedt L, Samuelsson B. Blood. 1981;58:658–661. [PubMed] [Google Scholar]
- 40.Jisaka M, Kim RB, Boeglin WE, Nanney LB, Brash AR. J Biol Chem. 1997;272:24410–24416. doi: 10.1074/jbc.272.39.24410. [DOI] [PubMed] [Google Scholar]
- 41.Stark K, Wongsud B, Burman R, Oliw EH. Arch Biochem Biophys. 2005;441:174–181. doi: 10.1016/j.abb.2005.07.003. [DOI] [PubMed] [Google Scholar]
- 42.Stark K, Bylund J, Torma H, Sahlen G, Oliw EH. Prostaglandins Other Lipid Mediat. 2005;75:47–64. doi: 10.1016/j.prostaglandins.2004.09.014. [DOI] [PubMed] [Google Scholar]
- 43.Morgan ET. Drug Metab Rev. 1997;29:1129–1188. doi: 10.3109/03602539709002246. [DOI] [PubMed] [Google Scholar]
- 44.Aitken AE, Richardson TA, Morgan ET. Annu Rev Pharmacol Toxicol. 2005 doi: 10.1146/annurev.pharmtox.46.120604.141059. [DOI] [PubMed] [Google Scholar]
- 45.Darnell JE., Jr Science. 1997;277:1630–1635. doi: 10.1126/science.277.5332.1630. [DOI] [PubMed] [Google Scholar]
- 46.Ihle JN. Cell. 1996;84:331–334. doi: 10.1016/s0092-8674(00)81277-5. [DOI] [PubMed] [Google Scholar]
- 47.Poli V, Mancini FP, Cortese R. Cell. 1990;63:643–653. doi: 10.1016/0092-8674(90)90459-r. [DOI] [PubMed] [Google Scholar]
- 48.Moore KW, de Waal Malefyt R, Coffman RL, O’Garra A. Annu Rev Immunol. 2001;19:683–765. doi: 10.1146/annurev.immunol.19.1.683. [DOI] [PubMed] [Google Scholar]
- 49.Bogdan C, Nathan C. Ann N Y Acad Sci. 1993;685:713–739. doi: 10.1111/j.1749-6632.1993.tb35934.x. [DOI] [PubMed] [Google Scholar]
- 50.Serhan CN. Histochem Cell Biol. 2004;122:305–321. doi: 10.1007/s00418-004-0695-8. [DOI] [PubMed] [Google Scholar]
- 51.Serhan CN, Savill J. Nat Immunol. 2005;6:1191–1197. doi: 10.1038/ni1276. [DOI] [PubMed] [Google Scholar]
- 52.Serhan CN, Haeggstrom JZ, Leslie CC. Faseb J. 1996;10:1147–1158. doi: 10.1096/fasebj.10.10.8751717. [DOI] [PubMed] [Google Scholar]
- 53.Fiedler J, Simon FR, Iwahashi M, Murphy RC. J Pharmacol Exp Ther. 2001;299:691–697. [PubMed] [Google Scholar]
- 54.Okuno T, Yokomizo T, Hori T, Miyano M, Shimizu T. J Biol Chem. 2005;280:32049–32052. doi: 10.1074/jbc.R500007200. [DOI] [PubMed] [Google Scholar]
Associated Data
This section collects any data citations, data availability statements, or supplementary materials included in this article.
Supplementary Materials
Table S1. Sequences of 5’ RACE primers for rat CYP4F genes.
Table S2. Sequences of primers for rat LTB4 receptor expression.
Table S3. Sequences around splicing sites of rat CYP4F genes.
Figure S1 Genomic Structure and Intron-Exon distribution of CYP4F genes.
- Determination of transcription start site by RACE-PCR.
- Identification of transcription start sites (TSS).