

Abstract
The prevalence of hazardous incidents induced by attentional impairment during night work and ensuing commute times is attributable to circadian misalignment and increased sleep pressure. In a 10-day shift work simulation protocol (four day shifts and three night shifts), we compared the efficacy of two countermeasures against nighttime (2300 – 0700) attentional impairment: (1) Morning Sleep (0800 – 1600; n = 18) in conjunction with a phase delaying light exposure (2300 – 0300), and (2) Evening Sleep (1400 – 2200; n = 17) in conjunction with a phase advancing light exposure (0300 – 0700).
Analysis of the Dim Light Salivary Melatonin Onset indicated a modest but significant circadian realignment in both sleep groups (Evening Sleep: 2:16 ± 00:36 h phase advance, p < 0.01; Morning Sleep: 4:59 ± 00:25 h phase delay, p < 0.01). Daytime sleep efficiency and total sleep time did not differ between them or from their respective baseline sleep (2200 – 0600; p > 0.05). However, on the final night shift, the Evening Sleep subjects had 37 percent fewer episodes of attentional impairment (long RTs: 22 ± 4 vs. 35 ± 4; p = 0.02) and quicker responses (p < 0.01) on the Psychomotor Vigilance Task than their Morning Sleep counterparts. Their response speed recovered to near daytime levels (p = 0.47), whereas those of the Morning Sleep subjects continued to be slower than their daytime levels (p = 0.008).
We conclude that partial circadian realignment to night work in combination with reduced homeostatic pressure contributed to the greater efficacy of a schedule of evening sleep with a phase advancing light exposure as a countermeasure against attentional impairment, over a schedule of morning sleep with a phase delaying light exposure. These results have important implications for managing patients with Shift Work Disorder.
Keywords: Circadian Misalignment, Sleep, Attentional Impairment, Response Time, Shift work
Introduction
During night work, individuals operate in a dangerous landscape of circadian misalignment and high homeostatic sleep pressure (Costa, 1997) resulting in impaired attention. Because the circadian system does not instantly realign itself to the inverted sleep-wake schedule required on night shifts, individuals are compelled to work at the circadian nadir of alertness. Conversely, they are forced to sleep at the circadian incline of wake propensity, often resulting in insomnia during daytime sleep episodes (U.S. Congress and Office of Technology Assessment, 1991). Furthermore, the typical pattern of sleeping in the morning after night work results in a lengthy duration of wakefulness prior to night work (Monk, 2000), exacerbating sleep pressure on the night shift. Because deterioration in cognitive functioning at the circadian alertness nadir worsens with increased homeostatic sleep pressure (Dijk et al., 1992; Jewett and Kronauer, 1999), attentional impairment can be substantial during nighttime operations (Banks and Dinges, 2007; McCarthy and Waters, 1997).
Timed bright light exposure is one of the most effective technologies for reducing circadian misalignment in humans (Crowley et al., 2003; Czeisler et al., 1990; Czeisler et al., 1992a; Czeisler et al., 1992b; Horowitz et al., 2001). In humans, bright light exposure early in the biological night delays circadian timing, while bright light exposure late in the biological night advances circadian timing (Khalsa et al., 2003). However, the levels of light exposure employed to shift the circadian clock have typically been fairly high, ranging from 2,500 – 10,000 lux (Crowley et al., 2003; Czeisler et al., 1990; Horowitz et al., 2001), far above the lighting in a usual work environment. Bringing these findings to an operational setting could require the installation of expensive equipment depending on the scale and magnitude of the work environment. A lower intensity light that is still effective as a circadian resetting stimulus would therefore be desirable (Daurat et al., 1996).
A complementary method to achieve circadian realignment to night work is to have the individual adopt a fixed daytime sleep schedule (Boivin and James, 2002; Horowitz et al., 2001). As with the light exposure, the timing of sleep is crucial. From a homeostatic point of view, sleeping in the evening before the night shift rather than in the morning after the night shift would be better, as this would considerably reduce wakefulness prior to work. However, evening sleep is hard to initiate and maintain, as this time of the day spans the wake-maintenance zone, a time when the circadian propensity for wakefulness is highest (Dijk and Czeisler, 1994). Moreover, it is the prime leisure time of the day and many shift workers may be reluctant to substitute leisure for sleep (Baker et al., 2004).
We conjectured that combining the two strategies could make it possible to both reduce homeostatic pressure and improve circadian realignment during night work. We tested two hypotheses. First, we hypothesized that realigning subjects to ‘Evening Sleep’ would be more effective in reducing nighttime attentional impairment than realigning them to the traditional ‘Morning Sleep’. Second, we hypothesized, based on the saturating non-linear relationship between light intensity and the phase-shifting effect of light (Boivin et al., 1996; Zeitzer et al., 2000) and previous data (Martin and Eastman, 1998), that the resetting response to a moderate intensity light (600 lux) would be comparable to that of brighter light (2500 lux) (Czeisler et al., 1992a; Czeisler et al., 1992b).
We measured performance in the Psychomotor Vigilance Task (PVT) to examine nighttime attentional impairment. We conjectured that the effect of cognitive slowing would be primarily reflected in the shift (median response time) in the cumulative PVT response time (RT) distribution (Ratcliff, 1979) across different conditions, while the effect of attentional impairment would be primarily reflected in the change in the shape (long RTs and the slope) of the cumulative RT distribution across different conditions (Godefroy et al., 2002; Miller and Ulrich, 2003).
Methods
Participants
Twenty-one men and fourteen women (mean age ± SD: 28.4 ± 4.8 years) participated in the study. They were all healthy, as determined from a screening evaluation, which included a complete physical examination, clinical biomedical tests on blood and urine, electrocardiogram, psychological tests (MMPI and Beck Depression Inventory) and a Sleep Disorders Questionnaire. They also reported not having engaged in shift work for at least three years prior to enrolling in the protocol. All the participants gave written informed consent before starting the protocol, which was approved by the Human Research Committee of the Partners HealthCare System and was in accordance with the Helsinki Protocol.
Pre-Study Conditions
Participants maintained their habitual sleep-wake time and duration until the start of the simulated shift-work segment. For a week prior to this segment they were asked to wear a wrist-mounted actigraph also equipped with a light sensor (Actiwatch-L, MiniMitter, Bend, OR), maintain a paper sleep diary and call a time stamped voicemail system at their bedtime (mean ± SD: 00:31 h ± 1:11 h) and wake-time (8:45 h ± 1:21 h) every day.
Shift-Work Simulation
The protocol (Figure 1) included 7 work episodes (four consecutive day shifts: 0700–1500; three consecutive night shifts: 2300-0700), 2 circadian phase assessment segments (a 6 hour constant posture [CP] and a 38 hour constant routine [CR]) and 8 sleep episodes (Santhi et al., 2005). Subjects were in the laboratory during the work and sleep episodes, with the exception of the first sleep episode which occurred at home. In between work and sleep, they left the laboratory and were free to engage in normal activity with the constraint that they avoid napping. Compliance with this constraint was ascertained by continuously monitoring activity with a wrist-mounted actigraph.
Figure 1. Double Raster Plots of the Shift Work Protocol.
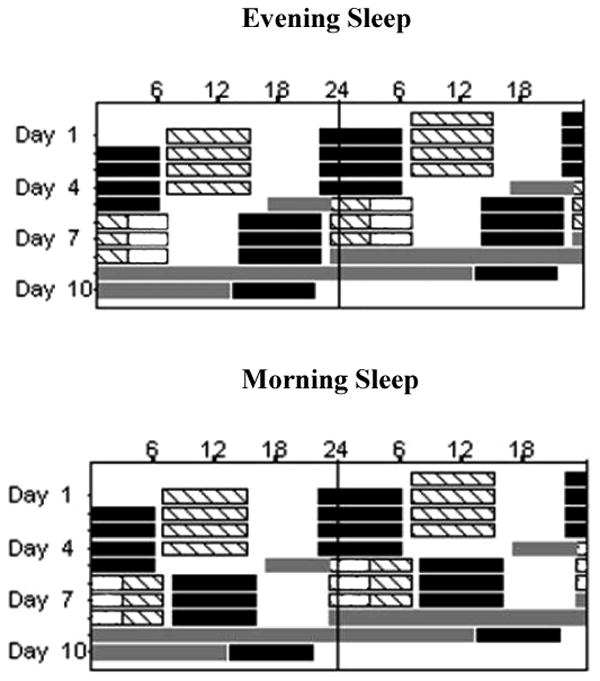
The x-axis represents clock time and the y-axis represents the day of the study. Hashed bars represent work shifts (day shift: 0700 – 1500; night shifts: 2300 – 0700). The open bars on the night shifts represent light exposure (Evening Sleep: 2300 – 0300; Morning Sleep: 0300 – 0700). The black bars represent the sleep episodes (Baseline Sleep: 2200-0600; Morning Sleep: 0800 –1600; Evening Sleep: 1400 – 2200). Time spent outside the laboratory was from 1530 – 2100 on day shifts and on night shifts it was from 0730-1300 for the Evening Sleep group and from 1630 – 2200 for the Morning Sleep group. The gray bars represent the constant posture (CP) episode and constant routine (CR).
On the day shifts all subjects slept from 2200 – 0600 and were outside the laboratory from 1530 - 2100. For the night shifts, prior to starting the protocol, subjects were randomized to one of two sleep schedules: Evening Sleep (Figure 1, top panel; n = 17) or Morning Sleep (Figure 1, bottom panel; n = 18). The Evening Sleep group slept from 1400 – 2200 (an 8 h advance relative to baseline sleep) and was outside the laboratory prior to their sleep episode from 0730 – 1300. Light exposure was scheduled from 0300-0700 to advance the circadian rhythms to an earlier hour. (Czeisler et al., 1992a; Czeisler et al., 1992b). The Morning Sleep group slept from 0800 – 1600 (a 10 h delay relative to baseline sleep) and was outside the laboratory after their sleep episode from 1630 – 2200. Light exposure was scheduled from 2300 – 0300 to delay circadian rhythms to a later hour (Czeisler et al., 1992a; Czeisler et al., 1992b; Khalsa et al., 2003). For the white light exposure, prior to starting the protocol, participants were randomized to one of two illumination levels: Moderate intensity (1.18 W/m2 measured at 137 cm from the floor in the horizontal angle anywhere in the room; ∼600 Lux maximum) or Bright light (4.87 W/m2; ∼2500 Lux maximum). Except for the duration of the light exposure, the average illumination in the room on all the work shifts was approximately 0.23 W/m2 (∼89 Lux; ∼150 Lux maximum). Lighting was provided by ordinary commercially available ceiling-mounted fluorescent lamps with a standard color temperature of 4110K (model numbers: F96T12/41U/HO/EW, 95W; F32T8/ADV841/A, 32W and F25T8/TL841, 25W; Philips Lighting, the Netherlands). Subjects slept in darkness.
Circadian Phase Measurement
Our markers of circadian phase were the Dim Light Salivary Melatonin Onset (DLSMO), the midpoint of the melatonin rhythm, and the nadir of the endogenous core body temperature rhythm (CBTmin). DLSMO was assessed from saliva samples collected hourly during CP and CR and the melatonin midpoint from saliva samples collected during CR. The saliva samples were assayed for melatonin concentration using a double-antibody radioimmunoassay (assay sensitivity < 0.7 pg/ml, inter-assay coefficient of variability 13.5% at 3.4 ± 0.5 pg/mL, 12.6% at 89.3 ± 11.2 pg/mL, intra assay coefficient of variability of 3.7% at 145.74 ± 5.45 pg/ml, 6% at 2.62 ± 0.16 pg/ml; Pharmasan Inc, Osceola WI). A 3-harmonic model was fit to the CR data, and 25% of the fitted maximum (DLSMO25%) was designated as the melatonin onset threshold. Initial and final phases were defined as the time when melatonin levels reached this threshold during CP and CR, respectively. The midpoint of the melatonin rhythm was defined as the midpoint between the calculated 25% upward and 25% downward crossing points of the CR melatonin secretion episode. Core body temperature was continuously monitored via a rectal thermistor (Yellow Springs Instruments, Yellow Springs, OH) during CR and the nadir of this temperature rhythm was calculated by fitting a 2-harmonic model to the data (Brown et al., 2000).
Measuring Attention
We measured RT in PVT to assess nighttime attentional impairment and cognitive slowing. This task required subjects to monitor the center of a computer display for the appearance of a rapid serial stream of increasing numbers presented at fixation, indicating elapsed time since signal onset (Dorrian et al., 2005; Jewett et al., 1999). They were instructed to respond as soon as they detected the stimulus by pressing a button, whereupon the digit stream stopped giving them instant RT feedback. The inter-stimulus interval varied randomly between 1000 ms and 9000 ms and the task lasted twenty minutes.
Our markers of cognitive slowing and attentional impairment were the median RT, count of long RTs and the shape parameter (slope) of the RT cumulative distribution function (CDF) (Luce, 1986) (Godefroy et al., 2002) (Miller and Ulrich, 2003). The average cumulative RT distribution was computed by averaging the individual cumulative RT distributions of each work episode (for details see) (Ratcliff, 1979) (Santhi et al., 2007). The 90th percentile (sensitive to sleep deprivation) of the daytime baseline RT distribution served as the cutoff threshold for a long RT and the number of RT's exceeding this threshold was computed for each of the four work shifts (Graw et al., 2004; Santhi et al., 2007). For each subject, the count of long RTs was based on their individual threshold. Given the high inter-individual variability in processing speed and susceptibility to cognitive impairment arising from sleep deprivation and/or circadian misalignment (Van Dongen et al., 2004), we felt that adjusting the threshold on an individual basis instead of choosing an arbitrary threshold and applying it to all subjects would constitute an improved approach to measuring nighttime attentional impairment. We also analyzed a second measure, the slope of the CDF (four-parameter Weibull).
Measuring Subjective Alertness
Scores from the Karolinska Sleepiness Scale (KSS) served as a measure of subjective alertness (Åkerstedt and Gillberg, 1990). The KSS was a computerized 9-point numerical rating scale with corresponding verbal descriptions for the odd numbered values. Higher values on this scale indicate lower levels of alertness (increasing sleepiness). Subjects were asked to rate their sleepiness by choosing the appropriate value on this scale.
Sleep
Sleep was polysomnographically (PSG) recorded during each scheduled sleep episode in the laboratory using the Vitaport II digital recorder (Temec, Kerkrade, The Netherlands). The recordings included the central (C3 and C2), occipital (O1 and O3) and frontal (F3, F4) electroencephalogram (EEG) referenced to linked mastoids (A1-A2) as well as the electrooculogram (EOG), and sub-mental electromyogram (EMG). Signals were amplified (time constants for EEG: 1.000 sec, EOG: 1.000 sec, EMG: 0.150 sec), low-pass filtered at (Butterworth, 12dB/octave; -6dB at 30 Hz), digitized (256 Hz), stored (128 Hz) to flash-RAM card, and downloaded to a personal computer. All sleep recordings were scored visually in 30-second epochs according to standardized criteria (Rechtschaffen and Kales, 1968). The primary sleep outcome measures were Total Sleep Time (TST), sleep efficiency, sleep latency (to first occurrence of any sleep other than stage 1), wake after sleep onset (WASO), and minutes of each stage of sleep [Stages 1, 2, and SWS (Stages 3 & 4 combined) and REM sleep].
Statistical Analysis
The data were analyzed with ANOVA (univariate, repeated measures and mixed-model; α = 0.05 significance level) and planned comparisons (t-test, F-test; α = 0.05 significance level) using the statistical packages SAS (version 9.1), SPSS (Graduate student version 12.0), Sigmaplot (version 9.0) for personal computers.
For repeated measures ANOVA we applied the Mauchy's Test of Sphericity, and used the Huyhn-Feldt correction where appropriate. For the mixed-model ANOVA, the residual maximum likelihood method was used for fitting the model and the containment method was used to compute the degrees of freedom. Random effects were specified with an intercept-slope model and the variance components formed the covariance structure. The residual sum of squares from RT CDF (4-parameter weibull) was used to compute the F-value for the planned comparisons between the fitted RT distributions (Motulsky and Christopoulos, 2003).
Circadian Phase
DLSMO25% was analyzed with a three-factor repeated-measures ANOVA model with time (Initial and Final circadian assessments) as the within-subjects factor, and sleep schedule (Evening Sleep vs. Morning Sleep) and light intensity (600 lux vs. 2500 lux) as between-subjects factors. The melatonin midpoint and CBTmin were analyzed with a univariate two-factor ANOVA model, with sleep schedule and light intensity as between-subjects factors. Two subjects were excluded from all analyses for the following reasons: in one subject (Morning Sleep, 2500 lux) the data were insufficient to calculate DLSMO25%; in the other subject (Evening Sleep, 600 lux) the final DLSMO25% (Phase delay: 4:18 h; Figure 2, top left panel) was categorized as an outlier based on Tukey's definition (Tukey, 1997). In addition, three subjects were excluded from the analysis of the melatonin midpoint and two from the analysis of the CBTmin because loss of data rendered it difficult to reliably estimate these measures.
Figure 2. DLSMO25% in the Evening and Morning Sleep groups.

These data represent the individual DLSMO25% (filled circles), and average (mean ± SEM) DLSMO25% (open circles) and average CBTmin (inverted triangles) for the four sleep × light intensity groups. The x-axis represents clock time and the y-axis represents the endogenous circadian phase assessments. The horizontal hashed bars represent the night shifts and the open bars the timing of the Light Exposure respectively. In the Evening Sleep group, 7 out of 8 subjects in the 600 lux condition and all subjects in the 2500 lux (n = 8) condition exhibited a phase advance in DLSMO25%. One subject (gray circle, top left panel) in the Evening Sleep, 600 lux condition exhibited 4:18 h phase delay and another a 12 minute phase delay. In the Morning Sleep group, all subjects in the 600 lux (n = 9) and 2500 lux (n = 8) conditions exhibited a phase delay. CBTmin in the Evening Sleep subjects (600 lux: 1:13 ± 1:12 h; 2500 lux: 23:46 ± 1:02 h) was phase advanced relative to the Morning Sleep subjects (600 lux: 8:43 ± 0:59 h; 2500 lux: 8:24 ± 0:59 h).
Attention and Subjective Alertness
For these measures, the daytime baseline values comprised the average of the third and fourth day shifts. The first two day shifts were excluded to reduce confounding effects of practice and acclimation to the laboratory conditions (Santhi et al., 2007). RTs less than 100 ms were excluded from the analyses as anticipations. All RT data were log transformed prior to analyses to normalize them. Since an initial analysis indicated that there was no differential effect of light intensity on these dependant measures, we only report analyses with the data pooled over light intensity.
The median RT, long RTs and KSS scores were analyzed with the mixed model ANOVA with work episode (day shift, first, second and third night shifts) and session (1, 2, 3, 4) as within-subjects factors and sleep schedule (Evening Sleep and Morning Sleep) as the between subjects factor. Planned comparisons were done with t-tests and the F-tests.
Sleep
For this analysis we focused on the following four sleep episodes: Baseline sleep, i.e. the nighttime sleep following the fourth day shift; and the three daytime sleep episodes following the first (day sleep 1); second (day sleep 2); and third (day sleep 3) night shifts. The sleep episode following the second and third day shifts were the excluded to minimize effects of acclimation to laboratory conditions (sleep episode following the first day shift occurred at home).
The PSG data were analyzed with a mixed-model ANOVA with sleep episode (baseline, day sleep 1, day sleep 2 and day sleep 3) as the within-subjects factor and sleep schedule (Evening Sleep and Morning Sleep) as the between-subjects factor. Additionally, for day sleep 3, we analyzed TST and REM sleep by thirds of the sleep episode, to further examine differences in sleep structure between Evening Sleep and Morning Sleep. Comparisons of the sleep parameters between Sleep schedules and Sleep episodes were done with t-tests.
Three additional subjects from the Morning Sleep group (2500 lux: 2 subjects; 600 lux: 1 subject) were excluded from this analysis because of insufficient data due to technical problems.
Results
Circadian Phase
The average (mean + SEM) and individual DLSMO25% values are shown in Figure 2. There was a significant change in the timing of the final DLSMO25% relative to initial DLSMO25% (Time: p < 0.01), and this change was different between the two sleep groups (Sleep Schedule: p < 0.01; Time × Sleep Schedule: p < 0.01). Comparisons between the initial and final phases showed a significant phase advance (Figure 2; upper panels) in the 600 lux (initial: 20:34 ± 00:20 h; final: 18:22 ± 00:44 h; n = 7) and 2500 lux (initial: 20:56 ± 00:19 h; final: 17:30 ± 00:35 h; n = 8) Evening Sleep subjects and a significant phase delay (Figure 2; lower panels) in their 600 lux (initial: 21:11 ± 00:13 h; final: 02:18 ± 00:40 h; n = 9) and 2500 lux (initial: 20:59 ± 00:23 h; final: 01:59 ± 00:53 h; n = 8) Morning Sleep counterparts. The timing of the initial DLSMO25%s did not differ significantly between any of the groups.
The timing of the melatonin midpoint and CBTmin were also significantly different between the two sleep groups (Sleep Schedule: p < 0.01). The timing of the melatonin midpoint (mean ± SEM) of both the Evening Sleep groups (600 lux: 23:08 ± 00:53 h; 2500 lux: 22:25 ± 00:42 h) was significantly advanced (p < 0.01) relative to their Morning Sleep counterparts (600 lux: 7:00 ± 00:46 h; 2500 lux: 6:48 ± 00:46 h). A similar result was observed with the timing of CBTmin (p < 0.01; Figure 2). There was no differential effect of light intensity on DLSMO25%, the melatonin midpoint or CBTmin.
Attention
Cognitive Slowing
The cumulative RT distributions are shown in Figure 3. Comparisons (F-test) of the fitted distributions between the first night shift and day shift indicated a significant cognitive slowing on the first night shift in both sleep groups (p = 0.04). This impairment persisted on the third night shift in the Morning Sleep group (p = 0.04) but not in the Evening Sleep group (p = 0.06). A similar tendency was seen on the second night shift (Morning Sleep: p = 0.04; Evening Sleep: p = 0.05). A comparison between the two sleep groups indicated the Morning Sleep subjects were significantly slower than their Evening Sleep counterparts on the third night shift (p = 0.04).
Figure 3. PVT Cumulative Response Time Distribution.

The data represent the average RT percentiles (Mean ± SEM; symbols) and the fitted CDF (4-parameter Weibull) for the four work shifts. The data for each sleep group (Morning Sleep: n = 17; Evening Sleep: n = 16) is averaged over the light exposure conditions. The PVT was administered every two hours starting at 0830 on the day shifts and at 0030 on the night shifts. The bottom x-axis represents Log transformed RT and the top x-axis the equivalent RT in milliseconds. The y-axis represents percentile points. A rightward shift along the x-axis corresponds to a lengthening of RT and a stretching of the tail of the distribution corresponds to an increase in long RT. The ‘∼’ represents a comparison with the day shift RT curve (F-test) at p = 0.05 level.
There was an effect of Work Episode (p < 0.0001), Session (p = 0.01) and a tendency for a Work Episode × Session Interaction (p = 0.053) on the median RT. A comparison between the day shift and the three night shifts showed that median RT was significantly longer on the first night shift in both sleep groups (p < 0.001). This difference from the day shift persisted on the remaining two night shifts only in the Morning Sleep group (p < 0.01). Consistent with this, comparisons between session 1 and session 4 on the second and third night shifts revealed a significant slowing of RT in session 4 only in the Morning Sleep group (2nd night shift: p = 0.04; 3rd night shift: p = 0.02).
Attentional Impairment
This analysis is summarized in the top panel of Figure 4 and the upper half of Table 1 (mean + SEM). There was an effect of Work Episode (p < 0.0001) and a significant Sleep × Work Episode interaction (p = 0.004) on the number of long RTs. A comparison between the day shift and each of the three night shifts confirmed a significant increase in attentional impairment on the first night shift in both sleep groups (p < 0.01) although it persisted on the remaining two night shifts only in the Morning Sleep group (p < 0.01). A comparison between the two sleep groups indicated that on the third night shift there were 60% more of these extreme RT's in the Morning Sleep group (p < 0.01); even on the second night shift the Morning Sleep group exhibited a greater tendency (37% more) for these extreme RTs (p = 0.08).
Figure 4. Episodes of Attentional Impairment and Subjective Alertness.

The top panel shows the number of long RTs (Mean ± SEM) per work shift for the two sleep groups (Morning Sleep: n = 17; Evening Sleep: n = 16) averaged over the light exposure conditions. The x-axis represents work shift and the y-axis represents the number of RT outliers. Increasing values reflect increasing attentional impairment.
The bottom panel shows the KSS scores (Mean ± SEM) per work shift for the two sleep groups (Morning Sleep: n = 17; Evening Sleep: n = 16) averaged over the light exposure conditions. The x-axis represents work shift and the y-axis represents the KSS score. Increasing values reflect deteriorating alertness. The KSS was administered every two hours starting at 0830 on the day shifts and at 0030 on the night shifts. The symbols ‘*’ and ‘∼’ represent a comparison to baseline sleep at the p < 0.01 and p < 0.05 level respectively (paired t-test).
Table 1. Attentional Impairment across Night Shifts 2 and 3.
The data represent the number of long RTs per session (mean ± SEM) on the second and third night shifts in the Morning Sleep (n = 17) and Evening Sleep (n = 16) groups. The p-values are based on the comparisons (unpaired t-test) of attentional impairment in each session between them.
| Attentional Impairment | Session 1
00:30 h |
Session 2
02:30 |
Session
04:39 h |
Session
06:30 |
|---|---|---|---|---|
| 2nd Night Shift | ||||
| Evening | 17 ± 5 | 22 ± 5 | 33 ± 5 | 39 ± 5 |
| Morning | 22 ± 5 | 36 ± 5 | 40 ± 5 | 52 ± 5 |
| p-value | 0.44 | 0.06 | 0.34 | 0.07 |
| 3rd Night Shift | ||||
| Evening | 13 ± 5 | 19 ± 5 | 27 ± 5 | 31 ± 5 |
| Morning | 23 ± 5 | 30 ± 5 | 40 ± 5 | 49 ± 5 |
| p-value | 0.19 | 0.11 | 0.08 | 0.01 |
There was also an effect of Session (p<.0001) and a significant Work Episode × Session interaction (p < 0.0001) on the long RTs. A comparison between sessions 1 and 4 indicated that, in contrast to the day shift (p > 0.05) there were significantly more long RTs at the end of all the night shifts in both sleep groups (p < 0.01). However, a comparison between the two sleep groups revealed that on the two latter night shifts there were significantly more long RTs in the Morning Sleep group in sessions 2, 3 and 4 (Table 1).
The slope of the CDF on the first night shift was significantly larger than the day shift in both sleep groups (p < 0.01). This difference from the day shift persisted on the remaining night shifts only in the Morning Sleep group (p < 0.01).
Subjective Sleepiness
The KSS results are summarized in the bottom panel of Figure 4 (mean ± SEM). There was an effect of Work Episode (p < 0.0001) with a tendency for a Sleep × Work Episode interaction (p = 0.06). A comparison between the day shift and each of the three night shifts indicated that subjects in both groups felt sleepier on the first (p < 0.01) and second (p < .05) night shifts, but only the Morning sleep subjects continued to exhibit this impairment on the third night shift (p = 0.04). Also, on the third night shift the Morning sleep subjects tended to feel sleepier than their Evening Sleep counterparts (p = 0.07).
There was a significant effect of Session (p < 0.0001), a significant Work Episode × Session interaction (p < 0.0001) and a significant Sleep × Work Episode × Session interaction on the KSS scores (p < 0.0001). A comparison between sessions 1 and 4 indicated that, in contrast to the day shift (p >.05), subjective sleepiness was greater at the end of the first night shift in both sleep groups (p < 0.01). However, only the Morning Sleep subjects continued to exhibit this impairment on the remaining two night shifts (p < 0.01). A comparison between the sleep groups indicated that on these latter two night shifts, subjective sleepiness was significantly greater in sessions 3 (p < 0.05) and 4 (p < 0.01) in the Morning Sleep group.
Sleep
The sleep parameters for all sleep episodes are summarized in Table 2 and the results (mean ± SEM) of the analysis of day sleep 3 are shown in Figure 5.
Table 2. Sleep Parameters.
Data are derived from polysomnography and represent minutes (mean + SEM) unless indicated otherwise, for the Morning Sleep (0800 – 1600; n = 14) and Evening Sleep (1400 – 2200; n = 16) groups. Note that prior to Day Sleep 1, the Morning Sleep group had been awake for 26 hours while the evening sleep group for 32 hours. The symbols ‘*’ and ‘∼’ represent a comparison to baseline sleep at the p < 0.01 and p < 0.05 level respectively (paired t-test). The symbol ‘#’ represents a comparison between the Evening and Morning Sleep groups at the p<.01 (unpaired t-test). Sleep latencies were log-transformed for statistical comparisons. The reported comparisons between Sleep groups and Sleep Conditions were done when the corresponding main effect or interaction in the two-way ANOVA with the factors Sleep Group and Sleep Condition were significant.
| Sleep Parameters | Baseline | Day sleep 1 | Day sleep 2 | Day sleep 3 |
|---|---|---|---|---|
| TST | ||||
| Evening | 431.6 ± 12.8 | 424.4 ± 12.5 | 410.3 ± 12.5 | 428.9 ± 12.8 |
| Morning | 421.3 ± 13.4 | 403.6 ± 13.8 | 398.4 ± 13.8 | 417.61 ± 13.4 |
| Sleep Efficiency | ||||
| Evening | 89% ± 3% | 88% ± 3% | 86% ± 3% | 89% ± 3% |
| Morning | 88% ± 3% | 84% ± 3% | 83% ± 3% | 87% ± 3% |
| Sleep Latency | ||||
| Evening | 28.4 ± 3.3 | 7.1 ± 3.2 * | 14.6 ± 3.2 * | 13.1 ± 3.3 * |
| Morning | 32.5 ± 3.4 | 8.0± 3.5 * | 10.5 ± 3.4 * | 11.6 ± 3.4 * |
| WASO | ||||
| Evening | 18.0 ± 12.6 | 45.6 ± 12.3 ∼ | 52.5 ± 12.3 ∼ | 35.6 ± 12.6 |
| Morning | 24.0 ± 13.1 | 67.0 ± 13.5 * | 69.7 ± 13.5 * | 49.1 ± 13.1 |
| Stage 1 | ||||
| Evening | 35.9 ± 3.8 | 27.1 ± 3.7 * | 34.1 ± 3.7 | 35.3 ± 3.8 |
| Morning | 35.7 ± 4.0 | 29.8 ± 4.1 | 31.9 ± 4.1 | 37.6 ± 4.0 |
| Stage 2 | ||||
| Evening | 224.8 ± 10.5 | 225.4 ± 10.3 | 213.3 ± 10.3 | 227.7 ± 10.5 |
| Morning | 232.1 ± 11.0 | 208.5 ± 11.3 * | 195.9 ± 11.3 * | 205.7 ± 11.1 * |
| SWS | ||||
| Evening | 73.4 ± 8.1 | 96.4 ± 8.0 * | 80.1 ± 8.0 | 76.2 ± 8.1 |
| Morning | 60.3 ± 8.6 | 78.6 ± 8.7 * | 68.6 ± 8.7 | 69.8 ± 8.6 |
| REM | ||||
| Evening | 98.0 ± 5.5 | 75.8 ± 5.3 * | 82.7 ± 5.3 *# | 90.1 ± 5.5 |
| Morning | 93.2 ± 5.7 | 86.8 ± 5.9 | 102.2 ± 5.9 # | 104.5 ± 5.7 |
Figure 5. TST and REM Sleep on Day Sleep 3.

Distribution of TST (left panel) and REM sleep (right panel) across thirds of Day Sleep 3. Morning Sleep group is indicated by black bars (n = 14) and Evening Sleep group by gray bars (n = 16). Data represent the means + SEM.
Total Sleep Time and Sleep Efficiency did not differ significantly between sleep groups or sleep episodes. However, there was a decrease in sleep latency (p < 0.01) on all three daytime sleep episodes relative to baseline sleep, in both sleep groups. There was also an increase in WASO (p < 0.05) during day sleep 1 and day sleep 2 relative to baseline sleep, in both sleep groups. As expected based on the fact that subjects were awake longer prior to day sleep 1 than prior to baseline sleep, there was an increase in SWS (Morning Sleep: +32%, p < 0.01; Evening Sleep: +32%, p < 0.01) in both groups, together with a decrease in Stage 1 in the Evening sleep group (p < 0.05), and a decrease in Stage 2 in the Morning sleep group (p < 0.05). There was a decrease in REM sleep in the Evening Sleep group on day sleep 1 and day sleep 2 (p < 0.01). In the Morning Sleep group there were no significant differences in REM sleep between baseline sleep and the three daytime sleep episodes.
Analysis by thirds of day sleep 3 (Figure 5) revealed differences in the distribution of TST and REM sleep. In the last third of this sleep episode, TST was significantly reduced in the Morning Sleep group when compared to the Evening Sleep group (p < 0.03). There was significantly more REM sleep in the first third of this sleep episode in Morning Sleep compared to Evening Sleep (p = 0.003).
Discussion
The present results indicate that an evening sleep schedule when working night shifts is remarkably effective in reducing nighttime attentional impairment and cognitive slowing. Performance on the PVT on the second and third night shifts recovered to near daytime levels quite rapidly in subjects on the atypical ‘evening sleep’ schedule, while it continued to be worse than daytime levels in the subjects on the more typical ‘morning sleep’ schedule. Our physiological and PSG data lead us to conclude that this rapid recovery in the Evening Sleep subjects was attributable to the combination of reduced homeostatic sleep pressure and partial circadian realignment. It is noteworthy that a moderate light intensity (∼ 600 lux) was as effective a resetting stimulus as the bright light (∼ 2500 lux).
The pronounced attentional impairment on the first night shift is consistent with results from other studies (Purnell et al., 2002; Santhi et al., 2007) and the finding that that the circadian impact on cognitive function is amplified with increasing sleep pressure (Dijk et al., 1992) (Jewett and Kronauer, 1999). Although this underscores the importance of targeting both circadian misalignment and homeostatic sleep pressure (Boivin and James, 2002; Horowitz et al., 2001) when designing countermeasures against nighttime attentional impairment, the difference in the efficacy of the two sleep schedules suggest that the direction of circadian realignment and timing of sleep warrant careful consideration. While, the Evening Sleep group performed better overall, on the first night shift they were worse than the Morning Sleep group (Figure 3 and Figure 4) suggesting the need for a different strategy at the transition from day to night shift in that group.
Despite a larger phase shift, the overall nighttime attentional impairment was worse in the Morning Sleep subjects than their Evening Sleep counterparts. One can surmise from the CBTmin results (Figure 2; bottom panel) that the circadian drive for alertness declined during the latter two night shifts in the Morning Sleep group leaving them vulnerable to attentional impairment (Wyatt et al., 1999). This would have been further exacerbated by high homeostatic pressure as they had been awake for at least 12 hours at this point. In contrast, not only was the homeostatic sleep pressure lower in the Evening Sleep subjects, but their night shifts spanned the circadian incline of alertness (their CBTmin occurred at the beginning of these shifts) leaving them less vulnerable to attentional impairment than the Morning Sleep group.
In our study, the partial phase advances proved to be more effective at improving performance than the partial phase delays. However, partial circadian realignment facilitated by phase delays has been shown to result in improved performance as well (Crowley et al., 2003). In a simulated shift work protocol, Crowley et al. (Crowley et al., 2003) showed that subjects who exhibited partial circadian realignment not only performed better than subjects who did not exhibit realignment, but they also improved over the course of successive simulated night shifts. However, since their study did not include baseline measures, it is difficult to compare the efficacy of their countermeasure to that of our Evening Sleep schedule.
Because morning sleep after night work leaves an individual with a disproportionately large duration of wakefulness before work, the accumulated homeostatic sleep pressure before the start of the work shift can be detrimental for maintaining high levels of attention (Horowitz et al., 2003). Sleeping in the evening before a night shift would minimize this problem because it considerably reduces the duration of wakefulness before work, similar to the sleep schedule of a day shift worker. But, attempting sleep in the evening without circadian realignment can be especially challenging since an evening sleep schedule would span the wake maintenance zone, a time when it is most difficult to initiate and maintain sleep (Dijk and Czeisler, 1994). This is perhaps one reason why most night-shift workers have not adopted this practice.
Optimally, circadian realignment for an evening sleep schedule would require an advance in the phase of the circadian system. This is opposite to the practice in most laboratory studies, which are designed to obtain a phase delay (Crowley et al., 2003; Czeisler and Dijk, 1995; Horowitz et al., 2001). There have been two reasons for this. First, a Morning Sleep schedule similar to the one we used in this protocol most closely simulates the typical behavior of a night shift worker in the real world. Second, there is a directional asymmetry, such that phase advances are more difficult to achieve than phase delays. However, as our data indicate with appropriately timed light exposure circadian phase advance can be achieved quite rapidly even with a moderately intense light stimulus, a finding that is consistent with other studies (Martin and Eastman, 1998).
While modest, the phase shifts we achieved were sufficient to ensure that subjects in both sleep groups slept equally well and as well as they did during their baseline sleep episode. Despite this, subjects in the Morning Sleep group performed worse than their Evening Sleep counterparts on the night shifts. We hypothesize that this is because the timing of daytime sleep in the Evening group resulted in reduced homeostatic pressure thereby facilitating their nighttime performance. Our subjects also slept well after the first night shift even though their circadian system was presumably still misaligned at this point. Note that by the end of this shift, subjects had been awake for over 24 hours. This would have left them with an extremely high sleep pressure, which could account for why they slept so well during this daytime sleep episode.
A more detailed analysis of sleep also revealed differences: during their daytime sleep episode, subjects had decreased sleep latency and increased WASO, attributable to an altered phase relationship with respect to the circadian rhythm in sleep propensity (Dijk and Czeisler, 1995). Furthermore, analyses of REM sleep and TST of day sleep 3 revealed differences in the structure and distribution of sleep between the two groups. We conclude that these differences are due to differences in the phase relationship between the scheduled sleep episodes and the strong circadian rhythms in sleep and REM sleep propensities (Czeisler et al., 1980; Dijk and Czeisler, 1995).
While our Evening Sleep schedule was beneficial for nighttime performance, it may not be very appealing to shift workers in the real world because of pressing family and societal obligations (Monk, 2000). Moreover, being the prime leisure time of the day, many shift workers may be reluctant to substitute leisure for sleep (Baker et al., 2004). An alternative approach would be to design sleep schedules that accommodate domestic and societal needs while ensuring efficient nighttime performance e.g., an afternoon sleep that affords some leisure time in the evening. Future directions for research could involve the evaluation of different afternoon and evening sleep schedules as a countermeasure against nighttime attentional impairment.
In conclusion, by scheduling sleep in the evening and advancing the circadian clock, we were able to reap the benefits of reduced homeostatic pressure as well as partial circadian alignment during work. A desirable aspect of our Evening Sleep schedule is that reverting back to a diurnal orientation during off-duty days (Monk, 2000) would only require a small phase delay. A caveat to the proposed countermeasure is that it was not very effective against attentional impairment on the first night shift. This suggests that countermeasures that are currently the standard for night work may not be effective on this shift. It may also not be practical for individuals in the real world to be awake for 26 hours or longer, like our subjects did before starting their first night shift. Future research should focus on examining the efficacy of countermeasures like naps before work and/or wake-promoting therapeutics like caffeine for cognitive impairment on the first night shift, or bright light to suppress acutely the release of the soporific hormone melatonin during night time hours (Campbell and Dawson, 1990; Lewy et al., 1980; Wyatt et al., 2004).
Acknowledgments
The authors wish to thank the research subjects; the Division of Sleep Medicine's subject recruitment, Chronobiology Core and Sleep Core technical staff; Joseph M. Ronda, M.S., and Brian E. Cade for assistance with informatics and data acquisition; Dr. Wei Wang, for assistance with statistical analysis; Dr. Jeanne Duffy for discussions of the data; Sean Penchinar for scoring the sleep records; the Brigham and Women's Hospital (BWH) General Clinical Research Center (GCRC) technical, nursing, and Core Laboratory staff for assistance with the study; This work was funded by a grant from the National Heart Lung and Blood Institute (R01 HL52992) to CAC; NS was supported by the National Heart, Lung and Blood Institute fellowship in the program of training in Sleep, Circadian and Respiratory Neurobiology at the Brigham & Women's Hospital (NHLBI; T32 HL079010); the studies were carried out on the BWH GCRC supported by the General Clinical Research Center Program of the National Center for Research Resources (M01 RR02635). CAC is supported in part by the National Space Biomedical Research Institute through the National Aeronautics and Space Administration (NCC 98-58) and by the Air Force Office of Scientific Research (AFOSR FA9550-06-0080/ O5NL132).
References
- Åkerstedt T, Gillberg M. Subjective and objective sleepiness in the active individual. Int J Neurosci. 1990;52:29–37. doi: 10.3109/00207459008994241. [DOI] [PubMed] [Google Scholar]
- Baker A, Roach G, Ferguson S, Dawson D. Shiftwork experience and the value of time. Ergonomics. 2004;47:307–317. doi: 10.1080/0014013032000157896. [DOI] [PubMed] [Google Scholar]
- Banks S, Dinges DF. Behavioral and physiological consequences of sleep restriction. J Clin Sleep Med. 2007;3:519–528. [PMC free article] [PubMed] [Google Scholar]
- Boivin DB, Duffy JF, Kronauer RE, Czeisler CA. Dose-response relationships for resetting of human circadian clock by light. Nature. 1996;379:540–542. doi: 10.1038/379540a0. [DOI] [PubMed] [Google Scholar]
- Boivin DB, James FO. Circadian adaptation to night-shift work by judicious light and darkness exposure. J Biol Rhythms. 2002;17:556–567. doi: 10.1177/0748730402238238. [DOI] [PubMed] [Google Scholar]
- Brown EN, Choe Y, Luithardt H, Czeisler CA. A statistical model of the human core-temperature circadian rhythm. Am J Physiol Endocrinol Metab. 2000;279:E669–E683. doi: 10.1152/ajpendo.2000.279.3.E669. [DOI] [PubMed] [Google Scholar]
- Campbell SS, Dawson D. Enhancement of nighttime alertness and performance with bright ambient light. Physiol Behav. 1990;48:317–320. doi: 10.1016/0031-9384(90)90320-4. [DOI] [PubMed] [Google Scholar]
- Costa G. The problem: Shiftwork. Chronobiol Int. 1997;14:89–98. doi: 10.3109/07420529709001147. [DOI] [PubMed] [Google Scholar]
- Crowley SJ, Lee C, Tseng CY, Fogg LF, Eastman CI. Combinations of bright light, scheduled dark, sunglasses, and melatonin to facilitate circadian entrainment to night shift work. J Biol Rhythms. 2003;18:513–523. doi: 10.1177/0748730403258422. [DOI] [PubMed] [Google Scholar]
- Czeisler CA, Dijk DJ. Use of bright light to treat maladaption to night shift work and circadian rhythm sleep disorders. J Sleep Res. 1995;4:70–73. doi: 10.1111/j.1365-2869.1995.tb00231.x. [DOI] [PubMed] [Google Scholar]
- Czeisler CA, Johnson MP, Duffy JF, Brown EN, Ronda JM, Kronauer RE. Exposure to bright light and darkness to treat physiologic maladaptation to night work. N Engl J Med. 1990;322:1253–1259. doi: 10.1056/NEJM199005033221801. [DOI] [PubMed] [Google Scholar]
- Czeisler CA, Kronauer RE, Allan JS. Assessment and modification of a subject's endogenous circadian cycle 1992a Nov 17; [Google Scholar]
- Czeisler CA, Kronauer RE, Allan JS. Assessment and modification of endogenous circadian phase and amplitude 1992b Dec 1; [Google Scholar]
- Czeisler CA, Weitzman ED, Moore-Ede MC, Zimmerman JC, Knauer RS. Human sleep: Its duration and organization depend on its circadian phase. Science. 1980;210:1264–1267. doi: 10.1126/science.7434029. [DOI] [PubMed] [Google Scholar]
- Daurat A, Foret J, Touitou Y, Benoit O. Detrimental influence of bright light exposure on alertness, performance, and mood in the early morning. Neurophysiol Clin. 1996;26:8–14. doi: 10.1016/0987-7053(96)81529-2. [DOI] [PubMed] [Google Scholar]
- Dijk DJ, Czeisler CA. Paradoxical timing of the circadian rhythm of sleep propensity serves to consolidate sleep and wakefulness in humans. Neurosci Lett. 1994;166:63–68. doi: 10.1016/0304-3940(94)90841-9. [DOI] [PubMed] [Google Scholar]
- Dijk DJ, Czeisler CA. Contribution of the circadian pacemaker and the sleep homeostat to sleep propensity, sleep structure, electroencephalographic slow waves, and sleep spindle activity in humans. J Neurosci. 1995;15:3526–3538. doi: 10.1523/JNEUROSCI.15-05-03526.1995. [DOI] [PMC free article] [PubMed] [Google Scholar]
- Dijk DJ, Duffy JF, Czeisler CA. Circadian and sleep/wake dependent aspects of subjective alertness and cognitive performance. J Sleep Res. 1992;1:112–117. doi: 10.1111/j.1365-2869.1992.tb00021.x. [DOI] [PubMed] [Google Scholar]
- Dorrian J, Rogers NL, Dinges DF. Psychomotor Vigilance Performance: Neurocognitive Assay Sensitive to Sleep Loss. In: Kushida CA, editor. Sleep Deprivation. Clinical Issues, Pharmacology, and Sleep Loss Effects. Marcel Dekker; New York: pp. 39–70. [Google Scholar]
- Godefroy O, Lhullier-Lamy C, Rousseaux M. SRT lengthening: role of an alertness deficit in frontal damaged patients. Neuropsychologia. 2002;40:2234–2241. doi: 10.1016/s0028-3932(02)00109-4. [DOI] [PubMed] [Google Scholar]
- Graw P, Krauchi K, Knoblauch V, Wirz-Justice A, Cajochen C. Circadian and wake-dependent modulation of fastest and slowest reaction times during the psychomotor vigilance task. Physiol Behav. 2004;80:695–701. doi: 10.1016/j.physbeh.2003.12.004. [DOI] [PubMed] [Google Scholar]
- Horowitz TS, Cade BE, Wolfe JM, Czeisler CA. Efficacy of bright light and sleep/darkness scheduling in alleviating circadian maladaptation to night work. Am J Physiol Endocrinol Metab. 2001;281:E384–E391. doi: 10.1152/ajpendo.2001.281.2.E384. [DOI] [PubMed] [Google Scholar]
- Horowitz TS, Cade BE, Wolfe JM, Czeisler CA. Searching night and day: a dissociation of effects of circadian phase and time awake on visual selective attention and vigilance. Psychol Sci. 2003;14:549–557. doi: 10.1046/j.0956-7976.2003.psci_1464.x. [DOI] [PubMed] [Google Scholar]
- Jewett ME, Dijk DJ, Kronauer RE, Dinges DF. Dose-response relationship between sleep duration and human psychomotor vigilance and subjective alertness. Sleep. 1999;22:171–179. doi: 10.1093/sleep/22.2.171. [DOI] [PubMed] [Google Scholar]
- Jewett ME, Kronauer RE. Interactive mathematical models of subjective alertness and cognitive throughput in humans. J Biol Rhythms. 1999;14:588–597. doi: 10.1177/074873099129000920. [DOI] [PubMed] [Google Scholar]
- Khalsa SBS, Jewett ME, Cajochen C, Czeisler CA. A phase response curve to single bright light pulses in human subjects. J Physiol (Lond) 2003;549:945–952. doi: 10.1113/jphysiol.2003.040477. [DOI] [PMC free article] [PubMed] [Google Scholar]
- Lewy AJ, Wehr TA, Goodwin FK, Newsome DA, Markey SP. Light suppresses melatonin secretion in humans. Science. 1980;210:1267–1269. doi: 10.1126/science.7434030. [DOI] [PubMed] [Google Scholar]
- Luce RD. In: Decomposition into decision and residual latencies. Thomas VS, editor. New York: [Google Scholar]
- Martin SK, Eastman CI. Medium-intensity light produces circadian rhythm adaptation to simulated night-shift work. Sleep. 1998;21:154–165. [PubMed] [Google Scholar]
- McCarthy ME, Waters WF. Decreased attentional responsivity during sleep deprivation: Orienting response latency, amplitude, and habituation. Sleep. 1997;20:115–123. doi: 10.1093/sleep/20.2.115. [DOI] [PubMed] [Google Scholar]
- Miller J, Ulrich R. Simple reaction time and statistical facilitation: a parallel grains model. Cognit Psychol. 2003;46:101–151. doi: 10.1016/s0010-0285(02)00517-0. [DOI] [PubMed] [Google Scholar]
- Monk TH. Mini Review: What can the chronobiologist do to help the shift worker? J Biol Rhythms. 2000;15:86–94. doi: 10.1177/074873040001500202. [DOI] [PubMed] [Google Scholar]
- Motulsky H, Christopoulos A. Fitting models to biological data using linear and nonlinear regression: A practical guide to curve fitting. Oxford University Press; New York: 2003. [Google Scholar]
- Purnell MT, Feyer AM, Herbison GP. The impact of a nap opportunity during the night shift on the performance and alertness of 12-h shift workers. J Sleep Res. 2002;11:219–227. doi: 10.1046/j.1365-2869.2002.00309.x. [DOI] [PubMed] [Google Scholar]
- Ratcliff R. Group reaction time distributions and an analysis of distribution statistics. Psychol Bull. 1979;86:446–461. [PubMed] [Google Scholar]
- Rechtschaffen A, Kales A. A manual of standardized terminology, techniques and scoring system for sleep stages of human Subjects. U.S. Government Printing Office; Washington, D.C.: 1968. [DOI] [PubMed] [Google Scholar]
- Santhi N, Duffy JF, Horowitz TS, Czeisler CA. Scheduling of sleep/darkness affects the circadian phase of night shift workers. Neurosci Lett. 2005;384:316–320. doi: 10.1016/j.neulet.2005.04.094. [DOI] [PubMed] [Google Scholar]
- Santhi N, Horowitz TS, Duffy JF, Czeisler CA. Acute sleep deprivation and circadian misalignment associated with transition onto the first night of work impairs visual selective attention. PLoS ONE. 2007;2:e1233. doi: 10.1371/journal.pone.0001233. [DOI] [PMC free article] [PubMed] [Google Scholar]
- Tukey JW. Exploratory Data Analysis. Addison-Wesley Publishing Company, Inc; 1997. [Google Scholar]
- U.S. Congress and Office of Technology Assessment. Biological rhythms: Implications for the worker. U.S. Government Printing Office; Washington, DC: 1991. [Google Scholar]
- Van Dongen HPA, Maislin G, Dinges DF. Dealing with inter-individual differences in the temporal dynamics of fatigue and performance: importance and techniques. Aviat Space Environ Med. 2004;75:A147–A154. [PubMed] [Google Scholar]
- Wyatt JK, Cajochen C, Ritz-De Cecco A, Czeisler CA, Dijk DJ. Low-dose, repeated caffeine administration for circadian-phase-dependent performance degradation during extended wakefulness. Sleep. 2004;27:374–381. doi: 10.1093/sleep/27.3.374. [DOI] [PubMed] [Google Scholar]
- Wyatt JK, Ritz-De Cecco A, Czeisler CA, Dijk DJ. Circadian temperature and melatonin rhythms, sleep, and neurobehavioral function in humans living on a 20-h day. Am J Physiol Regul Integr Comp Physiol. 1999;277:R1152–R1163. doi: 10.1152/ajpregu.1999.277.4.r1152. [DOI] [PubMed] [Google Scholar]
- Zeitzer JM, Dijk DJ, Kronauer RE, Brown EN, Czeisler CA. Sensitivity of the human circadian pacemaker to nocturnal light: Melatonin phase resetting and suppression. J Physiol (Lond) 2000;526(3):695–702. doi: 10.1111/j.1469-7793.2000.00695.x. [DOI] [PMC free article] [PubMed] [Google Scholar]