Abstract
As part of an ongoing program to study the thermo-mechanical effects associated with cryopreservation via vitrification (vitreous in Latin means glassy), the current study focuses on the development of a new device for mechanical testing of blood vessels at cryogenic temperatures. This device is demonstrated on a bovine carotid artery model, permeated with the cryoprotectant cocktail VS55 and a reference solution of 7.05M DMSO, below glass transition. Results are also presented for crystallized specimens, in the absence of cryoprotectants. Results indicate that the elastic modulus of a specimen with no cryoprotectant, at about −140°C (8.6°C and 15.5°C below the glass transition temperature of 7.05M DMSO and VS55, respectively), is 1038.8 ± 25.2 MPa, which is 8% and 3% higher than that of a vitrified specimen permeated with 7.05M DMSO and VS55, respectively. The elastic modulus of a crystallized material at −50°C is lower by ~20% lower from that at −140°C.
Keywords: Blood Vessels, Vitrification, Cryopreservation, Mechanical Testing, VS55, DMSO
Introduction
Vitrification (vitro in Latin means glass) has been presented as a promising alternative to conventional cryopreservation, whereby ice crystallization—known to be the cornerstone of cryoinjury—is suppressed [1, 2]. Vitrification is achieved by means of rapid cooling of a highly viscous material (i.e., cryoprotectant), when the cooling time scale is much shorter than the typical time scale for crystallization, causing the cryoprotectant molecules to be trapped in an arrested state. Vitrification can be achieved if the cooling rate exceeds a critical rate down to a specific temperature threshold, known as “the glass transition temperature.” The glass transition temperature is cooling-rate dependent, and both are intrinsic properties of cryoprotectant.
The high cooling rate necessary for vitrification in large specimens leads to a significant temperature distribution across the specimen, at a point where the slowest cooling rate and the highest temperature are at its center. Hence, it is the cooling rate at the center of the specimen that must exceed the critical cooling rate in order to ensure the success of cryopreservation. While the critical cooling rate is inversely proportional to the cryoprotectant concentration, cryoprotectants are potentially toxic, and the minimum concentration required to promote vitrification is often applied to a given thermal protocol. Seeking new cryoprotectant cocktails that reduce toxicity effects, while increasing the likelihood of vitrification, represents an active research area in the general field of cryobiology. Another active area of cryobiology research is associated with permeation techniques of the cryoprotectant into the specimen, either by diffusion, perfusion through the vascular system, or a combination of both.
An undesired byproduct of rapid cooling is the development of thermo-mechanical stress, resulting from a non-uniform temperature distribution across the specimen. When it exceeds the strength of the material, thermo-mechanical stress results in structural damage [3] and fracture [4]. For example, immersion of frozen human valves directly into liquid nitrogen, for as little as five minutes, may result in tissue fractures [5]. This problem become known when a hospital-based frozen valve storage system overfilled during an automatic refill cycle. Valves from this accident were discovered to have numerous full thickness fractures in the valve conduit, following normal thawing procedures in the operating room [6]. Adams et al. [5] reproduced this phenomenon experimentally.
The thermal expansion of frozen biological materials—which is the driving mechanism of thermal stress—has been intensively studied in recent years, both in crystallized [7] biomaterials (relevant to classical cryopreservation) and vitrification [8–12]. The current study is aimed at exploring the mechanical response of frozen biomaterial in typical cryopreservation protocols. The cryoprotectants applied in the current study are dimethylsulfoxide (DMSO) and the cocktail VS55, where their specifications are described in the Material and Methods section below, and a review of their development and application for cryopreservation is given in [1]. The current report describes a new device for mechanical testing in typical cryopreservation conditions. Finally, the current report presents typical results for crystallized blood vessel specimens, and vitrified blood vessel specimens below their glass transition temperature, where the response of the material can be characterized as that of a solid over the testing time period.
Experimental Apparatus
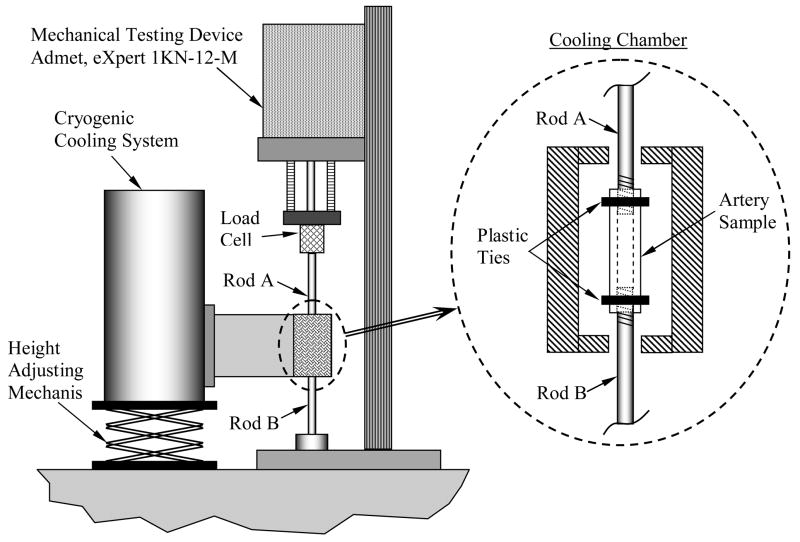
Two objectives have been set forth for the design of the experimental apparatus: (i) to enable replication of a typical cryopreservation protocol on the specimen prior to mechanical testing, while it is attached to the mechanical testing device; and, (ii) to enable holding the specimen at a pre-specified cryogenic temperature for an extended period of time thereafter, over the course of mechanical testing. Those objectives correspond to the two phases of experimentation, respectively: mimicking a cryopreservation protocol while (despite the thermal contraction), the specimen is maintained free of external load (Phase I), and stress-strain measurements at a constant cryogenic temperature (Phase II). With reference to Fig. 1, the experimental apparatus is comprised of two systems: a mechanical testing device, and a cryogenic cooling system, which are sequentially described below.
Figure 1.
Schematic illustration of the experimental apparatus; the cryogenic cooling system is presented in more detail in Figs. 2 and 3.
Cryogenic Cooling System
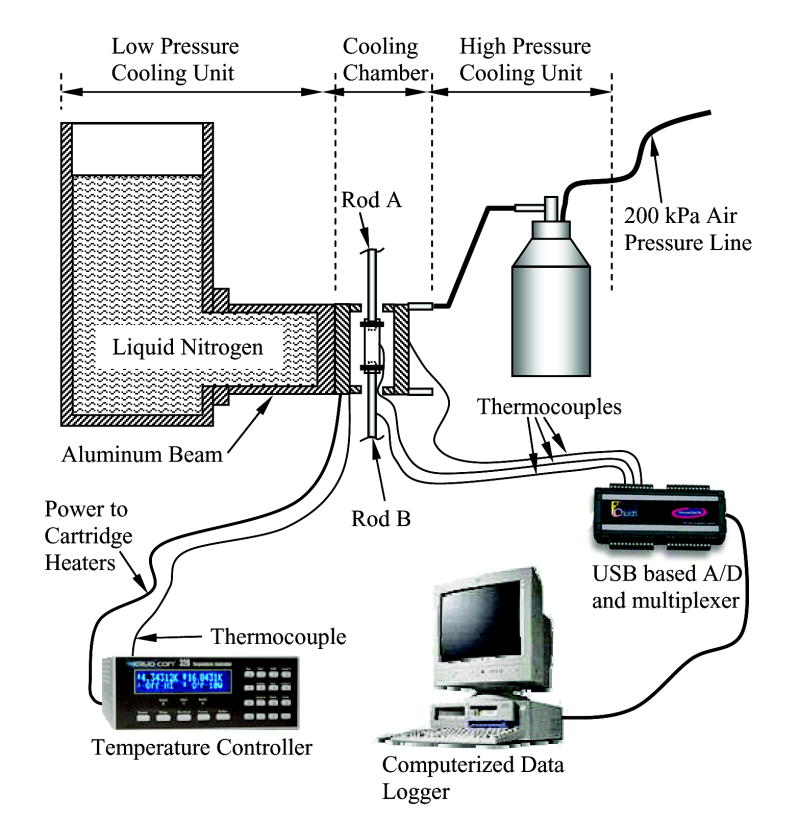
The cryogenic cooling system is a modification of a previous experimental apparatus, designed for thermal expansion measurements [8]; this system has been designed and constructed at the Biothermal Technology Laboratory at Carnegie Mellon University. The cryogenic cooling system consists of five units, as illustrated in Fig. 2: (1) a cooling chamber; (2) a low pressure cooling unit for constant temperature holding and low rate cooling; (3) a high pressure cooling unit for rapid cooling; (4) a close-loop electrical heating unit for thermal control of the cooling chamber; and, (5) a computerized sensory unit to record the thermal history of the specimen and cooling chamber.
Figure 2.
Schematic illustration of the cryogenic cooling system. The computerized data logger also serves as a controller of the mechanical testing device, Fig. 1. The cooling chamber assembly is illustrated in Fig. 3.
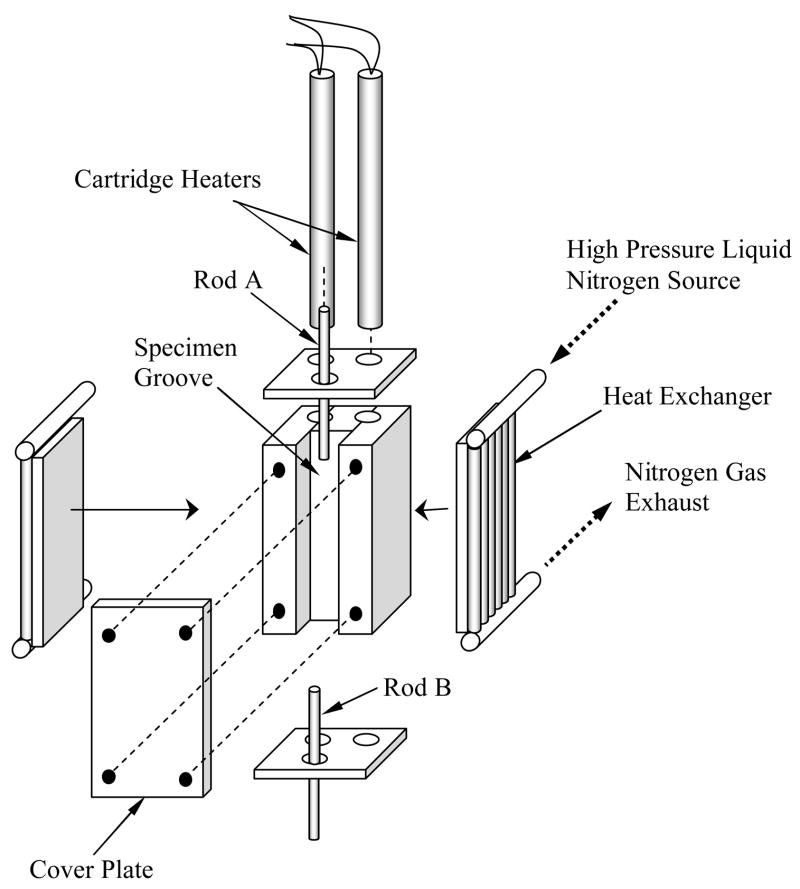
A more detailed schematic illustration of the cooling chamber assembly is presented in Fig. 3. The cooling chamber is constructed of yellow brass block, having overall dimensions of 30 mm × 25 mm × 75 mm. Due to the high thermal conductivity of the brass (k=83 W/m-K), the cooling chamber behaves as a lumped-capacity thermal system. A groove is machined along one side of the brass block to accommodate the blood vessel specimen (groove dimensions are 10 mm × 14 mm × 75 mm). The specimen groove is covered with a 5 mm thick yellow brass plate, and connected with four screws. For constant temperature holding, the cooling chamber is screwed onto an aluminum beam, extending from the low pressure cooling unit, which operates at standard atmospheric pressure. The contact face of the chamber with the aluminum beam is on the face opposite the chamber groove. The volume of the low pressure cooling system is 3 ℓ.
Figure 3.
Schematic illustration of the cooling chamber assembly
The high pressure cooling unit consists of two heat exchangers (Fig. 3), a 1.8 ℓ vacuum insulated liquid nitrogen container, and a portable air pressure container. Each heat exchanger consists of a linear array of 14 copper tubes, 0.9 mm ID and 1.4 mm OD, soldered onto a 3 mm thick copper base. One heat exchanger is connected on each side of the cooling chamber. The heat exchangers are connected in parallel to the high pressure liquid nitrogen container, which is pressurized to 200 kPa (~30 psi) by compressed air. The high pressure cooling unit is operated manually by means of a spring-driven pressure valve, while the low pressure cooling unit is active continually throughout the experiment. The high pressure cooling unit is set to reach a maximum cooling rate of 30°C/min in the chamber. Consistent with cryobiology terminology, the cooling rate for the current discussion is conveniently defined as the average rate of temperature change from 0°C to −100°C (in practice, the instantaneous cooling rate is temperature dependent). The same unit can be set to cooling rates of up to 135°C/min. Cooling rates higher than 30°C/min were deemed unnecessary for the purpose of the current research, where the critical cooling rate for vitrification of VS55 is 2.5°C/min, which is higher than that of DMSO [4,11].
Two cylindrical holes are drilled along the cooling chamber in the region between the groove and the side connected to the low pressure cooling unit, to accommodate a pair of identical cartridge-electrical heaters (Gaumer, model A301–125). Each electrical heater has a diameter of 6.35 mm, a length of 75 mm, and an electrical resistance of 115O. The cartridge heaters are connected in parallel to a temperature controller and power supplier in one unit (Cryo-Con Model 32, with Kp set to 130), which supplies a maximum power of up to 45.5W under the resistance of these parallel heaters. A copper-constantan thermocouple (type T) is connected to the cooling chamber in a drilled hole between the electrical heaters and the groove of the chamber, which closes the feedback loop of the thermal control unit.
The computerized sensory unit is comprised of a regular desktop computer with a universal serial bus (USB) port, a USB-based analog to digital (A/D) converter and multiplexer in one unit (OMEGA, OMB-DAQ 55, 0.015% uncertainty, 22-bit conversion), and an array of T-type thermocouples (±0.8°C uncertainty).
Mechanical Testing System
The mechanical testing device (eXpert 1KN-12-M with and extended load range; Admet, Inc.) has been modified by the manufacturer for the purpose of the current study. The blood vessel specimen grips two stainless steel rods, 3.5 mm in diameter and 180 mm in length. On the gripped portion of each rod (5 mm), 10 circular groves are machined into a depth of 0.15 mm and width of 0.25 mm, to prevent slipping. The specimen is attached to the rod with a plastic tie (see Fig. 1). The upper rod (Rod A) is connected to a load cell (Futek LSB300; 220N), which is connected to the moving head of the testing device. The load cell is located approximately 150 mm above the cooling chamber, which has found to be an adequate distance to ensure that the load cell operates at room temperature. The lower rod (Rod B) is connected to the base of a mechanical testing device. During the experiment, a 12V air fan (not shown on the illustration), harvested from a personal computer, blows air at room temperature on Rod B. This air flow maintains Rod B at steady state temperature (free convection effect would tend to act downwards, leading nitrogen vapors to that rod).
The computerized data logger of the cryogenic cooling system is also used for data logging of the mechanical testing data, and for communication with the controller of the mechanical testing device (via an RS232 port). Typical logged data includes head displacement, load, time, and 10 T-type thermocouples: one on the cooling chamber, three on each rod, and three on the blood vessel specimen.
Materials and Methods
Tissue Model and CPA
The tissue model in the current study is the bovine carotid artery. Tissue specimens were tested in the absence of a cryoprotectant, in the presence of the cryoprotectant cocktail VS55, and in the presence of a reference cryoprotectant solution of 7.05M (DMSO). VS55 is a cocktail of 242.1 g/ℓ DMSO (3.1M), 168.4 g/ℓ propylene glycol (2.2M), 139.6 g/ℓ formamide (3.1M), and 2.4 g/ℓ HEPES in EuroCollins solution. The mass of DMSO present in a 7.05M solution is the same as the total mass from the cryoprotectant ingredients of VS55, and hence it is considered as a reference (for more information about the relationship between VS55 and 7.05M DMSO see [11]). Note that DMSO in much lower concentrations is one of the most common cryoprotectants in conventional cryopreservation. The VS55 used in the current study has been prepared by Cell and Tissue Systems, Inc., Charleston, SC.
Fresh tissue specimens were harvested at a local slaughterhouse. Shortly thereafter, specimens were stored at 4°C in phosphate-NaCl buffer solution (PBS), for up to 24h prior to cryoprotectant permeation. Harvested specimens had typical dimensions of 30 mm in length, 6.5 mm OD, and 1 mm wall thickness. Mimicking a standard permeation protocol [13], the specimen was permeated by two-step immersion in cryoprotectant: in 50% cryoprotectant concentration for one hour (10 ml total cryoprotectant volume), followed by immersion in 100% cryoprotectant concentration for another hour (20 ml total cryoprotectant volume). The two-step protocol of permeation was performed to reduce the osmotic stress on cells. Note that up to six permeation steps may be applied during some cryopreservation procedures [2]. However, the two step permeation protocol was deemed sufficient in the current study for the following reasons: (i) the current study is aimed at mechanical testing of the specimen only, (ii) viability post cryopreservation is outside the scope of the current study, and (iii) the pure cryoprotectant properties are expected to play a key role in mechanical testing, while the dry material of the tissue is expected to only have a secondary effect. While viability testing post cryopreservation is outside of the scope of the current study, it is the subject matter of parallel studies in our ongoing research program [14]. The contribution of mechanical loading to viability as a secondary effect is under investigation.
Testing Procedure
At the end of cryoprotectant permeation, the specimen is placed onto the ends of Rods A and B (Fig. 1), and tightened with plastic cable ties (HellermannTyton, cross section of 2.5 mm wide and 1 mm height). The cable ties are tightened so that one side of each cable is aligned with the tip of the respective rod. Next, the head of the testing device is moved upward, to create a low tension load of about 0.5 N, in order to straighten the specimen; this preloading has no effect on the mechanical testing results. The effective length of the sample is recorded as the distance between the inner sides of the two cable ties (the closest sides to one another). With the specimen in place, the cryogenic cooling system is now positioned so that the cooling chamber properly surrounds the specimen (Fig. 1). The cooling chamber cover plate (Fig. 3) is bolted on. Finally, in order to avoid loading of the specimen as a result of thermal contraction of the specimen and the rods, in phase I of experimentation, the controller of the mechanical testing system is activated in a load-control mode, and the load is set to zero. During phase I, the moving head of the testing device moves only to compensate for thermal contraction of the blood vessel. This contraction is subtracted from the measured length of the specimen, when experimental results are compiled.
Before the beginning of phase I, the low pressure cooling unit is filled with liquid nitrogen, while the temperature controller is activated to keep the cooling chamber at normal room temperature of 22°C. After the cooling system reaches thermal equilibrium—when the tip of the aluminum beam, Fig. 2, reaches the liquid nitrogen temperature of −196°C—phase I begins by triggering the high pressure cooling unit, while the temperature controller is deactivated. During this phase, the mechanical testing temperature is set at the temperature controller panel, and the controller is reactivated. The temperature controller automatically controls the electrical heaters, as the cooling chamber temperature approaches the testing temperature. Once the temperature controller turns on the heaters for the first time, the high pressure cooling system in shut down.
It is noted that the cooling chamber temperature is the control variable, and not the specimen temperature. Therefore, the controller set-point may require manual adjustment to achieve the precise testing temperature. It is further noted that due to the significant time lag between the cooling chamber temperature and the specimen temperature, using the latter as the control variable is impractical, resulting in severe temperature overshooting and control instability.
Mechanical testing (Phase II) begins after the system reaches thermal equilibrium at the testing temperature. Mechanical testing in the current study is performed at a constant displacement rate of 0.01 mm/sec, yielding a strain rate of 5.31×10⁻⁴ ± 4.22×10⁻⁵ sec−1 (the precise strain rate depends on the actual specimen length). Once the specimen fails, the controller of the cryogenic cooling system brings the cooling chamber back to its initial room temperature, and the specimen is removed for cross sectional area measurement.
Cross-Sectional Area Measurement
While the elongation and load on the specimen can be measured to a relatively high degree of certainty, measuring the cross-sectional area and the length of the specimen introduces a significant degree of uncertainty (the active length is defined above). In particular, the cross-section of a specific artery may vary axially, (it is known to vary between animals of the same species, and even between arteries from both sides of the same animal). Furthermore, measuring the dimensions of an artery requires dissection of the specimen and, therefore, can only be performed after the mechanical testing procedure has been completed.
At the end of the mechanical testing procedure, and after the specimen temperature reaches room temperature again, four rings of about 1 mm in width are cut from the specimen. All the rings are placed on their side, on a small dish with a black background, together with a measuring rod (Fig. 4); two digital photos are taken. Next, the area of each ring is calculated as follows: Using vector graphics, two ellipses are manually drawn and manually adjusted to match the external and internal contours of the ring. The area of each ring is determined as the difference between the areas of the two ellipses. By comparing the size of the ellipses with the imaged measuring rod, the actual cross-sectional area is computed. The average cross-sectional area from all the four rings in the two photos is used as the representative cross-sectional area of the specimen for data analysis. The repeated calculation of area on the second photograph is performed in order to reduce possible uncertainty associated with digital imaging analysis. The uncertainty in area calculation of one ring is estimated as 0.4 mm2. The variation in the cross-sectional area from different rings of the same specimen is typically in the range of 9.0%. The variation in the average cross-sectional area between the first and the second photo is typically in the range of 5.4%.
Figure 4.
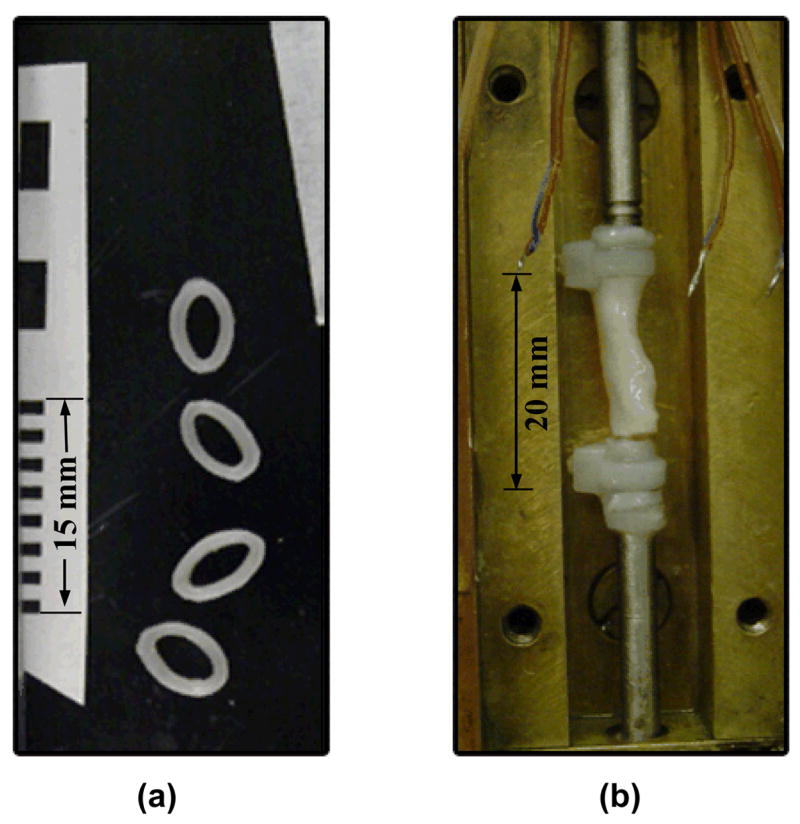
Blood vessel specimen: a) rings with a measuring scale, used to calculate the cross-sectional area of the specimen, and b) fractured specimen at the end of testing (the cover plate of the cooling chamber is removed).
Results and Discussion
For purposes of demonstrating the new device, the current study focuses on stress-strain measurements on specimens loaded with CPA below the glass transition temperature, where the vitrified material behaves like a solid material over any practical time scale. The glass transition temperature of 7.05M DMSO and VS55 is −132.3°C and −119.8°C [11], respectively. For comparison purposes, mechanical testing on specimens in the absence of CPA was also conducted, at the lower and upper part of the cryogenic temperature range relevant to cryopreservation, around −140°C and −50°C, respectively. In particular, the analysis in the current study focuses on measuring the elasticity modulus of the material and its stress to failure, as listed in Table 1, and discussed below.
Table 1.
Summary of experimental results, where L is the specimen length, Do is the average diameter, A is the cross-sectional area, T is the average temperature of the specimen, έ is the strain rate, Δε is the strain range in which the elastically modulus is calculated, E is the modulus of elasticity, R2 is the coefficient of determination for the estimation of E, and σF is the stress to failure.
| No. | L, mm | Do, mm | A, mm2 | T, °C | έ ×104, sec−1 | Δε ×103 | E, MPa | R2 | σF, MPa | |
|---|---|---|---|---|---|---|---|---|---|---|
| 7.05M DMSO (Tg = −132.3ºC) | 1 | 20.38 | 5.3 | 12.91 | −140.8 | 4.91 | 0.06 … 8.09 | 1039.2 | 1 | 14.97 |
| 2 | 17.27 | 5.4 | 14.07 | −142.2 | 5.79 | 1.34 … 11.29 | 946.3 | 1 | 11.61 | |
| 3 | 23.03 | 6.3 | 16.63 | −142.2 | 5.21 | 0.09 … 7.70 | 876.3 | 0.9998 | 13.41 | |
| 4 | 16.58 | 5.6 | 11.93 | −138.5 | 6.03 | 5.03 …. 18.09 | 822.8 | 0.9999 | 15.74 | |
|
| ||||||||||
| VS55 (Tg = −119.8ºC) | 5 | 21.37 | 6.6 | 17.21 | −129.4 | 4.68 | 0 … 9.82 | 794.9 | 0.9996 | 11.66 |
| 6 | 17.24 | 6.1 | 13.86 | −130.9 | 5.23 | 3.53 … 15.37 | 901.2 | 0.9997 | 14.79 | |
| 7 | 27.02 | 5.8 | 14.69 | −136.9 | 5.80 | 0.31 … 9.82 | 1151.6 | 1 | 11.01 | |
| 8 | 30.70 | 6.3 | 16.86 | −143.9 | 4.89 | 0.16 … 3.74 | 1044.8 | 0.9999 | 10.46 | |
|
| ||||||||||
| No CPA at high temperatures | 9 | 28.63 | 6.4 | 19.25 | −52.5 | 5.06 | 0.17 … 5.30 | 854.4 | 0.9999 | 4.04 |
| 10 | 25.71 | 6.7 | 21.42 | −50.7 | 5.45 | 0.35 … 5.98 | 788.6 | 1 | 8.69 | |
| 11 | 24.63 | 5.8 | 15.98 | −52.9 | 5.28 | 0.11 … 4.85 | 824.7 | 0.9998 | 4.57 | |
| 12 | 24.38 | 6.3 | 19.15 | −50.0 | 5.02 | 0.01 … 7.63 | 754.4 | 1 | 8.13 | |
|
| ||||||||||
| No CPA at low temperatures | 13 | 31.87 | 7.0 | 21.84 | −143.0 | 5.02 | 0.76 … 6.76 | 1036.2 | 0.9997 | 7.90 |
| 14 | 21.85 | 6.5 | 18.69 | −146.7 | 4.96 | 1.90 … 6.47 | 1004.2 | 0.9989 | 6.29 | |
| 15 | 29.50 | 6.6 | 19.61 | −140.1 | 5.08 | 0.60 … 7.87 | 1059.7 | 0.9998 | 9.23 | |
| 16 | 27.31 | 7.1 | 20.83 | −143.1 | 5.14 | 1.69 … 8.94 | 1055.1 | 1 | 10.88 | |
Figure 5 displays a typical thermal history of a specimen permeated with 7.05M DMSO, of the cooling chamber, and of the specimen-holding rods, approximately 20 mm from the cable ties. The high pressure cooling unit is turned on at point A on Fig. 5, and turned off at point B, after which the operator manually adjusts the set-point on the thermal controller. A satisfactory experimental testing temperature is reached at point C (cooling chamber temperature of −158°C and specimen temperature around −140°C), and an additional time period is allotted for the system to reach thermal equilibrium at point D. The weighted-average specimen temperature at point D is −138.5°C, where weighting factors of 1 and 2 are assigned to the end and center thermocouples, respectively. The heat gain through the rods causes the ends of the artery to be slightly warmer than its center. The maximum temperature variation along the specimen is 1.5°C in Fig. 5. Mechanical testing starts at point D and lasts 35 sec, until specimen failure is observed at point E. Based on all experimental results reported here, a maximum variation in specimen-average temperature of 1.4°C was observed during mechanical testing, section D-E. Analysis of all the experiments reported in Table 1 indicate that the maximum temperature variation along the specimen is typically 12°C and 3.5°C for experimental at temperatures around −140°C and −50°C, respectively.
Figure 5.
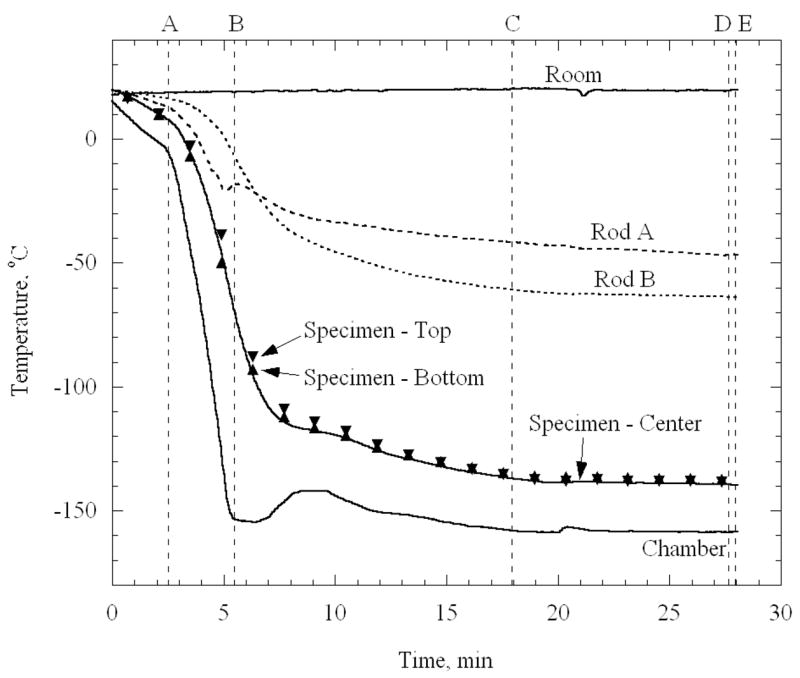
Thermal history of the cooling chamber, a specimen loaded with 7.05M DMSO, and of the end of the rods holding the specimen; the high pressure cooling units is active in section A–B. The operator adjusts the controller set-temperature in section B–C; the system approaches thermal equilibrium in section C–D; mechanical testing is conducted in section D–E.
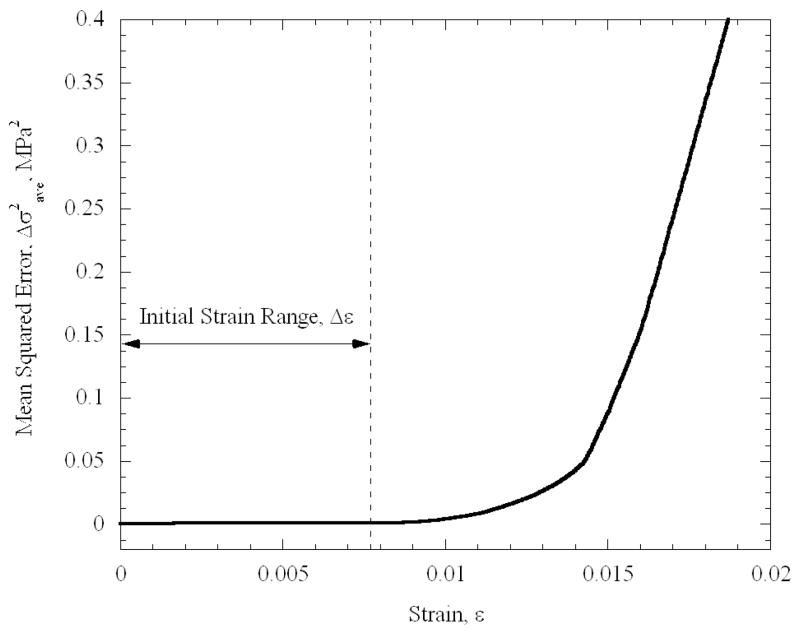
Figure 6 displays typical mechanical testing results for a specimen permeated in 7.05M DMSO. It can be seen that the specimen behaves as a linear-elastic material in the initial strain range of 9×10⁻⁵ to 7.7×10⁻³. In order to identify the range in which the material behaves linear elastically, the following procedure has been performed. Starting with the maximum strain range available from experimental data, an initial estimate for the strain-stress slope (i.e., the elastic modulus, E) was obtained, using a first-order polynomial approximation. Based on that slope, the mean square error, Δσ2ave, was calculated between the predicted value, based on the best-fit approximation, and the actual value, calculated explicitly from experimental data. Next, the strain range under consideration was decreased, a new value for E is estimated, and a new value of Δσ2ave was calculated. Figure 7 displays the evolution of Δσ2ave in this process, for the same experiment displayed in Fig. 6. The boundaries of the linear elastic behavior are defined in the current study as the point at which Δσ2ave deviates by more than 0.1% from its minimum value. While the deviation from linear behavior at high strains is attributed to the mechanical response of the specimen, this deviation at the initiation of the process is attributed to instrumentation. It is reminded that, due to the cryogenic temperature of operation, the elongation of the specimen is not measured directly. Instead, the displacement of the head of the mechanical testing device is measured. Depending on the initial state of the loading mechanism at the end of Phase I of cooling—when the device is operated at a load-control mode—an initial apparent strain may be recorded, which may not necessarily be a true translation of the response of the material. Once that lower boundary of strain is exceeded, the material displays a linear elastic behavior along a significant range.
Figure 6.
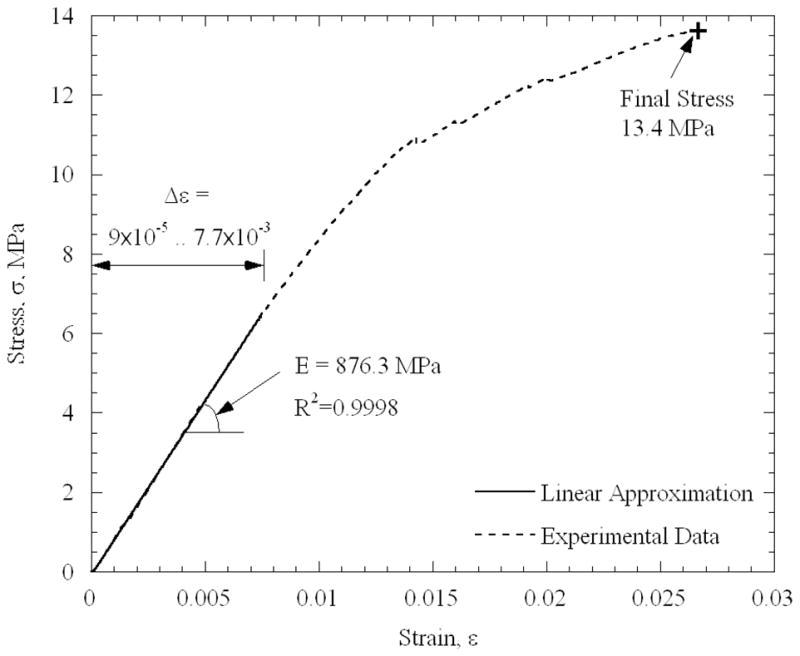
Stress-strain results from a blood vessel specimen loaded with 7.05M DMSO. The average testing temperature is −142.2°C, with temperature non-uniformity of 11°C along the specimen.
Figure 7.
The average square difference between the predicted stress, based on a best-fit polynomial approximation for the elastic modulus, and the measured stress as a function of the strain range.
While the blood vessel is often modeled as a hyper-elastic material at room temperature [15] (due to the high deformation it can sustain prior to failure), the blood vessel exhibits a completely different behavior at cryogenic temperatures. It can be seen from Table 1 that the linear-elastic behavior was found at relatively low strains of less than 2%, and that the strain to failure did not exceed 3% (Fig. 6), which supports the use of the engineering stress model in the current study. The observations that the material fails at a rather modest strain, and that the stress-to-fracture is orders of magnitude higher than that of a fresh tissue at room temperature (but is comparable to that of pure water ice [15,16]), signifies the effects of cryogenic temperatures on mechanical modeling. Therefore, it may be assumed that the extracellular matrix plays only a minor role in the mechanical response at the solid, or solid-like, state. These observations carry further implications regarding the relationship between the mechanical stress and its effect on viability. While the load is mostly carried by the extracellular matrix in a fresh tissue at room temperature (which does not exceed one third of the specimen volume, and which can sustain high deformations), it is the frozen solution that bears the load all across the specimen in the cryopreserved specimen.
Due to stress concentration at the grips, the determination of strength to fracture is obtained with an unknown degree of certainty. The final stress values listed in Table 1 refer to the cross-sectional area of the blood vessels with no loading (or after unloading, as described above). An ongoing research effort by the current research group focuses on the non-linear range beyond the initial strain range, and on viscous-elastic effects of the blood vessel well above glass transition.
Analysis of the data listed in Table 1 indicates that the elastic moduli of specimens loaded with 7.05M DMSO (average temperature of −140.9°C, Tg = −132.3°C) and VS55 (average temperature of −135.3°C, Tg = −119.8) are 921.1 ± 93.5 MPa and 973.1 ± 157 MPa, respectively. These values were obtained at average temperatures of 8.6°C and 15.5°C below the glass transition temperature of 7.05M DMSO and VS55, respectively. Theoretical analysis has suggested that the linear-elastic behavior will be exhibited up to a few degrees Centigrade above glass transition [4]. The elastic modulus of a specimen with no cryoprotectant (crystallized material) at the same temperature is found to be 1038.8 ± 25.2 MPa. Not surprisingly, experimental results on a crystallized material display higher repeatability. Nevertheless, the average elastic modulus of crystallized material is only 8% and 3% higher than that of the vitrified 7.05M DMSO and VS55, respectively. In comparison, the elastic modulus of sea ice is found to be in the range of 3 GPa to 100 GPa [16], and in the range of 2.8 GPa and 17.5 GPa for single ice crystals of pure water [17].
The elastic modulus of a crystallized material at −50°C is 805.5 ± 43.4 MPa, which is about 20% lower than that of the same material at −140°C. The temperature of −50°C is well below the homogeneous nucleation point of pure water (−39.2°C), which suggests that complete crystallization has been achieved for those specimens. This variation of the elastic modulus with temperature will have an implication in further theoretical studies of partial vitrification [18].
It can be seen from Table 1 that the stress-to-fracture is found to be in the range of 4 MPa to 10.9 MPa for crystallized material, having a significant range. It can further be seen that the stress-to-fracture increases somewhat with the decreasing temperature. There is significant variable in the tensile failure strength of brittle materials that are homogeneous – usually flaws which are statistical in their distribution dictate the precise strength. The inhomogeneity may further increase the variability in failure strength of blood vessel specimens. Finally, the technique of attaching the blood vessel to the testing rods may create stress concentration (see right photo of Fig. 4). By comparison, for sea ice at a few degrees below freezing, fracture stress in the range of 7.9 MPa and 22.2 MPa has been suggested in [17], and in the range of 3 MPa and 13 MPa in [19].
Summary and Conclusions
A device has been designed and constructed to measure the mechanical properties of cryopreserved tissues in tension at low temperatures. Such properties are necessary in the study of solid mechanic effects associated with cryopreservation of blood vessels via vitrification. To mimic a cryopreservation protocol prior to mechanical testing, the new device brings the specimen to the desired temperature through any specified cooling history. While the device can be used in a wide range of cryogenic temperatures, it is demonstrated in the current study on vitrified specimens only below the glass transition temperature, where the cryopreserved material can be considered solid over the time scale of testing. The tissue model tested in the current study is the bovine carotid artery, permeated with either 7.05M DMSO or VS55. For comparison purposes, the mechanical response of crystallized blood vessel specimens, in the absence of cryoprotectants, is also presented. Ongoing research efforts are now focused on visco-elastic effects above glass transition, and will be reported in the near future.
Results of the current study indicate that the elastic modulus of a specimen with no cryoprotectant (crystallized material) at about −140°C is 1038.8 ± 25.2 MPa. The elastic modulus of a crystallized material at −50°C is about 20% lower than that of the same material at −140°C. At −140°C, which is below the glass transition temperature of the studied cryoprotectants, the elastic modulus of the crystallized specimen is 8% and 3% higher than that of a vitrified specimen permeated with 7.05M DMSO and VS55, respectively.
The stress-to-fracture is found in the range of 4 MPa to 10.9 MPa for crystallized material, with a tendency to increase with decreasing temperature. This range is not unusual for tensile failure strength of brittle materials that are homogeneous. The inhomogeneity in the blood vessel may further increase the variability in failure strength. The stress-to-fracture of the crystallized blood vessels is found to be within the wide range of observed fracture stresses of sea ice and pure water single crystals.
Acknowledgments
This study has been supported in part by National Institute of Health (NIH), grant number R01HL069944-01A1, 02, 03, 04. The authors wish to thank Prof. Paul Steif of the Department of Mechanical Engineering, Carnegie Mellon University, for insightful comments about solid mechanics and fracture formation. The authors wish to thank Dr. Michael J. Taylor, Cell and Tissue Systems, Inc., Charleston, SC, for discussions about the permeation of cryoprotectants in tissue. The authors thank Mr. Jim Dillinger, Mr. John Fulmer, and Mr. Edward Wojciechowski, of the Machine Shop, Department of Mechanical Engineering, Carnegie Mellon University, Pittsburgh, PA, for assistance and advice in constructing the experimental device.
Appendix A: Uncertainty Analysis
The elastic modulus is given by:
| (A.1) |
where σ is the stress, ε is the strain, F is the load, L is the elongation, Lo is the effective length, and A is the cross-sectional area. Following a standard engineering analysis of uncertainty [20], the uncertainty in estimation of the modulus of elasticity can be calculated as:
| (A.2) |
where δL, δLo, δA, and δF are the estimated uncertainties in measurement of the displacement, effective length, cross-sectional area, and load, respectively; the typical corresponding values are: 1.3×10⁻² mm (corresponding to the average elongation of the stainless steel rods under the load present during an experiment), 1 mm, 1.15 mm2 (9 %), and 0.15 N, respectively. From Eq. (A.2), the uncertainty in elasticity modulus calculation is estimated as 97 MPa, which is of the same order of magnitude as the standard deviation in experimental data. This agreement indicates that the uncertainty in the experimental apparatus and method of operation is adequate for the study of mechanical response in frozen blood vessels.
The uncertainty in temperature measurement is generated by A/D conversion (22 bits at 0.333Hz) in the data acquisition module, cold-junction compensation, and quality of the thermocouple material. The overall uncertainty in temperature measurement is estimated as ±0.8ºC. This value, however, is negligible when compared with the temperature distribution along a single specimen.
References
- 1.Taylor MJ, Song YC, Brockbank KGM. Vitrification in tissue preservation: New developments. In: Fuller BJ, Lane N, Benson EE, editors. Life in the Frozen State. CRC Press; New York: 2004. pp. 603–641. [Google Scholar]
- 2.Song YC, Khirabadi BS, Lightfoot FG, Brockbank KGM, Taylor MJ. Vitreous cryopreservation maintains the function of vascular grafts. Nature Biotechnology. 2000;18:296–299. doi: 10.1038/73737. [DOI] [PubMed] [Google Scholar]
- 3.Rabin Y, Steif PS. Thermal stresses in a freezing sphere and its application to cryobiology. ASME Journal of Applied Mechanics. 1998;65(2):328–333. [Google Scholar]
- 4.Rabin Y, Steif PS, Hess KC, Jimenez J, Palastro M. Fracture formation in vitrified thin films of cryoprotectants. Cryobiology. 2006;53:75–95. doi: 10.1016/j.cryobiol.2006.03.013. [DOI] [PMC free article] [PubMed] [Google Scholar]
- 5.Adam MJ, Hu F, Lange P, Wolfinbarger L. The effect of liquid nitrogen submersion on cryopreserved human heart valves. Cryobiology. 1990;27:605–614. doi: 10.1016/s0011-2240(05)80028-8. [DOI] [PubMed] [Google Scholar]
- 6.Wolfinbarger L, Jr, Adam M, Lange P, HU JF. Microfractures in cryopreserved heart valves: valve submersion in liquid nitrogen revisited. Applications of Cryogenic Technology. 1991;10:227–233. [Google Scholar]
- 7.Rabin Y, Taylor MJ, Wolmark N. Thermal Expansion Measurements of Frozen Biological Tissues at Cryogenic Temperatures. J Biomechanical Engineering. 1998;120:259–266. doi: 10.1115/1.2798310. [DOI] [PubMed] [Google Scholar]
- 8.Jimenez J, Rabin Y. Thermal expansion of blood vessels in low cryogenic temperatures, Part I: A new experimental device. Cryobiology. 2006;52(2):269–283. doi: 10.1016/j.cryobiol.2005.12.005. [DOI] [PMC free article] [PubMed] [Google Scholar]
- 9.Jimenez J, Rabin Y. Thermal expansion of blood vessels in cryogenic temperatures, Part II: Vitrification with VS55, DP6, and 7.05M DMSO. Cryobiology. 2006;52(2):284–294. doi: 10.1016/j.cryobiol.2005.12.006. [DOI] [PMC free article] [PubMed] [Google Scholar]
- 10.Rabin Y, Bell E. Thermal expansion measurements of cryoprotective agents. Part II: measurements of DP6 and VS55, and comparison with DMSO. Cryobiology. 2003;46(3):264–270. doi: 10.1016/s0011-2240(03)00041-5. [DOI] [PubMed] [Google Scholar]
- 11.Plitz J, Rabin Y, Walsh JR. The effect of thermal expansion of Ingredients on the Cocktails VS55 and DP6. Cell Preservation Technologies. 2004;2(3):215–226. [Google Scholar]
- 12.Rabin Y, Plitz J. Thermal expansion of blood vessels and muscle specimens permeated with DMSO, DP6, and VS55 at cryogenic temperatures. Ann Biomed Eng. 2005;33(9):1213–1228. doi: 10.1007/s10439-005-5364-0. [DOI] [PubMed] [Google Scholar]
- 13.Song YC, Pegg DE, Hunt CJ. Cryopreservation of the common carotid artery of the rabbit: Optimization of dimethyl sulfoxide concentration and cooling rate. Cryobiology. 1995;32:405–421. doi: 10.1006/cryo.1995.1040. [DOI] [PubMed] [Google Scholar]
- 14.Baicu S, Taylor MJ, Chen Z, Rabin Y. Vitrification of carotid artery segments: an integrated study of thermophysical events and functional recovery toward scale-up for clinical applications. Cell Preservation Technology. 2004;4(4):236–244. doi: 10.1089/cpt.2006.9994. [DOI] [PMC free article] [PubMed] [Google Scholar]
- 15.Taber LA. Nonlinear Theory of Elasticity Applications in Biomechanics. 1st edition. World Scientific Publishing Co. Pte. Ltd.; 2004. [Google Scholar]
- 16.Weeks W, Assur A. The Mechanical Properties of Sea Ice. Cold Regions Research & Engineering Laboratory, U.S. Army; Hanover, NH: 1967. [Google Scholar]
- 17.Dantl G. Elastic moduli of ice. In: Riehl N, Bullemer B, Engelhardt H, editors. Physics of Ice. Plenum; New York: 1969. pp. 223–230. [Google Scholar]
- 18.Steif PS, Palastro MC, Rabin Y. Analysis of the effect of partial vitrification on stress development in cryopreserved blood vessels. Medical Engineering & Physics. 2006;29(6):661–670. doi: 10.1016/j.medengphy.2006.07.010. [DOI] [PMC free article] [PubMed] [Google Scholar]
- 19.Brown RL. An evaluation of the rheological properties of columnar ridge sea ice. In: Murthy TKS, Connor JJ, Brebbia CA, editors. Ice Technology; Proceedings, 1st International Conference; Cambridge, MA, Springer-Verlag, Berlin. 1986. [Google Scholar]
- 20.Holman JP. Experimental Methods for Engineers. 7th edition. McGraw-Hill; 2001. [Google Scholar]


