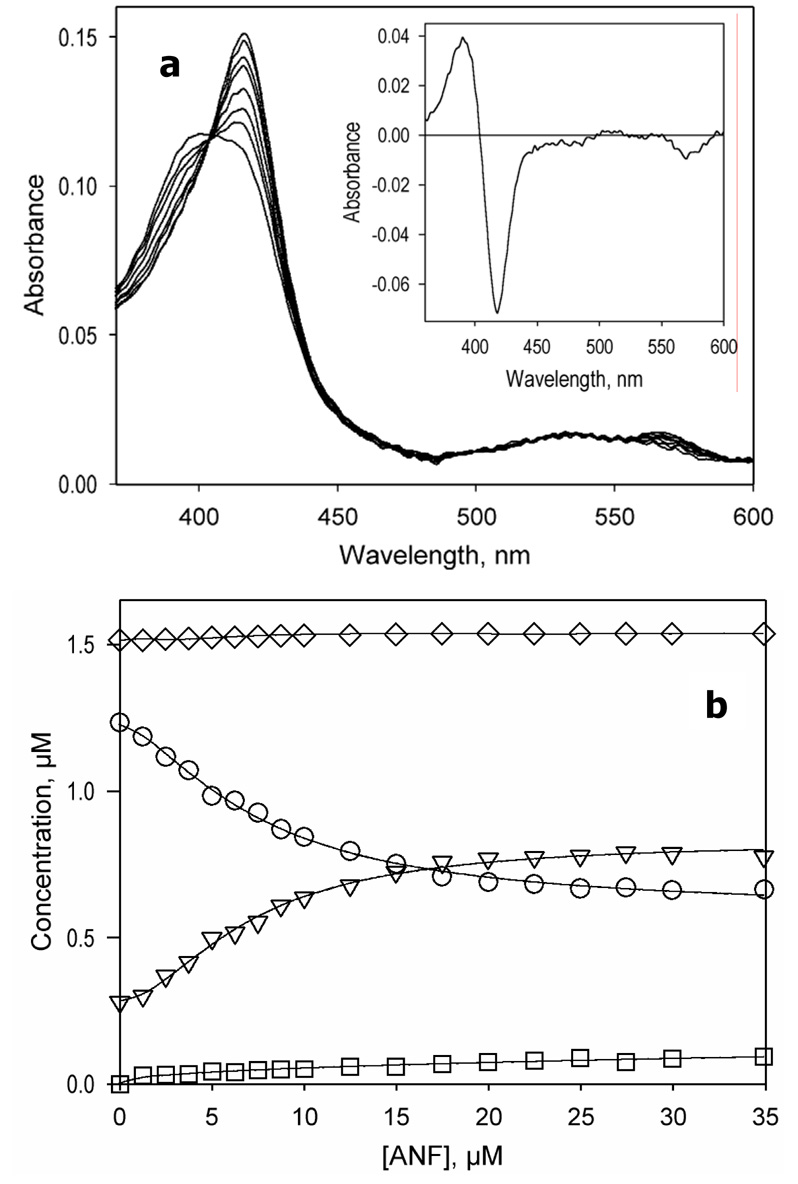
Figure 2.
ANF-induced changes in the absorbance spectra of CYP3A4. (a) A series of absorbance spectra of 1.5 µM enzyme recorded at 0, 1.2, 2.5, 3.7, 6.2, 8.7, 12, and 30 µM ANF. The inset shows the spectrum of the first principal component. (b) ANF-induced changes in the concentration of the high-spin (triangles), low-spin (circles), P420 (squares), and total enzyme (diamonds). Experimental conditions: 100 mM Hepes buffer, pH 7.4, 1 mM DTT, 0.2 mM EDTA, 25 °C.

