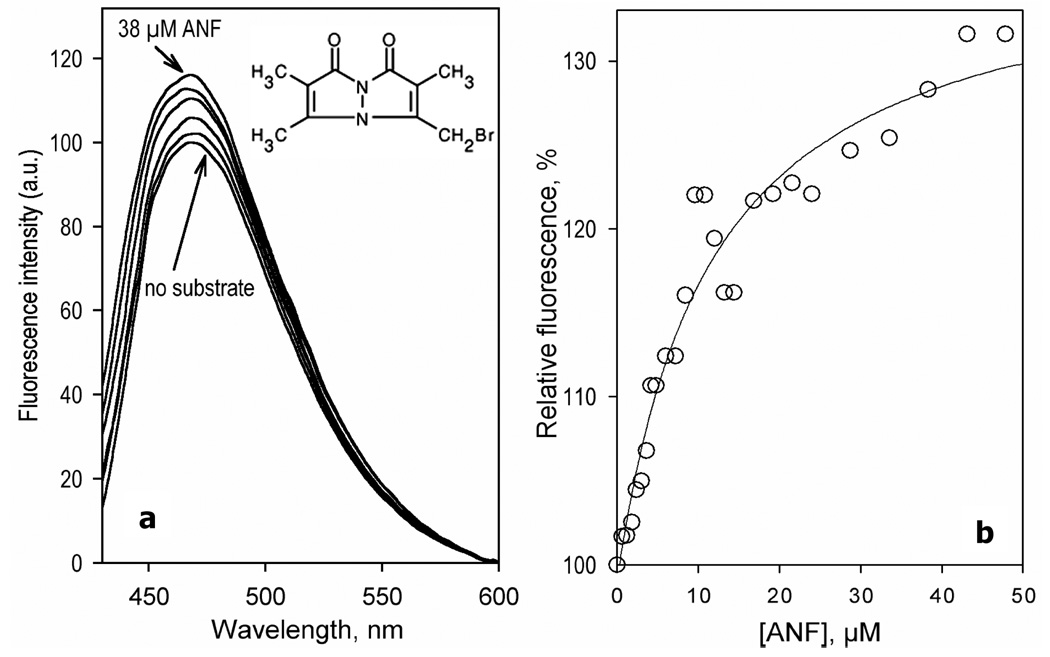
Figure 6.
Interaction of CYP3A4(C58,C64)-mBBr with ANF monitored by the changes in the fluorescence of the probe. (a) A series of emission spectra of 1.5 µM enzyme recorded at 0, 2.4, 6, 12, 24, and 38 µM of ANF. (b) Relative fluorescence intensity versus substrate concentration. The lines show the fitting of the data sets to the Michaelis-Menten equation with KM = 12 µM. Experimental conditions as indicated in Figure 3.

