

Abstract
Seven experiments explore the role of bottlenecks in selective attention and access to visual short-term memory in the failure of observers to identify clearly visible changes in otherwise stable visual displays. Experiment One shows that observers fail to register a color change in an object even if they are cued to the location of the object by a transient at that location as the change is occurring. Experiment Two shows the same for orientation change. In Experiments Three and Four, attention is directed to specific objects prior to making changes in those objects. Observers have only a very limited memory for the status of recently attended items. Experiment Five reveals that observers have no ability to detect changes that happen after attention has been directed to an object and before attention returns to that object. In Experiment Six, attention is cued at rates that more closely resemble natural rates and Experiment Seven uses natural images. Memory capacity remains very small (<4 items).
If you ask typical observers, outside of a vision research laboratory, what they are seeing right now, they will probably tell you that they are seeing a large number of objects placed in a spatially continuous scene. If you ask them if they are seeing all of that at the same time, they will look at you quizzically but they will agree that all of the objects seem to be visually present in the present instant of time. It hardly seems like much of a question. However, if you ask atypical observers, those who have been studying the question over the past 20 years or so, the answers may be quite different. A range of phenomena suggest that human observers are unable to perform tasks that would seem to be quite trivial if we could see what was in front of our eyes in the uncomplicated manner suggested by naïve introspection.
Change blindness is one of the most striking of these phenomena. In a typical change blindness paradigm, the observer is told to monitor an image for a change. As long as transients are masked and as long as the observer is not attending to the object that is changing, observers will be very poor at detecting quite substantial changes. These can range from changes to significant objects in natural scenes to changes in “basic features” like color (Phillips, 1974; Rensink, O'Regan, & Clark, 1997; Simons, 2000; Simons & Levin, 1997).
Similar failures to report what is in front of the eyes occur when observers are attending to one aspect of a display and subsequently queried about another. Thus, Mack and Rock (1998) found that observers who were answering a question about a pair of lines would fail to report salient stimuli presented at fixation (“inattentional blindness”). Simons and his colleagues (following on Neisser & Becklen, 1975) have shown that observers who were monitoring one set of actors would fail to notice other actors (e.g. a woman in a gorilla suit) as they entered and left a scene (Simons & Chabris, 1999).
Some have argued that these results demonstrate that we only “see” the current object of attention and that the rest of the apparent perceptual world is a “grand illusion” (Noë, Pessoa, & Thompson, 2000). An alternative approach to effects like change blindness and inattentional blindness has been to argue that these are not blindness – failures of vision, but amnesias – failures of memory. Of necessity, experimenters need to ask about the change, the colored spot, or the gorilla after it is gone. Perhaps observers simply forget what they do not attend (“inattentional amnesia” - Wolfe, 1999) or, in the case of change blindness, perhaps the second, changed image wipes out the memory for the first image. Apparent support for this view can be gleaned from “repeated search” experiments in which observers search hundreds of times through an unchanging visual display. On each trial, the object of search changes but the scene would remain constant. In numerous versions of this task, observers show little or no change in search efficiency with repetition (Wolfe, Klempen, & Dahlen, 2000; Wolfe, Oliva, Butcher, & Arsenio, 2002). It is as if each search begins de novo with no benefit for having performed the same search over the same stimuli many times.
In spite of our close connections to the author of the inattentional amnesia hypothesis, it must be admitted that it does not really work as a complete account for the range of phenomena. First, there are problems from within the change blindness literature. For example, it is possible to show good memory for the previous state of a scene if the question is asked correctly. Even if an observer did not notice the disappearance of an object like a basketball, that observer might be able to report the original color of the ball (Simons, Chabris, Schnur, & Levin, 2002). Perhaps more importantly, it is clear that observers have excellent memories for some material even after very limited exposure. Picture recognition studies have shown that brief exposures are all that is needed to produce good recognition memory for hundreds, even thousands of pictures (Potter & Levy, 1969; Shepard, 1967; Standing, 1973). More recently, Hollingworth and Henderson have developed a task that can be considered to be a hybrid of picture recognition memory and change blindness paradigms (Henderson & Hollingworth, 2003; Hollingworth & Henderson, 2002, 2004). Observers view a computer-generated scene filled with objects. As they saccade from item to item, an item can be changed. When asked later (including much later after several scenes have been viewed), observers are good at determining if a previously fixated (and, presumably attended) item has been changed or not. Hollingworth and Henderson conclude that, far from being a grand illusion, there is a “rich scene representation” that is “retained across saccades and stored in visual memory” (Henderson & Hollingworth, 2003).
In some ways, this is an odd debate. We have long known that the proximal stimulus on the retina is not the distal stimulus in the world and we have known that our perception is nothing like a direct experience of the proximal stimulus on the retina. What we experience must be some creation of our visual system. The fact that a change in the distal stimulus does not necessarily produce the experience of change in our representation of the world is not, in itself, surprising. The surprise lies in the nature of the changes that we miss or fail to identify.
In this paper, we argue that the changes we fail to notice or fail to identify and our surprise at these errors arise because visual awareness is the product of two pathways from visual input to visual experience. One pathway - call it the “selective” pathway – is responsible for object recognition and other operations that are limited to one item or to a small group of items at any one time (e.g. Is the red region to the left or right of the green? Logan, 1995). The other pathway – call it the “non-selective pathway” – supports visual experience throughout the visual field but is capable of only a limited analysis of the input. For instance, the existence of objects may be noted in this pathway, but not their identity. This two pathway conception has some similarities to Ron Rensink’s “triadic architecture” (Rensink, 2000a,b).
Change blindness phenomena arise out of two bottlenecks in processing. The first of these is inherent in the selective pathway. The visual search literature indicates that we recognize objects at a rate of, at most 20–30 objects/second (Wolfe, 1998) and that it is necessary to selectively attend to an object in order to recognize it (Wolfe & Bennett, 1997). Imagine that a scene has been examined and its salient objects registered. If one of those objects is changed and changed back without being selected by attention, the change will go unnoticed.
Moreover, our memory for visual stimuli is limited. That is the second bottleneck. Visual short-term memory is limited to perhaps 4 items (Luck & Vogel, 1997). Like other aspects of long-term memory, visual long-term memory must be vast in order to accommodate the picture recognition memory results. Nevertheless, that memory is neither precise nor unlimited. A classic textbook illustration is the poor performance of observers asked to state if Lincoln faces left or right on the US penny (Nickerson & Adams, 1979). Returning to change blindness; again imagine that a scene has been examined and its salient objects registered. If one of those objects is changed and not changed back, that change will go unnoticed if the item is not attended during the change (bottleneck 1) and if the change fails to produce a just noticeable difference within the memory for the changed scene (bottleneck 2). (Note that in the Hollingworth and Henderson task, observers are asked if a specific and unique item has changed. This turns the task from a recall to a recognition task, making it somewhat easier.)
The element of surprise in change blindness is produced by the non-selective pathway and by long-term visual memory. The non-selective pathway gives us some visual experience at all locations in the field. Memory for what has recently been selected and for what we know about visual stimuli allows us to give meaning to this experience. We are lulled into the belief that we fully see and understand what is in front of us and, as a result, we are surprised when it is proven not to be the case. Thus, faced with a brief array of letters, the non-selective pathway delivers a set of objects to visual experience. The selective pathway delivers the identity of a few of these. We infer a screen full of identified letters and are, perhaps, surprised to find that we do not know what was in the top row if asked shortly after the letters vanish (Sperling, 1960).
The most compelling illustrations of change blindness involve gorillas and vanishing airplane engines. In the experiments reported here, we illustrate the relationship of change blindness to bottlenecks in selective attention and to limits on visual memory by using very minimal displays. In most of these experiments, stimuli are simply arrays of colored dots. In six experiments, a partial-report technique was used to investigate observers’ memory for simple display scenes. Experiment One shows that observers, faced with an array of colored dots do not have the ability to tell if one of those dots changed color. Experiment Two makes the same point for orientation. Observers do not detect a change unless they happen to attend to the item. In Experiments Three and Four, we arrange for attention to be directed to specific dots prior to a change. We can show that observers attended to specific dots. At least, they could report the color of these dots. Nevertheless, the ability to describe the color of a recently attended item is poor –consistent with the limited nature of visual memory. Experiment Five demonstrates that attention to an object gives observers some memory for the state of the object at the time when it was attended, but no memory for subsequent changes to that same object once attention has gone elsewhere. Experiment Six directs attention at rates comparable to natural deployments of attention without improving the immediate memory for the color of a cued spot. Experiment Seven shows that this result is obtained with real world images.
EXPERIMENT 1 - A failure of immediate visual memory for color
As noted, the most striking apparent failures of immediate visual memory are the change blindness experiments in which observers fail to report changes in something dramatic like the identity of a speaker (Simons & Levin, 1998). These failures do not require semantically complex stimuli. Rensink (2000) had participants search for a change in a display of colored and oriented bars. The display alternated between frames with a single change in just one bar. A blank screen masked the transient that would have otherwise identified the location of the change. Rensink's results suggested that participants could monitor the color or orientation of about 4 objects (cf. Luck & Vogel, 1997). In the Rensink study, observers knew the nature of the change but not its locus. Perhaps change blindness is critically dependent on this spatial uncertainty. In Experiment One, in order to eliminate that difficulty, the locus of change was cued at the time of the change. The observers merely had to report whether a change had occurred at the cued locus. The display was otherwise unchanged. There was no intervening blank screen and no distracting transient (e.g. a “mudsplash” O'Regan, Rensink, & Clark, 1999). Can observers report the presence or absence of a color change that occurs “right before their eyes”?
Method
Participants
Ten participants, 18 to 55 years of age were tested. All participants gave informed consent and were paid for their participation. All participants passed the Ishihara color screen and had at least 20/25 acuity with best correction.
Stimuli
The experiments were run on Apple Power Macintosh controlled by MATLAB software using the Psychophysics Toolbox extensions (Brainard, 1997; Pelli, 1997). Stimuli were displayed on Mitsubishi Diamond Pro and Raster Ops Superscan MC*001 monitors running at a frame rate of 75 Hz. Responses were recorded via the keyboard. As illustrated schematically in Figure 1, there were 20 display elements, randomly divided between red and green circles, on a black background. The luminances of the stimuli were equated to a mean of 6 cd/m2. To further guard against the brightness of the elements affecting their salience we introduced a random variation of + or − 10% into the luminance of each element. The cue consisted of a luminance increment in one of the elements by 50% of its original luminance. From the viewing distance of 57 cm each element had a diameter of 1.5 deg. Elements were randomly assigned positions on the basis of a 10 X 10 grid of possible locations within a display area of 33 deg X 26 deg.
Figure 1.

Schematic representation of the stimuli used in Experiment 1. Here, black stands for red and hatched for green
Procedure
For each trial the elements of the array were displayed for a period randomly chosen between 500 and 1000 msec. During this period, observers simply looked at the static display. At the end of this time, the luminance of a single, target element was increased. On 50% of trials, this luminance increment was simultaneously accompanied by a change in color (from either red to green or green to red). Note that the remainder of the display was unchanged. Observers made an unspeeded response naming the color of the circle before the luminance cue. Feedback in the form of beeps informed participants as to when they responded correctly or incorrectly. The inter-trial interval was 1000 msec. Each subject completed one block of 200 trials. Participants were allowed breaks whenever requested. A new display was presented on each trial. The luminance increment might act as a weak mask. However, if attention is directed to an item, it is completely trivial to determine if the color of the item after the luminance increment is the same as the color prior to the increment. For instance, in pilot work we found that performance was essentially perfect if the critical item is pre-cued by 200 msec.
Results and Discussion
The average percent correct was 55.2%. This is significantly above 50% (t(9) = 3.7, p= 0.005). As noted, if the subject is attending to an item, performance on the task is essentially perfect. If we assume that observers could accurately report the color change for one item and would have to guess about the change at any other location, then performance should be 52.5% correct. The 55.2% average performance does not differ from this level (t(9 = 1.9, p > 0.05). Indeed, the 95% confidence interval for these data runs from 52% to 58% correct; performance that would be consistent with an ability to monitor or remember the color of 1–3 of the stimuli. A regression analysis indicated no increase in performance over the course of the 200 trials (F(1,9)=1.035, p>0.05).
The results of Experiment One suggest that color information is available for recall from only a very few of the items in the display, even though all items are clearly visible. Observers knew the task and might be expected to deploy all available resources to its performance. In this case, the available resource would seem to be a visual short term memory that could encode 1–3 items in the 500–1000 msec of exposure. What is important about this result is that observers show little ability to detect a change in color even when there is no uncertainty about the location of the change and even though the only transient in the display serves to attract attention to the locus of change rather than away.
Note that this is not “change blindness” is the usual sense. Observers are aware of the change and its location. They are largely unable to describe the nature of the change. Did the changed item change its color and luminance or just its luminance? Experiment Two shows a similar inability to describe the orientation of visible but unattended items.
EXPERIMENT 2 - Orientational Amnesia
The experimental design, illustrated in Figure 2, is very similar to that of Experiment 1, except that here observers are asked to describe the orientation of an item immediately after that item is hidden by a mask. Thus, Figure 2 shows the display that an observer would see after the target item was replaced by the square mask.
Figure 2.

Stimuli from Experiment 2. Observers would report on the orientation of the line segment now hidden by the square mask.
Method
Participants
Eight participants were recruited for this experiment under the same conditions as in Experiment 1.
Stimuli
In this experiment, the stimuli were red and green bars (2 deg X 0.5 deg). Thirty-two bars were presented on a irregular 6 x 6 grid. Elements could be tilted 45 deg clockwise or 45 deg counterclockwise, with no relationship between element tilt and color. A gray rectangle served as a cue to the location of the relevant item and as a mask of the orientation of that item.
Procedure
The procedure was identical to Experiment 1, except instead of using a luminance change to cue participants, target elements were masked by being replaced with a gray rectangle. Using exactly the same method as in Experiment One fails because an orientation change produces an apparent motion signal. Observers reported the orientation of the masked bar. Each subject completed one block of 200 trials.
Results and Discussion
Mean percentage correct for this task was 48.9%. This was not significantly different from 50% (t(7)=0.6, p>0.05). In this experiment, there was no evidence for retention of the orientations of even a small handful of items as there was in Experiment One. This might reflect some difference between the processing of unattended orientation and color. For instance, it might be difficult to code left and right tilt into VSTM (Wolfe & Friedman-Hill, 1992). Alternatively, it might be that the square mask acted as a new object, knocking the old item out of VSTM if it happened to be in VSTM (a form of object substitution masking; DiLollo, Enns, & Rensink, 2000). In any case, the slight difference between color and orientation is not directly germane to this paper. What is important is that, in either case, the features of clearly visible stimuli are not reportable immediately after those features are obscured. Neither feedback nor 200 trials of practice helped. Once again a regression analysis showed no increase in performance over the course of the 200 trials (F(1,7)=1.05, p>0.05).
EXPERIMENT 3 - Does prior attention help?
In Experiments One and Two observers are unable to describe the color or orientation of items the instant after those items had been removed or changed. Those items had been visible for some length of time and there was no uncertainty as to the location of the item to be reported. Is this a reflection of the limits on VSTM or, perhaps, did observers fail to pay attention in Experiments One and Two? In Experiment One, there was some evidence that observers had attended to and could report the color of 1–3 items. In Experiment Two, the data did not even provide evidence for that level of effort on the part of the observers. Even though items can be identified at a rate of 20–30 items per second, perhaps our observers just did not bother. We do not know because the deployment of attention was not under any experimental control. Observers were free to attend or not attend to stimuli prior to the cue. In Experiment Three, deployment of attention was manipulated by inducing observers to attend to specific items. We asked if some memory for the basic features of attended items survives the hiding of those features.
Method
Experiment Three used a simple extension of the methods of Experiment One as illustrated in Figure 3. A set of colored disks was presented on the screen. A specific disk was cued by increasing its brightness. Observers were asked to identify the current color of that cued stimulus (“What IS the color?”; henceforth, an IS response). After a variable number of IS responses to disks in the same, otherwise static display, one item was cued and masked and the observer was asked “What WAS the color?” (henceforth, WAS responses). The item cued for a WAS response might or might not have been cued for a previous IS decision. Moreover, the number of intervening responses between an IS response to an item and a subsequent WAS decision about the same item could be systematically varied in order examine the time course of any benefits of prior attention.
Figure 3.

Sample sequence for Experiment 3. Observers make decisions about the current color of cued items. On critical trials, they try to identify the color of an item that may or may not have been previously cued.
Participants
Nine participants were recruited for this experiment under the same conditions as in Experiment 1.
Stimuli
Stimuli were the red and green circles of Experiment One. A luminance increment of 75% cued observers on IS trials. The final WAS target was cued by changing one of the items from red or green to blue. Since blue was not otherwise displayed, the appearance of the blue disk told the observer that it was time for a WAS response. Thus, in this version of the experiment, observers knew the locus of the change. They knew that a change (to blue) had occurred. All they needed to do was to report on the color that had been present the instant before the change. This is a completely trivial task if just a single item is displayed.
Procedure
At the start of a trial the elements of the array were displayed for a period randomly chosen between 1500 and 2000 msec. After this initial period, one element was cued by an increment in luminance. Observers made an unspeeded response naming the color of this element as red or green. As soon as a response was made a different element was cued at random. This process continued for anywhere from 2 to 14 such IS responses. At the end of the sequence of IS responses, a final target element turned blue. On 80% of trials, this element had previously been cued for an IS response. If so, it had been cued either 2, 4, 8 or 12 responses prior to the WAS response. On 20% of the trials, the item cued for the WAS response had not been cued for an IS response. After the WAS response, the screen was blanked. A 1000 msec intertrial interval preceded the next stimulus array. Each observer completed two blocks of 200 WAS trials and an average of 4240 IS trials. Observers were allowed breaks whenever requested.
Results and Discussion
Average percent correct as a function of IS-WAS interval is shown in Figure 4. Confidence intervals and t-test of the hypothesis that performance is above the 50% level are shown in Table 1.
Figure 4.

Mean percent correct for the five types of WAS trials in Experiment Three. Error bars show the 95% confidence intervals around the mean. Note that “back-12” is the most distantly probed in time and “back-2” the most recent. Thus time runs from left to right.
Table 1.
Testing the hypothesis that performance on WAS trials in Experiment 3 differs from chance (50%).
| Mean | DF | t-Value | P-Value | 95% Lower | 95% Upper | |
|---|---|---|---|---|---|---|
| unattended | .528 | 8 | .728 | .4876 | .440 | .616 |
| back-2 | .806 | 8 | 10.727 | <.0001 | .740 | .871 |
| back-4 | .592 | 8 | 1.685 | .1304 | .466 | .718 |
| back-8 | .558 | 8 | 1.010 | .3420 | .426 | .690 |
| back-12 | .556 | 8 | 1.002 | .3456 | .428 | .683 |
The baseline (Uncued) condition produced 53% correct responses. This serves as a replication of Experiment One though in this case performance did not differ significantly from chance (t(8)=2.01, p>0.05). Turning to the Cued conditions, there is a clear effect of prior IS responses on the accuracy of a subsequent WAS response. Observers perform quite well on WAS responses that are made to an item that had been the subject of an IS response two responses earlier. From 80% correct in the 2-back condition, performance falls to a roughly constant level for the three other cued conditions (4-, 8-, and 12-back). Performance is not significantly above 50% for any of these conditions (see Table 1), though we might imagine that the small elevation above 50% might rise to statistical significance with more participants or more trials. Participants were 95% correct on the IS trials. They tended to be slower and less accurate on the first trial in a series of IS responses.
The results show that attending to and naming an item makes it more likely that the color of that item will be available immediately after the item is masked. The effect is clear only for the 2-back data. It is, at best weakly suggestive for the 4-back condition. Note that this suggests a very limited role for any visual short term memory in this task. The last two to four items might be remembered and even that paltry number could be the result of verbal recoding. Experiment Four replicates this result with some variation in methods.
Hollingworth and Henderson (2004) used a similar method with more natural scene images. They also found a small recency effect. However, they found evidence for substantial longer-term memory for attended items. As discussed above, their methods allow observers to use whatever processes support picture recognition memory (Did this unique wrench change orientation?) whereas our method did not (Was this decidedly non-unique red dot previously green?)
EXPERIMENT 4 - Prior attention to a well-learned display
In Experiment Three, an array of stimuli was presented for up to 14 IS responses and for a single WAS response. In Experiment Four, a single array was presented for 100 WAS trials. Observers made a series of IS responses and a smaller number of WAS responses. Some items were never cued for IS responses. Items that were cued could be cued many times. As in Experiment Three, one critical variable was the number of IS decisions lying between a WAS response and the most recent IS response to the same stimulus. This method also makes it possible to examine effects of extended exposure to the stimulus. With prolonged exposure to a static display, we worried that observers might be able to use various undesirable strategies to arrive at a correct response. For example, in this unspeeded task participants might simply count the number of circles of each color and note a change in number. To thwart this sort of strategy, a subset of irrelevant stimuli changed color on each trial. Observers were never queried about these items.
Method
Participants
Ten participants were recruited for this experiment under the same conditions as in Experiment 1.
Stimuli
The stimuli in this experiment were again made up of colored circular elements on a black background. Experiment Four used four colors - red, green, cyan and purple, changing the chance level to 25%. There were 30 items in the stimulus array. Twenty of these were task-relevant. The remaining ten irrelevant (never cued) items changed color with each response. To avoid confusion with the irrelevant color changes, the nature of the cue was changed in this experiment. For IS responses, a small white dot appeared in the center of probed items. For WAS responses, the entire item turned white.
Procedure
At the start of a trial, the elements of the array were displayed for a period randomly chosen between 1500 and 2000 msec. At this point one element was cued by a small white dot appearing in its center. Observers made an unspeeded IS response, giving the color of the cued item. As soon as a response was made a different element would be cued at random and the ten irrelevant elements would all change color at random. After 2 to 14 such IS responses, an item would turn entirely white and the observer was instructed to make a WAS response about the now-hidden color of that item. Note that this item was the same color at the moment it was hidden that it had been throughout the preceding run of IS responses. As was the case with Experiment Three, this element could have been one that had been previously attended (either 2-, 4-, 8- or 12-back in the sequence of response), or one that had not (i.e. a disk that had remained constant in its color but about which no IS judgment had been made). After the WAS trial, the process would start again, with an element being probed for an IS decision. The critical difference between Experiments Three and Four was that, in Experiment Three a new array was presented after each WAS response, while in Experiment Four the same array was used for an entire block of trials. Each subject completed two blocks of 200 WAS trials and an average of 2120 IS trials. Participants were allowed breaks whenever requested. Two participants completed only one block of 200 WAS trials (~2100 IS trials) Their data follow the same pattern as the more practiced participants and are included in the analysis.
Results and Discussion
Figure 5 shows the mean percent correct for the five conditions. As was the case with Experiment Three, inspection of this figure shows an effect of condition on percent correct such that performance was the highest for the attended 2-back condition and lowest for the unattended condition. There appears to be a trend of decreasing performance levels as we go from 2-back towards 12-back. With four possible colors to choose from, chance performance is 25%. Table 1 shows 95% confidence intervals and t-test results, test the hypothesis that performance differs from the 25% level.
Figure 5.

Results for Experiment Four. The dotted line shows the 25% chance level. Error bars show the 95% confidence intervals.
In this experiment, the 2- and 4-back conditions show evidence for memory. The 8- and 12-back results are a bit above the 25% level but not significantly so. It might seem surprising that steady exposure to the same set of stimuli in Experiment Four did not produce more evidence for memory. Recall that participants were responding to a set of 20 disks that did not change during the block of 200 WAS and approximately 2100 IS trials. Thus, even disks that had not been the subject of an IS decision might have been cued multiple times during the course of the extended block of trials for a WAS decision. There is a hint of a developing memory for these unattended disks. Performance on unattended disks rises from an average of 20% in the first quarter of the trials to 33% in the last quarter. This improvement is significant (paired t-test, t(9)=2.6, p=0.015). However, there is no similar evidence for a developing memory for the 8- and 12-back stimuli. Perhaps this weak evidence for memory beyond a recent memory for IS responses is not surprising. The demand characteristics of this task might not push participants toward memorization of the display. Recall that 10 of the 30 disks change color at random so the overall configuration of the display changes from moment to moment. These results suggest that detailed memory for a display may not develop passively even if an observer is looking at unchanging objects. While this task presents an unnatural situation, it is not an unreasonable approximation to real-world situations. Imagine the view from a sidewalk cafe. The fact that many objects (cars, pedestrians, pigeons) are changing does not make it impossible for you to learn something about the static objects in the field (fountain, sidewalk, streetlight). As noted, in approximations to natural scenes, Hollingworth and Henderson (2002, 2004) found evidence for memory for previously fixated objects. Their experiments show that you can remember something of what you have seen. This, of course, is hardly surprising. Our experiments show how little is remember of simple stimuli that remain visible up until the moment that the memory is probed.
EXPERIMENT 5 - When is the scene memory updated?
At the outset of this paper, we proposed two factors limiting the ability to detect changes in scenes. First, objects are selected by attention and recognized at a rate of 20–30 items per second and a change can be detected only if the object is attended at the right time. Second, there are profound limits on the capacities of short and longer-term visual memories. The first four experiments are consistent with this view. Performance is very poor. The only exceptions can be attributed to the role of a limited capacity visual short-term memory (with a possible longer term contribution in Experiment Four). The presence of a limited memory for attended items allows a more direct test of the hypothesis that only changes to attended items can be detected. In Experiment Five, we exploit this limited memory in order to test the role of selective attention. Consider the case in which the observer successfully recalled the color of an item that had been cued two trials previously (a 2-back IS response). What is the basis of the successful WAS response? There are, at least, two possibilities. Our hypothesis states that the representation of the scene and the memory for that representation were updated at the time of the IS response. The effects of attention to that particular item would end when attention was directed to the next item. Alternatively, attention to the item at the time of the IS response might produce some ongoing change in the processing of the attended item such that its information about its current color would be available even after attention had been deployed elsewhere.
Experiment Five is designed to distinguish between these possibilities.
Figure 6 illustrates the design of the experiment. As in Experiment 4, observers make a series of IS responses, followed by a WAS response. In Experiment 5, however, the color of a cued item was changed immediately at the time of the cueing of the next IS response. Thus, in Figure 7, the item labeled “1” is cued for an IS response on Trial 1. Item “2” is cued on Trial 2. Note that item “1” changes color at this time. Later, on some Trial N, item 1 is cued again, now for a WAS response. There are three types of answers to the question “What color WAS item 1?”
Figure 6.

Sample sequence for Experiment Five. After an IS response, the item might change its color. Thus, item 1 is queried for an IS response on Trial 1. It's color is changed at the time of Trial 2 when another item is attended. On the critical WAS trial (Trial N), observers try to identify the color of that item just prior to the mask. Are they more likely to give the “true” color (that shown in trial 2) or the color from the IS response on Trial 1?
Figure 7.

Results of Experiment Five. Because chance level for Wrong responses is 50%, Wrong response rates are divided by 2 to make them comparable to the Memory and Visual responses, each of which has a chance probability of 25%. Error bars are 95% confidence intervals. As before, the most recently cued items are to the right of the graph.
If observers only gain information about the object at the time when the object is attended, then, assuming that they remembered it, they would provide the color remembered from the trial when that item was last cued.
If attention to the object changes the processing of the object in a manner that makes continuous monitoring of the color possible, then, assuming that they remembered it, observers could respond with the newer color that was visible just prior to the mask that cued a WAS response.
Finally, of course, observers might simply guess. Given that there are four colors in this experiment, they would have a 50% chance of producing an entirely wrong response.
Chance responding would yield 25% Memory Color responses, 25% Visual Color responses, and 50% responses giving one of the two remaining colors (Wrong Color responses).
Method
Participants
Ten participants were recruited for this experiment under the same conditions as in Experiment 1.
Stimuli
The stimuli in this experiment were the same as in Experiment 4 but with no task-irrelevant items. Except for the change in the color after an IS response, the display remained completely static. Set size was 20 items.
Procedure
At the start of a trial the elements of the array were displayed for a period randomly chosen between 1500 and 2000 msec. At this point one element was cued by a small white dot appearing in its center. Observers named the color of the element (IS response). As soon as a response was made the color of the cued item switched to one of the three other possible colors and a new item was cued at random for the next IS. This process continued for 2 to 14 such responses, whereupon one element turned entirely white and the observer was asked to report what color it had been before it turned white (WAS response). As was the case with Experiment 4, this element could have been one that had been previously attended (either 2, 4, 8 or 12 responses ago), or one that had not (i.e. a disk about which no IS judgment had been made). After this WAS decision, the process would start again, with elements being probed for IS decisions. Note that observers were instructed to give the color of the disk immediately prior to the WAS cue, but they were not informed about possible changes in the color of the previously cued items. Thus, for the observer, the newer, visible color of the disk was the truly “correct” response. Indeed, observers were given trial-by-trial feedback in which only correct Visual Color responses were labeled as “correct” in order to push observers to give the Visual Color response if possible. Each observer completed two blocks of 100 WAS trials. These were accompanied by approximately 2100 IS responses per block.
Results and Discussion
Figure 7 and Table 3 show mean percentage correct for Visual Color and Memory Color responses. Each of these has a chance probability of 25%. Wrong Color responses have a chance probability of 50% so the figure shows Wrong Color rates divided by two to make them directly comparable to the correct response rates. Table 3 shows the results of t-tests testing for significant deviation from the 25% chance level. As in Experiment Four, actual performance deviates from chance performance only for the WAS responses made to items that were the subject of IS responses 2 or 4 responses after previously. The observers are producing Memory Color responses reporting on the color that was present when they were last queried about a specific disk. They show no evidence of an ability to make correct Visible Color responses. Visible Color and Wrong Color responses differ from chance levels for the 2-back condition but only because they fall significantly below chance levels.
Table 3.
Testing the hypothesis that rates of different –types of responses in Experiment 5 differ from chance (25%). Note that italicized conditions are significantly below chance.
| Mean | DP | t-Value | P-Value | 95% Lower | 95% Upper | |
|---|---|---|---|---|---|---|
| VISback2 | .171 | 9 | −2.847 | .0192 | .108 | .234 |
| VIS back 4 | .215 | 9 | −1.282 | .2318 | .153 | .277 |
| VIS back | .227 | 9 | −.842 | .4218 | .165 | .289 |
| VIS Back 12 | .211 | 9 | −1.562 | .1527 | .155 | .267 |
| MEMback2 | .565 | 9 | 6.634 | <.0001 | .457 | .672 |
| MEM back4 | .325 | 9 | 3.197 | .0109 | .272 | .379 |
| MEM back8 | .268 | 9 | 1.137 | .2847 | .232 | .304 |
| MEM back12 | .241 | 9 | −.795 | .4470 | .216 | .266 |
| WRONG back2 /2 | .133 | 9 | −7.382 | <.0001 | .097 | .169 |
| WRONG back4 / 2 | .231 | 9 | −1.606 | .1426 | .204 | .258 |
| WRONG back8 / 2 | .254 | 9 | .305 | .7673 | .228 | .279 |
| WRONG back 12 / 2 | .274 | 9 | 1.888 | .0916 | .245 | .303 |
| Unattended | .301 | 9 | 1.809 | .1039 | .237 | .364 |
WAS responses to Unattended items produced a 30% accuracy rate. This was not significantly different from the 25% level expected by chance.
The results of Experiment Five replicate the results of Experiments Three and Four. A few recently attended items get into some sort of memory and are available for recall. However, consistent with the hypothesis that object information is updated only while an item is selected, there is no evidence that attention to an item makes it possible to detect or remember subsequent changes to that item. Assuming that the memory being probed is VSTM, this result shows that the maintenance of items in VSTM is not based on reference to information about those object retained in the earliest stages of visual processing. Early representations of the objects presumably reflect changes in the color of even unattended items. For example, one would expect the negative afterimage of the dot to reflect a color change even if the observer was unaware of the change.
Experiment Six: Rapid cueing
The argument of this paper is that failures to detect change and/or failures to recognize the nature of a change occur because we only update the identity of objects when we selectively attend to them and that this updating of the visual representation is subject to memory capacity limitations. The method of Experiments 3–5 has been to control the updating process by having observers make IS responses prior to making a critical WAS response. While this allows us to be sure that observers have attended to specific items, these putative updating events are occurring at a rate much slower than anyone’s estimate of the rates of object recognition in tasks like visual search or in scene analysis. In Experiment Six, a series of items is cued very rapidly, at rates comparable to object processing rates estimated from other tasks. At these speeds, we cannot collect the IS responses that assured us that observers were complying by attending to our selection of items. However, we can collect WAS responses and seek evidence for an effect of the cueing.
Rapid presentation of cues addresses another concern. The fairly slow, self-paced nature of Experiments Three, Four, and Five might have encouraged verbal recoding. Note that fully reliable verbal memory is not likely to have governed responses because the task would have been dauntingly complex. First, the observer would need to have remembered a set of color terms in order (e.g. red, blue, red, green). When an item was cued for a WAS responses, the observer would have to have known that the item cued for the WAS response was, for example, the 4-back item. Then the observer could read out the correct item from the list. This seems unlikely. It does seem possible that observers might improve over chance performance by remembering the last two or three colors and using those color names to guess about the WAS response, especially for 2-back items. Any sort of verbal recoding will be made more difficult if the stimulus onset asynchrony (SOA) between cues is short.
Method
Participants
Twelve participants were recruited for this experiment under the same conditions as in Experiment 1.
Stimuli
Visual stimuli were 20 colored squares subtending 1 deg on a side at the 57 cm viewing distance. On each trial, items occupied randomly chosen locations on an invisible 5 x 5 grid subtending 17 deg on a side. Squares could be yellow, blue, green, purple, or red. Colors were randomly chosen with the constraint that there be at least one item of each color in a display. To cue an item, its luminance increased briefly by 50% and its area increased briefly by 75%. This luminance and size change should serve as an effective exogenous cue to attract attention (Brawn & Snowden, 1999).
The WAS response was cued by a gray cross subtending 1.7 x 1.7 deg. This served to hide the underlying square and, thus, mask the color of the cued item. It also served as a clear cue for a “WAS” response. Stimuli and their experimental configuration are illustrated schematically in Figure 8.
Figure 8.

Stimuli are twenty colored squares. After rapid cuing of three, six, or eight items, one item is hidden and probed for the memory test. What color was presented on the position of the cross?
Procedure
An experimental trial started with the presentation of a white fixation cross. After 500 ms the display of 20 squares of randomly chosen colors and positions appeared. After another 500 ms the cueing sequence started. Depending on the block, either 3, 6, or 8 elements were cued, one after another, at one of three SOAs: 50, 150, or 300 msec. These rates are comparable to estimates of the rate of deployment of covert attention. After the end of the cue sequence, a single item was masked by a gray cross, and observers made the unspeeded 5 AFC color choice by pressing one of five keys with color words inscribed on the keyboard buttons. On 90 % of trials, the probed item was chosen from the cued set. We assume these to be the 'attended items'. The other 10% of cues were used to measure baseline levels of recall for previously uncued items. The position of the masked item in the previously cued set was randomized. The cue length and SOA variables were blocked. Observers were tested for an average of 50 trials at each n-back position plus 10% trials at uncued locations. All told, observers performed 2,550 trials.
On screen feedback was provided after each trial and a brief computer-generated tone marked incorrect decisions. Participants initiated each trial with a key press and could take breaks whenever requested. Volunteers were instructed to attend to the cue string to prepare for a memory test and then make an unspeeded decision to indicate the target color. The importance of accuracy was emphasized.
Results and Discussion
The first interesting aspect of these results is that observers perform at better than chance levels even for the uncued items. The accuracy for those items is shown in Table Five.
Table Five.
Testing the significance of deviation from chance levels for cue strings of length 3. “Mean difference” is the difference between the average empirical chance level and the average performance for that position in the list. Even with a concern for statistical significance raised by the problem of multiple comparisons, it is clear that observers perform better than chance.
| nback | SOA | Mean Diff. | t(11) | P-Value |
|---|---|---|---|---|
| 0 | 50 msec | 10% | 2.69 | 0.021 |
| 1 | 50 msec | 22% | 7.11 | <.0001 |
| 2 | 50 msec | 31% | 8.97 | <.0001 |
| 0 | 150 msec | 44% | 6.31 | <.0001 |
| 1 | 150 msec | 32% | 4.88 | 0.0005 |
| 2 | 150 msec | 32% | 4.67 | 0.0007 |
| 0 | 300 msec | 56% | 13.38 | <.0001 |
| 1 | 300 msec | 38% | 6.95 | <.0001 |
| 2 | 300 msec | 40% | 6.66 | <.0001 |
This is almost undoubtedly an unintended side effect of the experimental design. Colors were chosen randomly in each display with the constraint that all colors had to be present. That means, in the extreme, that a display could have consisted of one red, one blue, one, green, one purple, and 16 yellow items. Under these circumstances, an observer who was guessing about the color of a now hidden item, would do well to guess “yellow”. This works only if observers can base an estimate the relative frequencies of colors on information gathered while selective attention is occupied elsewhere. There is evidence that this is the case (Braun & Julesz, 1998; Wolfe, Klempen, & Horowitz, 1997). Given these displays, an ideal observer could achieve 30% correct by always guessing the most common color in the display. Our observers fall just a bit short of that ideal (27% on average across all conditions).
For the purposes of the present studies, this result merely means that accuracy on cued items should be tested against the empirical “chance” level averaging 27% and not against the theoretical 20% level. One could test against the ideal 30% correct level but this assumes that human observers could ascertain the most common color on every trial. That seems too conservative (though the change would not alter the analysis very much).
Figure Nine shows accuracy as a function of order in the pre-cue list for each cue SOA and for lists of 3, 6, and 8 items. As in the other figures, time runs from left to right so that the item cued most recently is on the right side of the figure. The dotted line in each graph shows the empirical chance performance for uncued items (averaged across cue string length).
Tables Six through Eight show the results of paired t-tests comparing performance at each n-back position to the appropriate, empirical chance level for that set of trials.
Table Six.
Testing the significance of deviation from chance levels for cue strings of length 6. Given a concern for statistical significance raised by the problem of multiple comparisons, the strongest evidence for above chance performance lies at the longer SOAs and the most recent positions in the list (n-back 0,1, 2) .
| n-back | SOA | Mean Diff. | t(11) | P-Value |
|---|---|---|---|---|
| 0 | 50 | 10% | 2.43 | 0.0334 |
| 1 | 50 | 9% | 2.43 | 0.0334 |
| 2 | 50 | 11% | 3.09 | 0.0103 |
| 3 | 50 | 8% | 2.58 | 0.0257 |
| 4 | 50 | 10% | 2.55 | 0.0271 |
| 5 | 50 | 10% | 2.58 | 0.0258 |
| 0 | 150 | 37% | 7.09 | <.0001 |
| 1 | 150 | 21% | 4.90 | 0.0005 |
| 2 | 150 | 10% | 2.80 | 0.0174 |
| 3 | 150 | 13% | 2.98 | 0.0125 |
| 4 | 150 | 11% | 2.78 | 0.018 |
| 5 | 150 | 18% | 2.58 | 0.0257 |
| 0 | 300 | 53% | 14.37 | <.0001 |
| 1 | 300 | 24% | 6.39 | <.0001 |
| 2 | 300 | 19% | 4.40 | 0.0011 |
| 3 | 300 | 14% | 3.03 | 0.0114 |
| 4 | 300 | 16% | 4.16 | 0.0016 |
| 5 | 300 | 25% | 4.39 | 0.0011 |
Table Eight.
Capacity estimates for Experiment Seven.
| “Empirical” Guessing Level | Theoretical Guessing Level | |||
|---|---|---|---|---|
| SOA 150 | SOA 300 | SOA 150 | SOA 300 | |
| 3 items | 1.8 | 2.2 | 2.1 | 2.3 |
| 6 items | 2.1 | 2.4 | 3.1 | 3.2 |
Note that these tests of accuracy levels against a baseline are planned comparisons. Thus the p-values in Tables 6–8 are not corrected for multiple comparisons. Nevertheless, one might want to be cautious about the significance of conditions with p-values near 0.05. Several conclusions can be drawn from these results. First, there is clear evidence for better performance for cued items than for uncued. Second, this evidence is strongest for the most recently cued items (n-back 0, 1, or 2). Third, there is a hint of a primacy effect: string length 3, SOA=50; string lengths 6 & 8, SOA=150 & 300. For the longer strings and slower SOAs, a primacy effect could be taken as an indication of some form of verbal recoding. Recency is more consistent with the actions of a limited-capacity visual short-term memory.
We can estimate the capacity of the memory from these data by assuming that at each position in the list…
Accuracy = P(remembering the item) + (1-P(remembering))*the empirical chance level
P(remembering) = capacity/string length.
Solving for capacity, we find that
where “Acc” is the accuracy for each item in the list and “Ch” is the empirical chance level.
The results of this calculation are shown in Figure 10:
Figure 10.

Capacity as a function of SOA for different cue list lengths
Note that SOA is the determining feature. Given more time, the capacity rises from about one item to about two. Interestingly, this is little affected by the number of items cued. We cannot perform identical calculations for the other experiments because observers may have attended to more positions than we cued and because we did not test all list positions as we did here. However, the results of previous experiments are consistent with the notion that observers have only a limited capacity to remember attended items.
The results of this experiment are consistent with the hypothesis that a very limited capacity visual short-term memory allows observers to recover the identity of a very few recently attended items. In spite of the differences in method, the results are broadly similar to the results of the previous experiments: Good memory for the most recently cued item with rapidly declining memory thereafter. Given the rapid rate of cueing in this experiment, it seems unlikely that verbal recoding accounts for the results in this case.
Experiment Seven: Natural Scenes
In a final experiment, we return to the more naturalistic stimuli used in the more striking change blindness demonstrations. Our goal is to see if the addition of a rich, meaningful context would make a substantial change in the results of experiment like the previous one.
Method
In Experiment Seven, observers looked at scenes like that shown in Figure 11.
Figure 11.
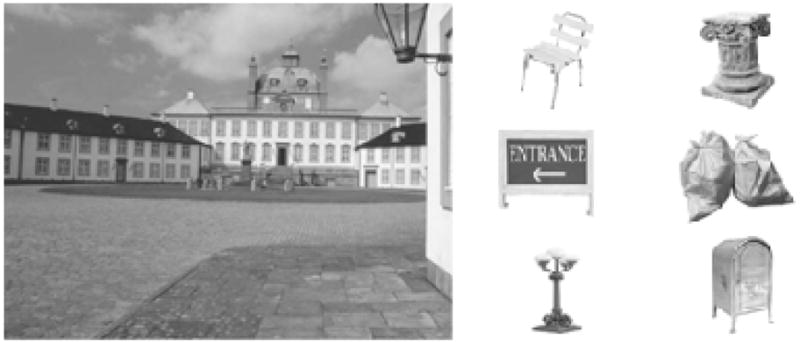
Observers viewed a scene like the one on the left of this figure. Twelve objects like those on the left (but proportionally smaller) were seeded into plausible locations in the image. Actual images were full color.
Actual stimuli were full color. There were four background scenes. Associated with each scene was a set of 36 plausible items (meaning, for example, that the lamppost appeared in the courtyard scene of Fig. 11 but not in the kitchen scene). On any given trial, twelve of the items were placed in plausible locations on the background (e.g. the lamppost appeared on the street level, not in mid-air or on a roof). The background occupied an area of about 30 x 20 deg. Each object fit in a 2.6 x 2.6 deg region (Note that objects were not always appropriately size scaled but were not ridiculous in context).
After viewing a fixation stimulus for 1000 msec, observers viewed the scene passively for 500 msec. Then either three or six items were cued at SOAs of 150 or 300 msec in different blocks. At the end of the cue string, one item was hidden by a yellow box. The set of all 36 objects was presented as a response screen and the observer indicated which of the 36 items had been present at the location of the yellow square. As in the previous experiment, 10% of trials queried the identity of an uncued item. The other items were picked at random from the cued list. Feedback was given on each trial. After practice, observers were tested for 920 trials.
Ten observers between 18 and 40 were tested under the same conditions as in priorexperiments.
Results
Accuracy as a function of position in the cue list is shown in Figure 12.
Figure 12.

Accuracy as a function of position in the cue list for SOAs of 150 and 300 and cue list lengths of 3 and 6 items. “Baseline” accuracy is accuracy for uncued items.
The first feature of the results that bears notice is baseline performance. Given that observers are picking from a set of 36 items, chance would seem to be 1/36 or 2.8%. Performance is far in excess of that level. If we assume that 4 or 5 items are held in a Visual STM, then chance would be higher – the chance of having the item in VSTM plus the chance of picking it at random (14–16%). Performance is above this level, too. Clearly, observers are learning something about even the uncued items. The most likely source of information, as in the prior experiment, is the color of the items. Red stop signs, blue baby carriages, and so forth, appeared consistently throughout the experiment. If an observer noted that there was less red in the cued display, then the set of possible target items would be greatly reduced.
Accuracy for the cued items is modestly higher than the comparable results in Experiment Six but the overall impression is that use of realistic stimuli does not markedly change the results. This is borne out in the capacity estimates. One can ask, as in the previous experiment, how much additional information is available about the cued items than about the uncued. To answer this question, we use the empirical chance levels of around 25% shown on the figure. Alternatively, one can ask how many of the 12 objects are available to the observer in any manner. In this case, we use the theoretical chance level of 2.8%. The estimates are shown in Table Nine.
The capacity estimates are a bit larger than those in the previous experiment. However, as with the accuracy data, the interesting fact is that the results of Experiment Seven are not dramatically different from those of Experiment Six. Even with meaningful stimuli, 500 msec of preview and a relatively slow, 300 msec SOA, capacity doesn’t even reach the small capacities usually found in VSTM experiments.
While this result might seem to be at variance with the better memory shown in Hollingworth and Henderson, it is worth noting again that their task has similarities to picture recognition tasks (Has this object changed?) while ours is a cued recall task (What was here before?). Comparing these two approaches in a single experiment would be an interesting project.
General discussion
The results of these seven experiments help to illuminate the relationships between change blindness, visual short-term memory, and visual experience. To briefly review the implications of the specific experiments:
Experiment One shows that observers are very poor at describing a change (or its absence) even when very simple stimuli are used, even when there is no uncertainty as to the location of the change and even when no effort made to hide the change signal or divert attention away from that change. It may be a little unfair to call this “change blindness” in that the observer is perfectly aware that something happened at the locus of interest. However, the observer is generally blind to the nature of the change.
Experiment Two shows that this is not an oddity of changes in color. The same result is obtained with orientation.
Experiments Three and Four demonstrate that there is some memory for recently attended items in the display but that this is very limited, either in time or in capacity. Observers are quite good at giving the color of a recently cued item and quite poor when asked about items earlier in the cued list.
Experiment Five shows that attention to an item at one moment in time conveys no benefit if the observer must note a change in that item after attention has been diverted elsewhere. When there is an accessible representation of the features of an object, it appears that the available features are those that were noted when the object was last attended. Subsequent changes in the object are not available for explicit recall, though beyond doubt, it would be the changed color that would determine implicit measures of visual processing such as the color of a negative afterimage at that location.
Experiment Six shows that little changes when the cueing rate is speeded up. There is still evidence for a very limited capacity memory for cued items. This makes it unlikely that the results of Experiments 1–5 involved verbal recoding. At the same time, the lack of improvement in performance suggests there is no perfect “iconic” memory of the image, available to be read out at the end of a swiftly presented cue sequence.
Finally, Experiment Seven shows that the meaning and structure of real world scenes produces only modest increases in the estimates of the capacity of the memory that limits performance in these tasks.
We hold that these results are consistent with the two pathways account offered at the start of this paper. In Experiment Five, for example, observers spend a long time looking at a relatively stable scene. If asked, no doubt, they would tell you that they were looking at a collection of colored dots. They would have some notion of the statistical properties of the display – colors, sizes, etc. (Ariely, 2001; Chong & Treisman, 2003). In the present experiments, this is illustrated by the ability to perform at above chance levels when guessing the color of an uncued dot in Experiment Six. The non-selective pathway would deliver an experience of color at specific loci in the field. The series of IS responses would make it clear to the observers that they could identify the color of any specific spot, if asked. All of this would give rise to the compelling impression of a visual world, filled with identifiable objects. Given that rapid speed of identification, observers may be forgiven for the impression that all of this information is instantaneously available. However, when asked for the color of a spot at the instant it vanishes, observers’ responses reveal the limits imposed by two bottlenecks. First, they are only able to report on the color of targets that have been recently selected (the subject of recent IS responses). Second, even for those items, accuracy is limited by a memory with a capacity of something less than 4 items. In this manner, observers can see and yet be blind.
Other work on visual short-term memory has pointed to a capacity of 4 objects (Luck & Vogel, 1997). It is interesting that the capacity estimates here are even lower. Studies like the Luck and Vogel study typically use smaller set sizes than we used here. It is possible that we spread the limited capacity so thinly that our method could not see all of it. Alternatively, looking at Figure 10, for example, we can imagine that capacity might have been larger with longer ISIs. In any case, it is quite clear that the capacity of the memory required for this task is extremely limited. Other, seemingly similar tasks appear to show a larger memory. For example, inhibition of return (IOR) is a phenomenon in which responses are slowed or less accurate at loci that have been recently visited by attention (Klein, 2000). Several experiments have used a paradigm similar to ours. A series of items are cued in sequence and then IOR is assessed as a function of position in the cue (Danziger, Kingstone, & Snyder, 1998; Dodd, Castel, & Pratt, 2003; Snyder & Kingstone, 2000). Results vary but there are credible claims for IOR for 6 or more positions. This might be considered to be an illustration of the distinction between implicit and explicit memories. Observers do not know that IOR is present or absent at a locus. It is revealed by RT lags or reduced accuracy. While it may serve a useful function (Klein & MacInnes, 1999), it does not have an impact on visual experience. In the present context, the dissociation between IOR and VSTM is reminiscent of our discussion of the results of Experiment Five. In Experiment Five, participants were unable to report on a change in color of a dot if that change happened after the dot had been attended and before it was attended again. Nevertheless, we could have found implicit evidence that some parts of the visual system had registered the change (e.g. with an afterimage measure). For present purposes, IOR can be considered to be similarly implicit evidence that attention had visited a locus even if that information is not helpful in the task of identifying change at the once-attended locus.
Figure 9.

Accuracy as a function of position in the pre-cue list for each SOA and each cue string length. Items cued most recently are plotted at the right of this figure.
Table 2.
Testing the hypothesis that performance on WAS trials in Experiment 4 differs from chance (25%).
| Mean | DF | t-Value | P-Value | 95% Lower | 95% Upper | |
|---|---|---|---|---|---|---|
| unattended | .289 | 9 | .792 | .4490 | .178 | .400 |
| 2-back | .742 | 9 | 16.781 | <.0001 | .676 | .808 |
| 4-back | .416 | 9 | 5.772 | .0003 | .351 | .481 |
| 8-back | .310 | 9 | 1.687 | .1258 | .230 | .390 |
| 12-back | .292 | 9 | .931 | .3764 | .190 | .394 |
Table 4.
Accuracy for test items that had not been pre-cued. Note that all are above the nominal 20% “chance” level and that most are significantly above that level by a paired t-test.
| Cue String | SOA | % correct | t(11) | P-Value |
|---|---|---|---|---|
| 3 items | 50 msec | 27% | 1.78 | 0.103 |
| 3 items | 150 msec | 27% | 2.77 | 0.018 |
| 3 items | 300 msec | 30% | 2.30 | 0.042 |
| 6 items | 50 msec | 30% | 3.99 | 0.002 |
| 6 items | 150 msec | 29% | 2.88 | 0.015 |
| 6 items | 300 msec | 24% | 1.81 | 0.098 |
| 8 items | 50 msec | 28% | 2.33 | 0.040 |
| 8 items | 150 msec | 28% | 2.88 | 0.015 |
| 8 items | 300 msec | 24% | 1.38 | 0.196 |
Table Seven.
Testing the significance of deviation from chance levels for cue strings of length 8. The strongest evidence for above chance performance lies at the longer SOAs and the most recent positions in the list (n-back 0,1, 2). At SOA 200, there is some evidence for a weak primacy effect as well as a recency effect.
| nback | SOA | Mean Diff. | t(11) | P-Value |
|---|---|---|---|---|
| 0 | 50 | 13% | 2.46 | 0.0314 |
| 1 | 50 | 11% | 2.84 | 0.0162 |
| 2 | 50 | 13% | 2.08 | 0.0619 |
| 3 | 50 | 9% | 2.14 | 0.0554 |
| 4 | 50 | 7% | 1.64 | 0.1284 |
| 5 | 50 | 6% | 1.88 | 0.0869 |
| 6 | 50 | 5% | 1.22 | 0.249 |
| 7 | 50 | 6% | 1.74 | 0.1091 |
| 0 | 150 | 35% | 6.56 | <.0001 |
| 1 | 150 | 22% | 5.32 | 0.0002 |
| 2 | 150 | 11% | 2.58 | 0.0255 |
| 3 | 150 | 9% | 2.41 | 0.0347 |
| 4 | 150 | 10% | 2.54 | 0.0274 |
| 5 | 150 | 9% | 2.29 | 0.043 |
| 6 | 150 | 7% | 1.95 | 0.0773 |
| 7 | 150 | 16% | 2.62 | 0.024 |
| 0 | 300 | 45% | 10.52 | <.0001 |
| 1 | 300 | 24% | 8.08 | <.0001 |
| 2 | 300 | 19% | 7.69 | <.0001 |
| 3 | 300 | 16% | 5.88 | 0.0001 |
| 4 | 300 | 12% | 3.00 | 0.012 |
| 5 | 300 | 13% | 4.26 | 0.0013 |
| 6 | 300 | 17% | 4.70 | 0.0007 |
| 7 | 300 | 18% | 4.59 | 0.0008 |
Acknowledgments
We thank Ron Rensink, Dan Simons, Melina Kunar and Kristin Michod for comments on earlier drafts of this pape. Support was provided by a grant from the National Institute of Mental Health, MH56020.
References
- Alvarez GA, Wolfe JM, Horowitz TS, Arsenio HC. Limits on multielement tracking. 1st Annual meeting of the Vision Sciences Society; Sarasota. May 2001.2001. [Google Scholar]
- Ariely D. Seeing Sets: Representation by statistical properties. Psychological Science. 2001;12(2):157–162. doi: 10.1111/1467-9280.00327. [DOI] [PubMed] [Google Scholar]
- Brainard DH. The Psychophysics Toolbox. Spatial Vision. 1997;10:443–446. [PubMed] [Google Scholar]
- Braun J, Julesz B. Dividing attention at little cost: detection and discrimination tasks. Perception and Psychophysics. 1998;60(1):1–23. doi: 10.3758/bf03211915. [DOI] [PubMed] [Google Scholar]
- Brawn P, Snowden RJ. Can one pay attention to a particular color? Perception and Psychophysics. 1999;61(5):860–873. doi: 10.3758/bf03206902. [DOI] [PubMed] [Google Scholar]
- Chong SC, Treisman A. Representation of statistical properties. Vision Res. 2003;43(4):393–404. doi: 10.1016/s0042-6989(02)00596-5. [DOI] [PubMed] [Google Scholar]
- Danziger S, Kingstone A, Snyder JJ. Inhibition of return to successively stimulated locations in a sequential visual search paradigm. J Exp Psychol Hum Percept Perform. 1998;24(5):1467–1475. doi: 10.1037//0096-1523.24.5.1467. [DOI] [PubMed] [Google Scholar]
- Di Lollo V, Enns JT, Rensink RA. Competition for consciousness among visual events: The psychophysics of reentrant visual processes. Journal of Experimental Psychology: General. 2000;129(4):481–507. doi: 10.1037//0096-3445.129.4.481. [DOI] [PubMed] [Google Scholar]
- Dodd MD, Castel AD, Pratt J. Inhibition of return with rapid serial shifts of attention: Implications for memory and visual search. Perception & Psychophysics. 2003;65(7):1126–1135. doi: 10.3758/bf03194839. [DOI] [PubMed] [Google Scholar]
- Henderson JM, Hollingworth A. Eye movements and visual memory: detecting changes to saccade targets in scenes. Percept Psychophys. 2003;65(1):58–71. doi: 10.3758/bf03194783. [DOI] [PubMed] [Google Scholar]
- Hollingworth A, Henderson JM. Accurate visual memory for previously attended objects in natural scenes. J Exp Psychol: Human Perception and Performance. 2002;28(1):113–136. [Google Scholar]
- Hollingworth A. Constructing visual representations of natural scenes: the roles of short- and long-term visual memory. J Exp Psychol Hum Percept Perform. 2004;30(3):519–537. doi: 10.1037/0096-1523.30.3.519. [DOI] [PubMed] [Google Scholar]
- Klein RM. Inhibition of return. Trends Cogn Sci. 2000;4(4):138–147. doi: 10.1016/s1364-6613(00)01452-2. [DOI] [PubMed] [Google Scholar]
- Klein RM, MacInnes WJ. Inhibition of return is a foraging facilitator in visual search. Psychological Science. 1999 July;10:346–352. [Google Scholar]
- Logan G. Linguistic and conceptual control of visual spatial attention. Cognitive Psychology. 1995;28:103–174. doi: 10.1006/cogp.1995.1004. [DOI] [PubMed] [Google Scholar]
- Luck SJ, Vogel EK. The capacity of visual working memory for features and conjunctions. Nature. 1997;390(20v):279–281. doi: 10.1038/36846. [DOI] [PubMed] [Google Scholar]
- Mack A, Rock I. Inattentional Blindness. Cambridge, MA: MIT Press; 1998. [Google Scholar]
- Neisser U, Becklen R. Selective looking: attending to visual significant events. Cognitive Psychology. 1975;7:480–494. [Google Scholar]
- Nickerson R, Adams MJ. Long-term memory for a common object. Cognit Psychol. 1979;11:287–307. [Google Scholar]
- Noë A, Pessoa L, Thompson E. Beyond the grand illusion: What change blindness really teaches us about vision. Visual Cognition. 2000;7:93–106. [Google Scholar]
- O'Regan JK, Rensink RA, Clark JJ. Change blindness as a result of 'mudsplashes'. Nature. 1999;398:34. doi: 10.1038/17953. [DOI] [PubMed] [Google Scholar]
- Pelli DG. The VideoToolbox software for visual psychophysics: Transforming numbers into movies. Spatial Vision. 1997;10(4):437–442. [PubMed] [Google Scholar]
- Phillips WA. On the distinction between sensory storage and short-term visual memory. Perception and Psychophysics. 1974;16(2):283–290. [Google Scholar]
- Potter MC, Levy EI. Recognition memory for a rapid sequence of pictures. J Experimental Psychology. 1969;81:10–15. doi: 10.1037/h0027470. [DOI] [PubMed] [Google Scholar]
- Rensink RA, O'Regan JK, Clark JJ. To see or not to see: The need for attention to perceive changes in scenes. Psychological Science. 1997;8:368–373. [Google Scholar]
- Rensink RA. The dynamic representation of scenes. Visual Cognition. 2000;7(1):17–42. [Google Scholar]
- Rensink RA. Seeing, sensing, and scrutinizing. Vision Res. 2000a;40(10–12):1469–1487. doi: 10.1016/s0042-6989(00)00003-1. [DOI] [PubMed] [Google Scholar]
- Rensink RA. Visual search for change: A probe into the nature of attentional processing. Visual Cognition. 2000b;7:345–376. [Google Scholar]
- Shepard RN. Recognition memory for words, sentences, and pictures. J Verbal Learning and Verbal Behavior. 1967;6:156–163. [Google Scholar]
- Simons DJ. Current approaches to change blindness. Visual Cognition. 2000;7(1–3):1–15. [Google Scholar]
- Simons DJ, Chabris CF. Gorillas in our midst: sustained inattentional blindness for dynamic events. Perception. 1999;28(9):1059–1074. doi: 10.1068/p281059. [DOI] [PubMed] [Google Scholar]
- Simons DJ, Chabris CF, Schnur TT, Levin DT. Evidence for preserved representations in change blindness. Consciousness and Cognition. 2002;11:78–97. doi: 10.1006/ccog.2001.0533. [DOI] [PubMed] [Google Scholar]
- Simons DJ, Levin DT. Change blindness. Trends in Cognitive Sciences. 1997;1(7):261–267. doi: 10.1016/S1364-6613(97)01080-2. [DOI] [PubMed] [Google Scholar]
- Simons DJ, Levin DT. Failure to detect changes to people in a real-world interaction. Psychonomic Bulletin and Review. 1998;5(4):644–649. [Google Scholar]
- Snyder JJ, Kingstone A. Inhibition of return and visual search: how many separate loci are inhibited? Percept Psychophys. 2000;62(3):452–458. doi: 10.3758/bf03212097. [DOI] [PubMed] [Google Scholar]
- Sperling G. The information available in brief visual presentations. Psychological Monographs. 1960;15:201–293. [Google Scholar]
- Standing L. Learning 10,000 pictures. Quarterly J Experimental Psychology. 1973;25:207–222. doi: 10.1080/14640747308400340. [DOI] [PubMed] [Google Scholar]
- Wolfe JM. Visual search. In: Pashler H, editor. Attention. Hove, East Sussex, UK: Psychology Press Ltd; 1998. pp. 13–74. [Google Scholar]
- Wolfe JM. Inattentional amnesia. In: Coltheart V, editor. Fleeting Memories. Cambridge, MA: MIT Press; 1999. pp. 71–94. [Google Scholar]
- Wolfe JM, Bennett SC. Preattentive Object Files: Shapeless bundles of basic features. Vision Research. 1997;37(1):25–43. doi: 10.1016/s0042-6989(96)00111-3. [DOI] [PubMed] [Google Scholar]
- Wolfe JM, Friedman-Hill SR. On the role of symmetry in visual search. Psychological Science. 1992;3(3):194–198. [Google Scholar]
- Wolfe JM, Klempen N, Dahlen K. Post-attentive vision. Journal of Experimental Psychology:Human Perception & Performance. 2000;26(2):693–716. doi: 10.1037//0096-1523.26.2.693. [DOI] [PubMed] [Google Scholar]
- Wolfe JM, Klempen NL, Horowitz TS. The gist of the meaningless: Is scene recognition a type of visual search. Investigative Ophthalmology and Visual Science. 1997;38(4):S488. [Google Scholar]
- Wolfe JM, Oliva A, Butcher SJ, Arsenio HC. An Unbinding Problem? The disintegration of visible, previously attended objects does not attract attention. J of Vision. 2002;2(3):256–271. doi: 10.1167/2.3.5. [DOI] [PubMed] [Google Scholar]