SUMMARY
Structure and movement of the tongue have been studied extensively, but little has been done on its 3D deformation and ensuing volumetric changes during various functions. The purpose of this study is to investigate the volumetric changes of a regional section of the tongue during feeding. Four 12-week-old Yucatan miniature pigs were used. During natural mastication and water drinking, the width, length, thickness, and volumetric changes were measured using six implanted ultrasonic crystals, which circumscribed a wedge-shaped volume in the region of the tongue body. Jaw movements were videotaped and digitized. Signals from these two sources were synchronized to allow real-time analyses. Significant volumetric changes (p<0.001) were found in chewing, ingestion and drinking, and these changes were stereotypical in relation to rhythmic jaw movements. Volumetric change during chewing was not only more regular, but significantly larger (45.6%, p < 0.001) than that during ingestion (31.4%). The volumetric changes were less regular in drinking and the changing range (30.4%) was close to that during ingestion. Real-time analysis indicated that the volume began increasing at late jaw closing and reached the peak at late power stroke. The duration of volume increase only took up 33.4% of the total chewing cycle length, significantly shorter than that of volume decrease. Correlation analysis revealed that the change in posterior dorsal and ventral widths had the greatest positive association with volumetric change (r = 0.43) in direction. The covariance calculations further indicated that dimensional changes in length and thickness coupled negatively with volumetric changes in amplitude. These results revealed that regional volumetric change of the tongue occurs during feeding, and chewing requires larger volumetric changes than do ingestion and drinking. Volumetric expansion occurs in the phase of power stroke during chewing and is coupled with increases of widths in the direction and with decreases of thickness and length in the amplitude. The results further suggested that the regional volumetric expansion may play the determinant role in functional load production on its surrounding tissues, and may also imply that neuromuscular control of the tongue is region-specific, incompatible with traditional scheme of muscle categorization of the tongue.
Keywords: Tongue deformation, volume, ultrasound, jaw movement, mastication
Introduction
As a complex muscular organ, the mammalian tongue consists of a specialized epithelium underlain by intrinsic and extrinsic muscles. These muscles include four extrinsic muscles (genioglossus, styloglossus, palatoglossus, and hyoglossus) and four intrinsic muscles (superior longitudinal, Inferior longitudinal, transversus, and verticalis). These muscles are comprised of many segments of differently oriented fibers intermingled with each other to facilitate complicated and delicate tongue kinematics (Peter, 1995). The tongue is a vital organ involved in feeding, speech and respiration. Throughout these functions, the tongue as a whole is regarded as a “muscular hydrostat,” or a system that exerts force by contracting its three-dimensional (3D) musculature, altering its shape while keeping its volume constant (Kier and Smith, 1985; McClung and Goldberg, 2000; Wedeen et al., 2001). This system is comprised of fluid and musculature that acts to produce movement and as a skeleton. Other examples of muscular hydrostats include the elephant trunk and squid tentacle (Kier et al., 1989).
Although the muscular hydrostat theory of the tongue has been studied, little has been done on its in vivo 3D deformation and resulting regional volumetric changes during various functions. Obtaining such information has been an ongoing challenge because of the anatomical complexity and inaccessibility, and functional precision and diversity (Napadow et al., 1999a; Napadow et al., 1999b; Sawczuk and Mosier, 2001; Takemoto, 2001). Intramural kinematics of the tongue can be determined only through the use of highly specialized equipment that is capable of tracking small markers that are implanted within or secured to multiple “landmarks” on the tongue (Chen et al., 2001). Tongue motor performances are typically considered to be produced by shifts in relative activity of tongue muscles, whether sequential or coactive. However, coordinative organization of lingual movements for chewing, swallowing, and speech are poorly understood.
According to the muscular hydrostat theory of tongue control, the constant volume of the tongue is achieved by deforming or displacing in various regions and dimensions via contractions of highly defined intrinsic and extrinsic tongue muscles (Kier and Smith, 1985). Although the entire tongue is incompressible, a volumetric change deriving from independent motor control of regions may occur to allow its diverse functions to be accomplished (Hiiemae and Palmer, 2003; Slaughter et al., 2005). Therefore, the distance changes (elongation or shortening) of various dimensions (width, length and thickness) in this region may not be parallel or compensatory each other. This issue has not been explored or discussed in the literature. By using the novel technology of digital microsonometrics, the present study was to record 3D deformation occurring inside the tongue during natural mastication and drinking. With these changing distances between multiple pairs of ultrasonic transmitters/receivers (i.e., peizo-electronic crystals) that represent various dimensions, regional volumetric changes in the body of the tongue were calculated dynamically. We hypothesized that the tongue experiences periodic and rhythmic volumetric changes in regions and these changes are function/behavior-specific. We further hypothesized that these regional volumetric changes are related to specific 3D deformational patterns and jaw movement phases.
Materials and Methods
Animals
Four 12-week-old Yucatan miniature pigs were obtained from Sinclair Research Center (Columbia, MO). They were 2 males and 2 females with the mean body weight of 13.5Kg (11.7–15.0 Kg). The pigs were acclimated to the experimental environment through 3-5 days of daily training during which the pig was fed on a feeding table by wearing a neck collar where mock recording devices were placed. A 24-hour starvation was applied before the recording day. The University of Washington Institutional Animal Care and Use Committee approved all procedures.
Device placement
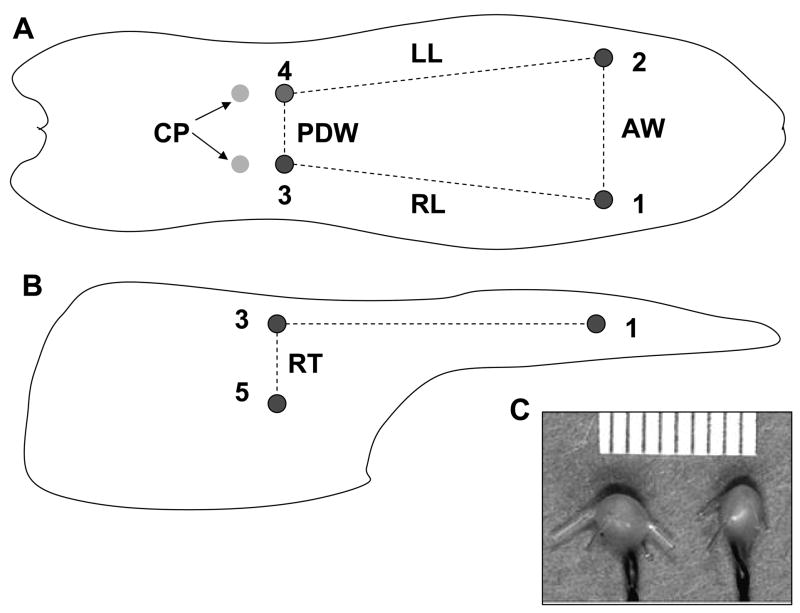
The pigs were placed under anesthesia using isoflurane and nitrous through the nostrils. A mouth opener was used to keep the jaw open at 35–40 mm. The tongue was then pulled forward to expose the circumvallate papillae. Six 2-mm ultrasonic crystals with B-bards (Sonometric Co., London, Ontario, Canada), which function as tiny transducers that transmit and receive ultrasonic signals between pairs, were brought into the proper oral cavity through an incision in the submandibular region, and were surgically implanted into the tongue body to circumscribe a wedge-shaped configuration for a 3D deformational recordings (length, width and thickness) and volume calculations (Fig. 1C). This configuration provided the distance changes in the following dimensions available in the circumscribed region (Fig. 1A and B): anterior width (AW), posterior (base) dorsal and ventral widths (PDW and PVW), bilateral body lengths (LL and RL), and bilateral base thickness (LT and RT). In addition, two florescent markers were glued to the upper and lower lips forming two linear segments parallel to the occlusal plane for jaw movement tracking (Fig. 2). Jaw movement videotaping was also taken before the implantation of crystals to examine if the implantation interfered with normal jaw movement. The pig was euthanized after completion of all recordings, and the tongue was dissected. The accuracy of implanted crystal sites was checked, and direct measurements of tongue volume and weight were performed using the water displacement method and a digital scale respectively.
Fig. 1.
Array of implanted crystals. A: dorsal view of crystal sites; B: sagittal view (right) of crystal sites; C: a pair of ultrasonic crystals. Two crystals (1 and 2) were embedded 15mm posterior to the tongue tip, two others were implanted 5 mm anterior to each circumvallate papilla (CP, 3 and 4), and the last two (5 and 6) were at a depth of 10–15 mm to 3 and 4. Dashed lines indicate measured dimensions. AW (1–2): anterior width; LL: left length (2–4); RL: right length (1–3); PDW: posterior dorsal width (3–4); RT: right thickness (3–5). Please note that posterior ventral width (PVW, 5–6) and left thickness (LT, 4–6) are not shown in this drawing.
Fig. 2.
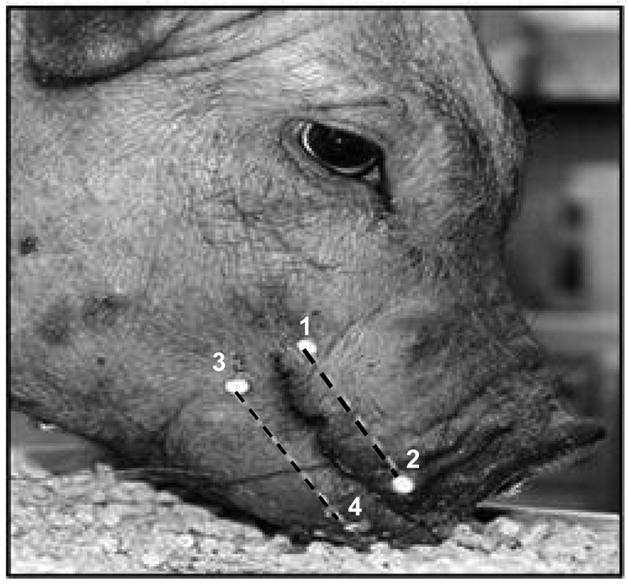
Jaw marker locations. Four fluorescent markers (dots) were glued onto upper and lower lips to form two segments parallel to the occlusal plane. The dashed lines connecting 1–2 and 3– 4 represent upper and lower segments, respectively. The gape of these two segments during chewing was calculated through digitization of videotaping images.
Data collection and analysis
The pigs were allowed to gain consciousness and were offered chow pellets. During natural mastication sequences, ingestion which was not including transitional episode (less or not stereotypical cycles) between ingestion and chewing, and chewing cycles were identified by direct visualization of the feeding process and marked online (Shcherbatyy and Liu, 2007). Water was also offered through a clear glass container during or after masticatory sequences to record drinking sequences. Signals from each crystal pairs were recorded at the sampling frequency of 252Hz through a SonoLAB system (TRX Series 8, Sonometric Co.). Jaw movement was videotaped using a digital video camcorder (NTSC 2R50MC, Sony Co. Tokyo, Japan) through a Motus system (Vicon/Peak, Co., Centennial, CO). To allow for real-time analysis, an Event & Video Control and an Analog to Digital (A/D) Interface units (Vicon/Peak) were used to synchronize sonomicrometric signals with jaw movement images.
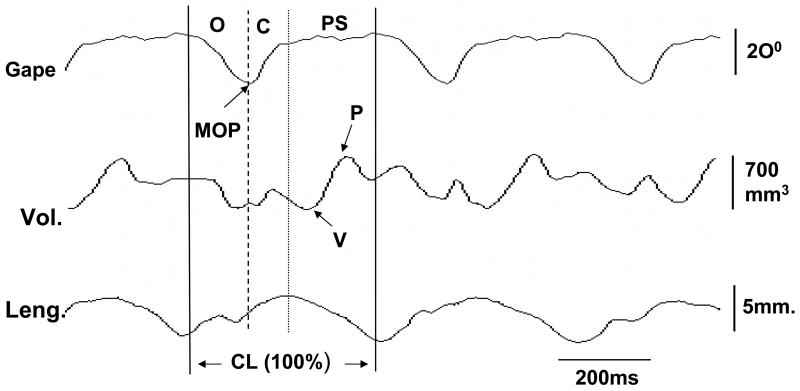
The Euclidean distance between crystal pairs was calculated using the SonoVIEW to obtain linear deformational changes in each dimension after low-pass filtered at 30Hz. These dimensional data were further used to make a 3D image reconstruction using SonoXYZ program. Then, a specific software, SonoVOL (Sonometric Co), was applied, which uses the XYZ coordinates and 3D reconstruction to calculate the actual volume at each time point sampled. Overall, 8–10 ingestion and 20–30 chewing cycles from 2–3 masticatory sequences, and 10–15 drinking cycles were analyzed for each animal. The baseline volume was defined before the pig awoken fully by directly visualizing that there were no visible movements of jaw and tongue. From each chewing, ingestion or drinking cycle, the difference between maximum (peak) and minimum (valley) for the volumes were measured. The time durations from valley to peak (volume increase) and from peak to valley (volume decrease) were calculated as well (Fig. 3).
Fig. 3.
Methods for Jaw movement and microsonometric data analyses. Jaw movements were synchronized with the signal outputs from the ultrasonic crystals to allow for real-time analysis._Solid, dashed and dotted lines indicate the starts of jaw opening, jaw closing and power stroke (occlusal) phases, respectively. Two solid lines define one chewing cycle length (CL) and represent 100% for all timing calculations. Gape: degree of jaw opening; Vol: volumetric measurement; Leng: length measurement. O: jaw opening phase; C: jaw closing phase; PS: power stroke; MOP: maximal jaw opening; P: peak, V: valley. Arrows indicate maximal opening of jaw movement, and peak (maximum) and valley (minimum) of volumetric changes.
Jaw movement images were digitized by using the 4 glued fluorescent markers. The beginning of jaw opening, maximum opening (beginning of jaw closing), and the beginning of power stroke (occlusal phase) were marked as events for each chewing cycle. The details about identification of these jaw movement events were published elsewhere (Kayalioglu et al., 2007). The frequency of chewing was defined by jaw movement digitalization from the beginning of jaw opening to that of the next cycle (Fig. 3). Thus, all durations were converted to % of cycle length to avoid the variation of cycle length across the time and in animals.
To better understand the spatiotemporal coupling between dimensional and resultant volumetric changes, a correlation analysis was applied to the 4–10s extracted chewing wave data containing both distance of the paired crystals and volumetric changes. On selected crystal pairs, correlation coefficients (positive or negative) were computed between the Euclidean distance and volumetric signals. Because pigs chew alternately in sides (Liu and Herring, 2000), chewing side of the collected data were assumed to distribute evenly in the left and right sides. Thus, bilateral lengths and thicknesses were combined before the analysis. As a result, 5 correlations were computed, i.e., three widths to volume (AW × Vol, PDW × V, and PVW × Vol), and length and thickness to volume (LENG × Vol and THICK × Vol). Correlations approaching 1 or near 0 represented strongly or weakly coupled dimensional and volumetric changes, respectively; whereas, correlations approaching -1 represented strong, negatively coupled dimensional and volume changes; that is, an increase in a given dimension coincided with a decrease in volume, or vice versa.
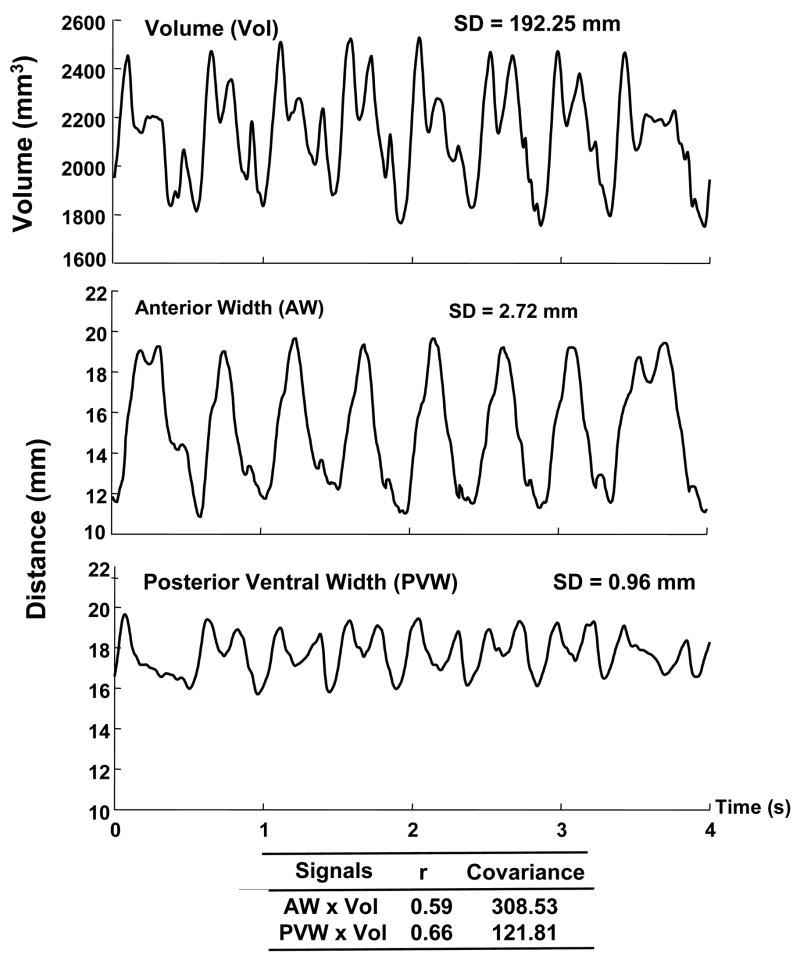
Because the correlation-based analysis was inherently normalized to signal amplitude, the contribution of each dimensional change to overall volumetric change could not be determined. Therefore, the covariance between the Euclidean distance time histories (the 3D distance between a pair of crystal as a function of time) associated with above-mentioned 5 correlations were also calculated (Fig. 4). Conceptually, the covariance is a bivariate correlation (r) that is weighted by the amplitude of each signal (Green and Wang, 2003). Specifically, for each dimensional change and volume comparison, the covariance was the correlation between the signal pairs times the standard deviation of each signal. Therefore, the covariance provides a quantitative means to examine patterns of functional dependence between individual dimensional and resultant volumetric changes across multiple chewing cycles. A relatively high positive or negative covariance value suggests that the selected dimensional change is contributing significantly to volumetric changes. Due to the limit of sample size, correlation analysis and covariance calculations were only performed on chewing cycles.
Fig. 4.
To quantify the contribution of dimensional changes (as represented by the distance between each crystal pair) to tongue volume changes, covariance was computed between each distance and volume time-histories. The time-histories for the volume (Vol), anterior width (AW), and posterior ventral width (PVW) for a single masticatory sequence from the pig #1 are displayed in the top, middle, and bottom panels, respectively. The figure shows that the magnitude of change in distance was greater for AW than it was for PVW (SD = 2.72 vs 0.96, respectively), but the coupling between each crystal pair and volume were similar (rAW × Vol = 0.59 and rPVM × Vol = 0.66). Consequently, the covariance was much larger for AW than for PVW. In contrast to the correlation analysis, the covariance analysis provided a means to distinguish between dimensions that exhibited small distance changes during chewing from those that exhibited large ones; presumably, dimensions with large distance changes would contribute more to volumetric changes than those with small distance change.
Statistics
Data were averaged across feeding sequences for each animal and dimensional or volumetric change. Because data were distributed asymmetrically, nonparametric Mann–Whitney U tests were used to examine the differences of volumetric changes between chewing and ingestion and between durations of volumetric increase and decrease. The differences of 5 correlations were examined by Kruskall-Wallis H test, followed by Mann-Whitney U tests. Significance level was set at p < 0.05. Bonferroni adjustment was applied to set up the significant level for multiple pair-wise comparisons following Kruskall-Wallis H test.
Results
No difference of jaw movement was found before and after crystal implantation. Postmortem measurements on the tongue sizes indicated that the averages of volume and weights were 7,525 ± 355 mm3 and 74.05 ± 5.11g, respectively.
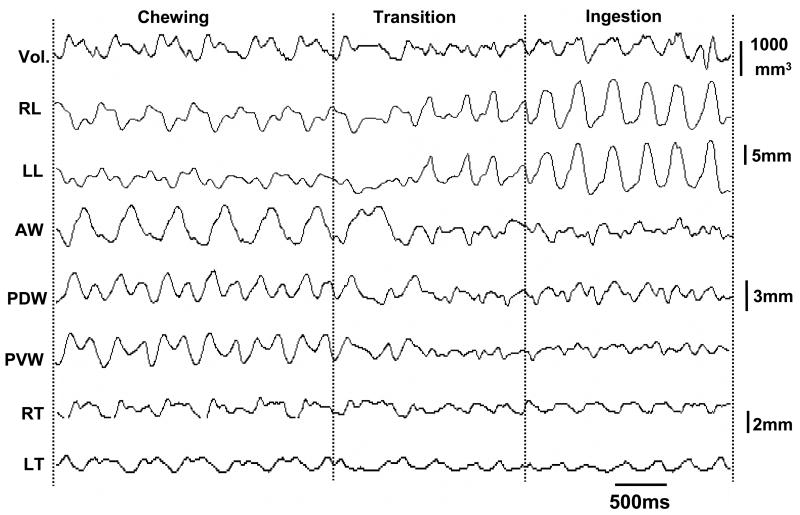
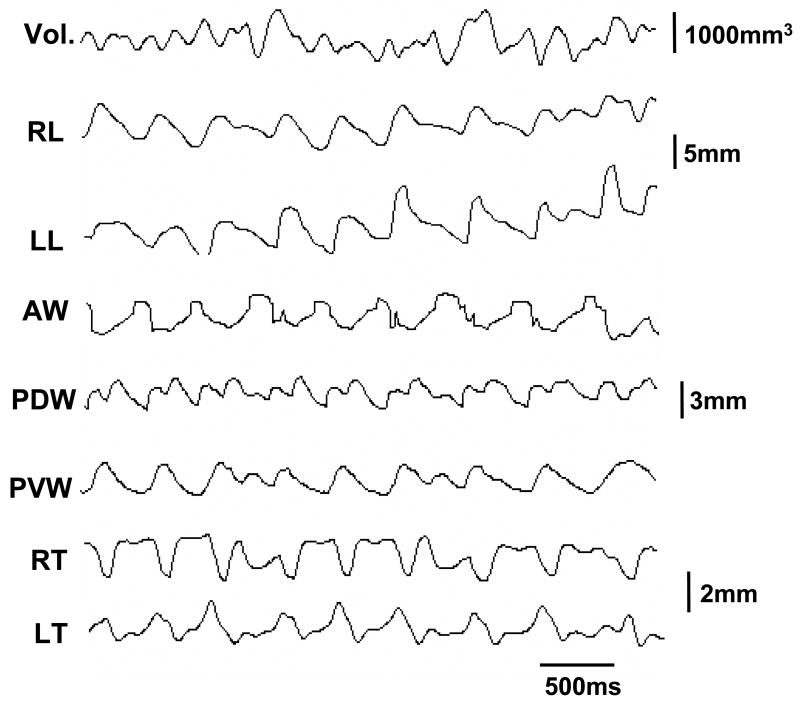
All 4 animals ate pig chow vigorously, but only one animal was willing to drink water under experimental setting. Stereotyped and rhythmic volumetric changes, which significantly differed from the baseline volume (p < 0.001), were found during both chewing and ingestion episodes, similar to dimensional changes described elsewhere (Shcherbatyy and Liu, 2007). Waves of volumetric change were more regular during chewing than during ingestion (Fig. 5). Quantitative analysis further indicated that the range of volumetric changes relative to the baseline volume during chewing was significantly larger than those during ingestion (45.6% ± 20.4% vs 31.4% ± 18.3%, p < 0.01).
Fig. 5.
Raw tracing of masticatory sequence composed of chewing, transitional and ingestions episodes denoted by dotted lines. Refer to Figs. 1 and 3 for all captions.
Although the stereotypical nature remained during drinking, the waves of volumetric changes were less regular in both rhythm and amplitude compared to those during chewing and ingestion (Fig. 6). The range of volumetric changes during drinking (30.4% ± 13.5) was close to that during ingestion, but the quantitative comparison was not available due to limited data source.
Fig. 6.
Raw tracing of drinking sequence. Refer to Figs. 1 and 3 for all captions.
Time relationship between volumetric changes and jaw movements during chewing indicates that volume began increasing at the middle-late of jaw closing phase and reaching the maximum at the middle of power stroke. The duration of volume increase only took up 33.4% ± 3.50% of the total chewing cycle length, significantly shorter than that of volume decrease (p < 0.001, Fig. 7)
Fig. 7.
Time relationship between volumetric change and three phases of jaw movement during chewing. Left error bar indicates one standard deviation (SD) of time difference between start of volumetric increase and start of jaw opening, and right error bar indicate one SD of duration of volumetric increase. Please note that the duration of volumetric increase is much shorter than that of volumetric decrease.
As demonstrated in Tab. 1, the ranges of both correlation coefficient and covariance values differed considerably across various dimensions in relation to the volume. The largest coefficients (r = 0.43) were found in both dorsal and ventral widths to volume (PDW × Vol and PVW × Vol), indicating that linear changes in these two widths were positively associated with volumetric changes in overall direction. On the contrary, both length and thickness showed a weak, negative association (r = −0.13) with volumetric changes (LENG × Vol and THICK × Vol), significantly smaller than those of three widths to volume. However, Covariance values were significantly smaller in both PDW × Vol and PVW × Vol compared to that of anterior width to volume (AW × Vol). Both LENG × Vol and THICK × Vol showed larger negative covariance values, particularly in LENG × Vol, indicating that the lengthening in tongue body and thickening in tongue base were negatively coupled with volumetric expansion in amplitude (Figs. 4 and 5).
Discussion
Owing to its highly aqueous content, the tongue tissue is effectively incompressible, and thus it maintains the ability to deform without altering tissue volume as a whole. Therefore, the tongue maintains a constant volume as it changes shape (Kier and Smith, 1985). The results from various studies have supported the theory that when the muscular arrangement in the tongue causes a contraction (decrease) in one dimension, the change in shape will be translated into an expansion (increase) in other dimension. For example, a decrease in thickness is compensated for the elongation during food capturing in the frog tongue and swimming in cuttlefish fin (Kier et al., 1989; Nishikawa et al., 1999). However, this theory is only applicable provided the entire tongue and dimension are taken into account. In fact, tongue motor control is far beyond the whole muscle level, i. e., tongue retrusor (styloglossus) or protrusor (genioglossus) (Odeh et al., 1995), as coactivation of these muscles including tongue intrinsic muscles, and selective activation of muscle fibers from a single tongue muscle (genioglossus) often occur during function (Bailey and Fregosi, 2004; Fuller et al., 1999; Kayalioglu et al., 2007; Tsuiki et al., 2000). These region-specific and behaviorally contingent muscle elongations or shortenings may not fit with the hydrostat theory. The present study did find that the tongue volume changed regionally during all three feeding behaviors: chewing, ingestion and drinking. These volumetric changes are greater during chewing than during ingestion and drinking. As anticipated, this regional volumetric expansion during chewing, resulting from widening of body and base, shortening of body length and thinning of base (Fig. 5), mainly occurred in the power stroke phase of jaw movement (Fig. 7). Such a regional volumetric expansion of the tongue may play a critical role for positioning the food onto molar surfaces and/or squeezes the food against the hard palate for grinding. Therefore, it could be inferred that this kind of regional volumetric expansion is a major force source producing masticatory loads on tongue-surrounding tissues, such as premaxilla, palate and alveolar processes (Liu et al., 2007). Smaller volumetric expansion during ingestion and drinking than chewing may further demonstrate that these feeding behaviors generate lesser loads.
The constant volume of the tongue during function is achieved by deforming or displacing in various regions and dimensions via contractions through a compensating pattern, i. e., the loss in one whole dimension accompanying a gain of the other whole dimension. However, according to the theory of region-independent motor control of the tongue (Hiiemae and Palmer, 2003; Slaughter et al., 2005), the scenario that one dimension of the tongue compensates for the other dimension or the loss of one dimension is parallel to the gain of other dimension may not really occur. The present findings indicated that a sequential elongation or shortening of various dimensions (width, length and thickness) in a region was not actually parallel to or compensatory for each other, and one dimension may change more than the other. The correlation analyses between dimensional and volumetric changes during chewing clearly showed that the volume expansion were strongly associated with widening of tongue base, both dorsal and ventral, but loosely with tongue body lengthening and base thickening (Tab. 1). Therefore, change in base widths should contribute much more to the volume if only the changing direction, rather than amplitude, is taken into consideration. In other word, widening of tongue base accompanies volume expansion during chewing. The covariance analyses further demonstrated that if the overall changes in amplitudes of various dimensions and resulting volume are counted, thinning of the tongue base and shortening of tongue body length are two biggest contributors to volumetric expansion during chewing. In other word, distance time histories (amplitude changes) of these two dimensions (base thickness and body length) and volume are tightly coupled in an opposite direction (Tab. 1).
Assuming the overall shape of the tongue follows these regional dimensional changes during chewing, the estimated tongue shapes during three stages of chewing is sketched in Figure 8. Compared to the overall shape during jaw opening phase (Fig. 8a), elongation in the body, narrowing in the width and thickening in the base are main deformations during jaw closing phase (Fig. 8b). During power stroke, the tongue extensively widens and shortens, along with thinning in the base (Fig. 8c). Taking these dimensional and volumetric changes together, it can be concluded that increases in the widths are greater than decreases in the length and thickness, which, when combined, are most likely responsible for volumetric expansion during power stroke. On the other hand, decreases in the widths and length are greater than the increase in the thickness which combination is most likely responsible for volumetric contraction during jaw closing.
Fig. 8.
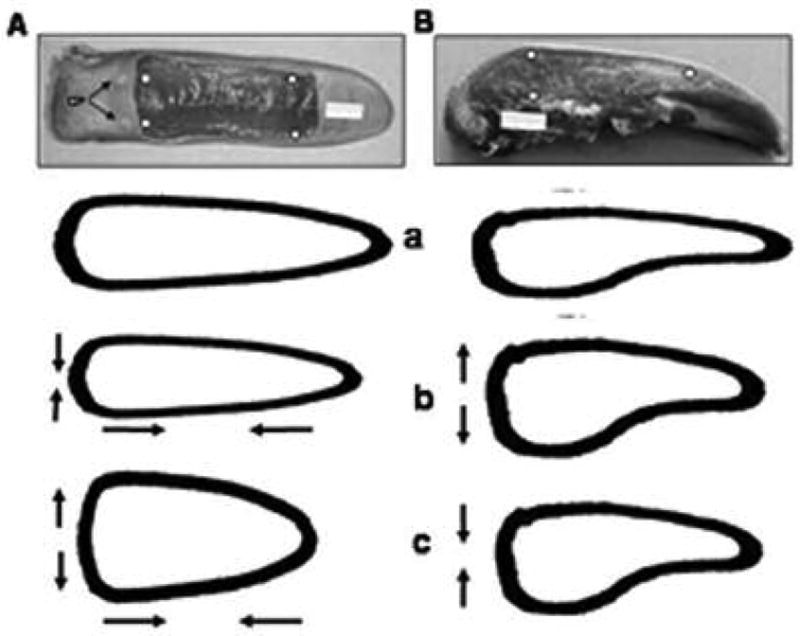
The estimated overall tongue shape in relation to three jaw movement phases during chewing. A column: dorsal view; B column: sagittal (right-side) view. White dots indicate sites of ultrasonic crystal implantation. a: jaw opening; b: jaw closing; c: power stroke. Arrows indicate the direction of dimensional changes.
Although the technique used for the current study is novel and the results are promising, there are some limitations. First, dimensional and volumetric changes were only measured in one region with no comparison between regions, thus the theory of region-independent motor control of the tongue could not be really tested by the present results. Second, the sonomicrometric technique is only able to measure linear deformations of the tongue, whereas bending and twisting are also major components of tongue deformations. Third, variations of the initial distances for each crystal pair might affect the precise evaluations for contributions of various dimensional changes to volumetric changes in amplitude through covariant calculation, because a larger initial distance of a crystal pair might be related to a larger standard deviation of a given signal. Lastly, the volumetric reconstruction can only be realized when all six crystals are operational during recording. This restriction resulted in the limited sample size (4 of eight) of the present study because the fail or malfunction of one or two crystals happened frequently.
In summary, the present study suggests that although the tongue is recognized as a muscular hydrostat model with constant volume, regional volumetric changes occur during all three feeding behaviors, and these changes are stereotypical in relation to rhythmic jaw movement. Volumetric changes are greater during chewing than ingestion and drinking. Volumetric expansion occurs in the phase of power stroke during chewing and is coupled with increases of widths in the direction and with decreases of thickness and length in the amplitude. The regional volumetric expansion of the tongue meets the functional demand and may play the determinant role in functional load production on its surrounding tissues.
Acknowledgments
The authors thank Dr. Mustafa Kayalioglu and Ms. Xian-Qin Bai for help with experiment. This study was funded by NIH grants R01DE15659 to ZJL and T32DE007132 to ZJL/BY.
Footnotes
A portion of this study was presented at the 85th General Session of the International Association for Dental Research (IADR), New Orleans, USA, March 21–24, 2007.
References
- Bailey EF, Fregosi RF. Coordination of intrinsic and extrinsic tongue muscles during spontaneous breathing in the rat. J Appl Physiol. 2004;96(2):440–449. doi: 10.1152/japplphysiol.00733.2003. [DOI] [PubMed] [Google Scholar]
- Chen Y, Barron JL, Taves DH, Martin RE. Computer measurement of oral movement in swallowing. Dysphagia. 2001;16(2):97–109. doi: 10.1007/PL00021292. [DOI] [PubMed] [Google Scholar]
- Fuller DD, Williams JS, Janssen PL, Fregosi RF. Effect of co-activation of tongue protrudor and retractor muscles on tongue movements and pharyngeal airflow mechanics in the rat. J Physiol. 1999;519(Pt 2):601–613. doi: 10.1111/j.1469-7793.1999.0601m.x. [DOI] [PMC free article] [PubMed] [Google Scholar]
- Green JR, Wang YT. Tongue-surface movement patterns during speech and swallowing. J Acoust Soc Am. 2003;113(5):2820–2833. doi: 10.1121/1.1562646. [DOI] [PMC free article] [PubMed] [Google Scholar]
- Hiiemae KM, Palmer JB. Tongue movements in feeding and speech. Crit Rev Oral Biol Med. 2003;14(6):413–429. doi: 10.1177/154411130301400604. [DOI] [PubMed] [Google Scholar]
- Kayalioglu M, Shcherbatyy V, Seifi A, Liu ZJ. Role of tongue intrinsic and extrinsic muscles in feeding: electromyographic study in pigs. Arch Oral Biol. 2007;52:786–796. doi: 10.1016/j.archoralbio.2007.01.004. [DOI] [PMC free article] [PubMed] [Google Scholar]
- Kier WM, Smith KK. Tongues, tentacles and trunks: the biomechanics of movement in muscular-hydrostats. Zool J Linn Soc. 1985;83:307–324. [Google Scholar]
- Kier WM, Smith KK, Miyan JA. Electromyography of the fin musculature of the cuttlefish Sepia officinalis. J Exp Biol. 1989;143:17–31. doi: 10.1242/jeb.143.1.17. [DOI] [PubMed] [Google Scholar]
- Liu ZJ, Herring SW. Masticatory strains on osseous and ligamentous components of the temporomandibular joint in miniature pigs. J Orofac Pain. 2000;14(4):265–278. [PubMed] [Google Scholar]
- Liu ZJ, Shcherbatyy V, Perkins JA. Functional loads of the tongue and consequence of the volume reduction. J Oral Maxillofac Surg. 2007 doi: 10.1016/j.joms.2007.11.005. accepted. [DOI] [PMC free article] [PubMed] [Google Scholar]
- McClung JR, Goldberg SJ. Functional anatomy of the hypoglossal innervated muscles of the rat tongue: a model for elongation and protrusion of the mammalian tongue. Anat Rec. 2000;260(4):378–386. doi: 10.1002/1097-0185(20001201)260:4<378::AID-AR70>3.0.CO;2-A. [DOI] [PubMed] [Google Scholar]
- Napadow VJ, Chen Q, Wedeen VJ, Gilbert RJ. Biomechanical basis for lingual muscular deformation during swallowing. Am J Physiol. 1999a;277(3 Pt 1):G695–701. doi: 10.1152/ajpgi.1999.277.3.G695. [DOI] [PubMed] [Google Scholar]
- Napadow VJ, Chen Q, Wedeen VJ, Gilbert RJ. Intramural mechanics of the human tongue in association with physiological deformations. J Biomech. 1999b;32(1):1–12. doi: 10.1016/s0021-9290(98)00109-2. [DOI] [PubMed] [Google Scholar]
- Nishikawa KC, Kier WM, Smith KK. Morphology and mechanics of tongue movement in the African pig-nosed frog Hemisus marmoratum: a muscular hydrostatic model. J Exp Biol. 1999;202(Pt 7):771–780. doi: 10.1242/jeb.202.7.771. [DOI] [PubMed] [Google Scholar]
- Odeh M, Schnall R, Gavriely N, Oliven A. Dependency of upper airway patency on head position: the effect of muscle contraction. PG - 239–44. Respir Physiol. 1995;100(3):239–244. doi: 10.1016/0034-5687(94)00135-m. [DOI] [PubMed] [Google Scholar]
- Peter LW. Alimentary system. In: Lawrence HB, editor. Gray's Anatomy. Churchill Livingstone; New York: 1995. pp. 1721–1724. [Google Scholar]
- Sawczuk A, Mosier KM. Neural control of tongue movement with respect to respiration and swallowing. Crit Rev Oral Biol Med. 2001;12(1):18–37. doi: 10.1177/10454411010120010101. [DOI] [PubMed] [Google Scholar]
- Shcherbatyy V, Liu ZJ. Internal kinematics of the tongue during feeding in pigs. Anat Rec. 2007 doi: 10.1002/ar.20582. in press. [DOI] [PMC free article] [PubMed] [Google Scholar]
- Slaughter K, Li H, Sokoloff AJ. Neuromuscular organization of the superior longitudinalis muscle in the human tongue. 1. Motor endplate morphology and muscle fiber architecture. Cells Tissues Organs. 2005;181(1):51–64. doi: 10.1159/000089968. [DOI] [PubMed] [Google Scholar]
- Takemoto H. Morphological analyses of the human tongue musculature for three-dimensional modeling. J Speech Lang Hear Res. 2001;44(1):95–107. doi: 10.1044/1092-4388(2001/009). [DOI] [PubMed] [Google Scholar]
- Tsuiki S, Ono T, Ishiwata Y, Kuroda T. Functional divergence of human genioglossus motor units with respiratory-related activity. Eur Respir J. 2000;15(5):906–910. doi: 10.1034/j.1399-3003.2000.15e16.x. [DOI] [PubMed] [Google Scholar]
- Wedeen VJ, Reese TG, Napadow VJ, Gilbert RJ. Demonstration of primary and secondary muscle fiber architecture of the bovine tongue by diffusion tensor magnetic resonance imaging. Biophys J. 2001;80(2):1024–1028. doi: 10.1016/S0006-3495(01)76081-X. [DOI] [PMC free article] [PubMed] [Google Scholar]


