

Abstract
Background
We assessed the expression of Matrix Metalloproteinase (MMP) to E-cadherin (M/E ratio) to determine the correlation of gene expression with pathologic variables and outcome in a cohort of African American (AA) prostate cancer patients.
Methods
Tumors from formalin-fixed, paraffin embedded RP specimens were examined. Gleason scores were 6, 7, and ≥8 in 7, 16, 13 tumors respectively. Pathologic stage was organ confined (pT2) in 18 and advanced (> pT2) in 18 tumors. A colorimetric mRNA insitu hybridization ( ISH ) assay was performed using biotinylated anti-sense oligonucleotide probes for MMP 2 and 9, as well as for E-cadherin gene transcripts. Immunohistochemistry (IHC) was performed utilizing specific monoclonal antibodies to detect the above genes. Image analysis was performed to determine the intensity of both mRNA and protein expression. Two reviewers analyzed ISH gene expression independently.
Results
The M/E expression ratio was significantly increased at the invasive edge (but not the center) of tumors of higher Gleason score (p=0.02 and 0.0008) and pathologic stage (p=0.0001 and <0.0001) when examined by both ISH and IHC. Significant variability in ISH staining interpretation was noted within and among the two study reviewers. An M/E ratio > 2.5 was associated with biochemical recurrence after radical prostatectomy in addition to tumor pathologic stage subsequent to univariate statistical analysis.
Conclusions
The M/E ratio characterizes an important aspect of the molecular phenotype associated with the histologic progression of prostate cancer among African American prostate cancer patients. A larger comparative study is required to determine potential racial variation and prognostic significance of gene expression.
Keywords: prostate cancer, matrix metalloproteinase, E-cadherin, African American, radical prostatectomy
Introduction
It is estimated that over 27,000 American men will die of prostate cancer in the current year [1]. Of these men, African American (AA) men are proportionately the most severely affected. To what extent differences observed between races with regard to prostate cancer incidence and mortality can be attributed to socioeconomic or biological factors remains controversial. Autopsy reports have shown a higher incidence and a higher grade of prostate intraepithelial neoplasia in African American men compared to an age-adjusted cohort of Caucasian (Cau) men, suggesting that biological differences in tumorigenesis may exist between these racial groups [2]. For example, data derived from analyses of radical prostatectomy (RP) specimens of AA men have demonstrated a higher incidence of peripheral zone and transition zone tumors in this patient population than has been demonstrated in Cau patients [3–4]. In addition, several groups, including our own, have found that AA patients have higher volume tumors than Cau patients with a similar stage of disease [5–6]. Such differences in tumor biology may be explained by differences in the androgen signaling pathways that exist between these races, including serum testosterone and dihydrotestosterone levels, 5-alpha reductase isoenzyme activity, testosterone biosynthesis or degradation pathways, androgen receptor (AR) levels, and trinucleotide repeats affecting AR signaling [7–15]. As well, African American men have been shown to have lower levels of insulin-like growth factor (IGF) binding protein 3, which may increase the bioavailability of IGF-1 to increase its mitogenic potential [16–18].
We previously characterized several genes involved in early events of prostate cancer progression by characterizing the invasive and angiogenic capacities of human prostate cancer first in animal models and then in patient specimens [19–23]. The mRNA expression levels of matrix metalloproteinase (MMP), E-cadherin, and vascular endothelial growth factor (VEGF) in RP specimens were assessed by in situ hybridization (ISH) in archival specimens of Cau patients [23]. Increasing expression of MMP and VEGF with decreasing expression of E-cadherin in the specimens characterized the histologic progression of the disease in the prostate with respect to grade and pathologic stage [23]. In addition, we observed significant intratumoral heterogeneity of gene expression as MMP expression increased at the invasive edge of tumors and in the same location where E-cadherin mRNA expression decreased. The relative ratio of MMP-2 + MMP-9 to E-cadherin (the M/E ratio) detected by ISH was an excellent marker for the metastatic potential of prostate cancer and was the strongest factor differentiating organ-confined disease from advanced disease [23]. More recently, we found that the M/E ratio in pre-therapy biopsy specimens correlated with RP stage and was the strongest pre-therapy predictor of pathologic stage in matched RP and biopsy specimens from a cohort of Cau and Japanese patients [24].
In the present study, we extended our previous observations by assessing the M/E ratio in RP specimens from AA patients to determine whether mRNA expression is associated with histologic aggressiveness. Furthermore, using the same specimen, we assessed: 1) the interobserver variability in gene expression; 2) the correlation of mRNA and protein expression; and 3) whether gene expression correlates with disease outcome in a cohort of AA patients undergoing RP.
Materials and Methods
Patient Characteristics and Histopathology
We reviewed formalin-fixed, paraffin-embedded RP specimens from 36 AA patients who had undergone surgery at The University of Texas M. D. Anderson Cancer Center from January 1994 to December 2002. These patients had not undergone any previous treatment. The specimens were grossed according to a previously described method [25–26]. Tissue sections (4 μm) were examined, and the tumor focus of highest Gleason score and highest pathologic stage was selected. Tumor foci included 36 peripheral zone tumors in the 36 RP specimens. Pathologic stage was assigned using the 1997 tumor-node-metastasis (TMN) staging system: pT2 = organ-confined cancer, pT3a = extraprostatic extension, and pT3b = seminal vesicle invasion [27]. Because all patients with pelvic lymph node metastasis at surgery had extraprostatic extension in the primary tumor, they were assigned a pT3a (or b), N+ stage.
For the purposes of data analysis, pathologic stage was simplified by expressing organ-confined tumors as pT2 and those with extraprostatic extension, seminal vesicle invasion, or positive lymph nodes as > pT2. Clinical stage was assigned using the 1992 TNM staging system [28]. Serum PSA levels were assessed using the Tosoh AIA assay (Tosoh Medics, Inc., Foster City, California). The use of radiologic imaging studies varied by physician; however, a bone scan was usually obtained in patients with a serum PSA level > 10 ng/mL and computed tomography scans of the abdomen and pelvis for those with a serum PSA level > 20 ng/mL or a Gleason score ≥ 8.
Post-RP serum PSA levels were obtained at 6–8 weeks to determine whether an undetectable nadir (< 0.1 ng/mL) was achieved. Patients were then followed according to their physician’s preference; however, serum PSA levels were routinely obtained at 4- to 6-month intervals during follow-up years 1–5 and at 6- to 12-month intervals thereafter. Disease recurrence was defined as two successive rises in serum PSA level above an undetectable nadir or a confirmed serum PSA level ≥0.2 ng/mL.
Oligonucleotide Probes
Specific antisense oligonucleotide DNA probes were designed and synthesized as previously reported [23–24]. The sequences and working dilutions of the probes were as follows: (a) MMP-9, 5′-CCG GTC CAC CTC GCT GGC GCT CCG GA-3′ (1:100); (b) MMP-2, 5′-GGC CAC ATC TGG GTT GCG GC-3′ (1:100); and (c) E-cadherin, mixture of 5′-TGG AGC GGG CTG GAG TCT GAA CTG-3′ (1:100) and 5′-GAC GCC GGC GGC CCC TTC ACA GTC-3′ (1:100). A poly dT20 oligonucleotide was used to verify the integrity of mRNA in each sample [29–30]. The lyophilized probes were reconstituted to a 2 μg/μL stock solution in 10 mM Tris HCl (pH 7.6) and 1 mM EDTA. The stock solution was diluted with Probe Diluent (Research Genetics, Huntsville, AL) immediately before use.
In situ Hybridization
ISH was performed according to the manual Microprobe staining system (Fisher Scientific, Pittsburgh, PA) [23–24]. Briefly, paraffin-embedded specimens were mounted on silane-coated Probe On slides (Fisher Scientific). The slides were placed in the Microprobe slide holder, dewaxed, and dehydrated, followed by digestion with pepsin. Hybridization of the probe was performed for 60 min at 45°C, and the samples were then washed 3 times with 2 × SSC for 2 min at 45°C. The samples were incubated in alkaline phosphatase-labeled avidin for 30 min at 45°C, rinsed with alkaline phosphatase enhancer (Biomeda Corp., Foster City, CA) for 1 min, and incubated with chromogen substrate Fast Red (Biomeda Corp.) for 20 min at 45°C. A positive reaction in this assay stained red. To check the specificity of the hybridization signal, the following controls were used: 1) a biotin-labeled sense probe and 2) a competition assay with unlabeled antisense probe. A markedly decreased or absent signal was obtained under the above conditions [23–24].
Immunohistochemistry
Paraffin-embedded specimens were mounted on positively charged Super Frost slides (Fisher Scientific). Slides were heated at 65°C for 30 min, de-paraffinized in xylene, hydrated in graded ethanol [100%, 95%, and 80% ethanol/ddH2O (v/v)], and then rehydrated in phosphate-buffered saline (PBS, pH 7.5). Antigen retrieval was performed in 0.1 M citrate buffer in a steamer for 20 min and cooled to 20°C. Endogenous peroxidase was blocked with 3% hydrogen peroxide in PBS. Samples were then exposed to nonspecific protein blocking solution (5% normal horse serum and 1% normal goat serum in PBS) and incubated with each primary antibody at the appropriate dilution at 4°C overnight. Antibodies utilized included rabbit anti-human polyclonal MMP2 (Chemicon, Temecula, CA) 1:100, rabbit anti-human polyclonal MMP9 (Chemicon) 1:100, and mouse anti-human monoclonal E-cadherin 1:50 (ZymMed Laboratories, Inc., South San Francisco, CA).
Slides were then washed and incubated for 20 minutes in protein-blocking solution, and amplification of signals was then performed by incubating the specimens with goat anti-mouse or goat anti-rabbit IgG biotinylated secondary antibody (Biocare Medical, Walnut Creek, CA), followed by streptavidin conjugated with horseradish peroxidase (Dako, Carpinteria, CA) in PBS (1:300) for 30 min. After washing with PBS, the specimens were stained with AEC (3-amino-9-ethylcarbazole chromogen; BioBenex, San Ramon, CA) for 7–10 min at room temperature. The reaction was checked microscopically to determine the end point. The slides were washed with distilled water and applied with Permount (Fisher Scientific) and cover slides [31].
Image Analysis
Stained sections were examined in a Zeiss photomicroscope (Carl Zeiss, Inc., Thornwood, NY) equipped with a color camera (model DXC-960 MD; Sony Corp., Tokyo, Japan). The images were analyzed using the Optimas image analysis software version 6.5 (Bothell, WA). Images covering the range of staining intensities were captured electronically, and the threshold value was set in the red, green, and blue modes of the color camera. All subsequent images were quantified on the basis of this threshold. The samples were not counterstained, so the absorbance was solely the product of the ISH reaction. The methodology used to determine gene expression via ISH was similar to that used in previous studies [23–24]. The study pathologist circled the center and edge areas (i.e., edge facing the prostate capsule) of the dominant tumor stained with hematoxylin and eosin in addition to designating areas of histologically normal epithelium on the same slide. The pre-marked H+E slides were overlaid with slides stained via either ISH or IHC techniques and the same areas were traced to define the areas of interest for gene expression at the tumor center, edge, or in normal epithelium. Measured fields in the areas of interest were 1 mm2 wide at the center (4 areas) and at the edge (at least 5 fields, approximately 1 field every 3 mm) of a tumor. Areas of nuclear staining and necrotic cells were avoided. Staining of the cells was next quantified to derive an average value of the field.
All specimens used in our study exhibited strong staining for the poly d (T)20 probe, indicating that the mRNA was well preserved. We adjusted specific gene expression by the poly d(T)20 in each slide to compare the expression levels of different slides, which is analogous to a loading control used in mRNA northern blot analysis. In addition, on each slide, the gene expression levels in tumor epithelium were further normalized to the expression in histologically normal epithelium on the same slide to control for samples that were run on different days. The intensity of staining for each gene was evaluated by measuring the integrated absorbance of the poly d(T)20 probe for each specimen as well as the specific mRNA probe of interest in both histologically normal and tumor epithelium. The absorbance for a specific gene of interest was divided by the poly d(T)20 expression level in the same area to adjust for mRNA integrity. The resulting normalized value obtained in tumor epithelium was divided by the value obtained from measuring expression levels in non-neoplastic epithelium. This ratio was multiplied by 100, and the result represented relative corrected gene expression in tumor versus histologically normal epithelium.
The M/E ratio was calculated with the corrected mRNA expression levels using the following formula: (MMP-2 + MMP-9)/2 ÷ E-cadherin expression level (Fig. 1). The field with the highest M/E ratio was assigned to the specimen. This designation was based upon prior data that revealed the field with the highest M/E ratio had the strongest association with pathologic stage in comparison with using the average of the field M/E ratio values [23]. Two reviewers, a trained Urology department research fellow (reviewer 1) and a senior research associate (reviewer 2), individually analyzed gene expression via mRNA ISH on the same slide set to assess interobserver variability in expression levels. Data sets were sent separately to the study statisticians (XW) for analysis. The methodology used to determine gene expression via IHC was performed by reviewer #2 alone and was similar to the method used in the ISH assay except that protein expression in the tumor was normalized to histologically normal epithelium alone (i.e., MMP-2 protein tumor/MMP-2 protein normal epithelium × 100 = corrected MMP-2 tumor expression). To determine the tumor M/E ratio for protein expression, the corrected gene expression levels were used in the following formula: (MMP-2 + MMP-9)/2 ÷ E-cadherin.
Figure 1.

ISH analysis of E-cadherin and MMP-2 and -9 mRNA expression in a RP specimen. Hematoxylin and eosin histology reveals a Gleason 8 adenocarcinoma (stage = pT3b, N0). Hybridization with hyperbiotinylated poly d(T)20 probe confirmed mRNA integrity (not shown). The numbers for E-cadherin, MMP-9, and MMP-2 indicate expression intensities compared with the epithelium of normal glands, which was assigned the value of 100. The M/E ratios [(MMP-2+MMP-9/ 2) ÷ E-cadherin] for the RP specimen were 4.91 (tumor edge) and 1.46 (tumor center) from reviewer 1.
Statistical Analysis
Summary statistics were provided for the data set, with medians and ranges calculated for quantitative variables and count and percentages listed for discrete variables. Box plots were generated to illustrate the distribution of M/E ratios within each subgroup. The Kruskal-Wallis test was performed to compare M/E ratios among various Gleason grade groups at the center and edge of the tumor. The Wilcoxon rank-sum test was performed to test the difference in M/E ratios between organ-confined group (≤ pT2) and the advanced-disease group (> pT2) at the tumor center and the edge. The classification and regression tree (CART) method [32] was implemented to search for the optimal cut-off point of the M/E ratio to predict tumor stage or time-to-biochemical failure. Spearman correlation coefficient was used to assess the correlation of measurements between the two reviewers or between ISH and IHC methods. Coefficient of Variation (CV) was used to evaluate the variability among the multiple measurements provided by each reviewer and within each zone of interest. The difference in CV between tumor edge and center within each reviewer is assessed using Wilcoxon rank-sum test. The data set for the disease outcome variable consisted of 34 of 36 AA patients who were treated with RP and who received no post-operative therapy prior to exhibiting biochemical failure. Two patients were excluded from analysis because they received immediate hormone therapy (n=1) or radiotherapy (n=1) prior to biochemical failure. Kaplan-Meier [33] methodology was used to estimate the probability of biochemical-failure-free survival in subgroups of patients. The Log-rank test [34] was performed to assess the difference in time-to-biochemical failure between subgroups. Univariate Cox regression models [35] were fit to assess the predictive effect of clinical stage (T1c, T2a, or T2b), Gleason score (≤ 7 versus > 7), pathologic stage (≤ pT2 versus > pT2), and serum PSA level (log transformed) on the risk of biochemical failure. All statistical analyses were performed in Splus (Insightful, Seattle, WA) [36], and P values less than 0.05 were deemed as statistically significant.
Results
M/E ratio assessment by mRNA ISH
Thirty-six peripheral zone tumors from 36 AA patient specimens were evaluated to determine the relationship between the expression of the M/E ratio to tumor Gleason score and pathologic stage. The distribution of Gleason scores among the 36 tumors was 7 (19.4%), 16 (43.3%), 8 (21.6%), and 5 (13.5%) for Gleason scores 6, 7, 8, and 9 tumors, respectively. Pathologic stage was T2 in 18 specimens (50%) and > T2 in 18 specimens (50%). Table 1 shows the M/E ratios of the 36 peripheral zone tumors measured via mRNA ISH stratified by Gleason score, intratumoral location of gene assessment, and reviewer.
Table I.
M/E ratio assessed by mRNA ISH and grouped by Gleason score and Reviewer.
| MMP/E-cad Ratio | ||||||
|---|---|---|---|---|---|---|
| Reviewer | GS | N | Peripheral | P-value | Central | P-value |
| 1 | 6 | 7 | 2.09 (1.09)
(0.96, 3.73) |
2.63 (1.27)
(0.95, 4.76) |
||
| 7 | 16 | 3.62 (2.20)
(0.86, 9.83) |
2.30 (0.92)
(0.94, 3.99) |
|||
| 8 | 8 | 7.04 (4.69)
(0.77, 15.98) |
2.44 (1.08)
(0.59, 3.98) |
|||
| 9 | 5 | 6.39 (2.54)
(3.25, 9.04) |
0.02 |
3.78 (3.34)
(1.11, 9.36) |
0.88 |
|
| 2 | 6 | 7 | 1.56 (0.49)
(0.75, 2.20) |
1.21 (0.47)
(0.49, 1.84) |
||
| 7 | 16 | 2.24 (1.33)
(0.74, 5.32) |
1.37 (0.46)
(0.61, 2.38) |
|||
| 8 | 8 | 5.16 (3.47)
(2.38, 13.22) |
2.64 (1.57)
(1.22, 6.14) |
|||
| 9 | 5 | 3.46 (0.61)
(2.61, 4.25) |
0.0008 |
1.42 (0.58)
(0.91, 2.35) |
0.02 |
|
Results represent the mean (SD) of the maximum values for each tumor and the range. M/E, matrix metalloproteinase to E-cadherin; ISH, in situ hybridization; GS, Gleason score; N, number.
Consistent with our prior observations the M/E ratio measured at the edge of the tumor consistently and significantly increased with increasing Gleason score for both reviewers (P = 0.02–0.0008). Reviewer 2 noted that the ratio of expression at the tumor center also increased with increasing Gleason score. However this was not consistent as reviewer 1 did not make this observation. In addition we found that the M/E ratio assessed by Reviewer 1 was higher than that of Reviewer 2 in the same tumors for virtually all Gleason scores and tumor locations.
The relationship between pathologic stage and tumor M/E ratio was next assessed (Table 2). We again noted that the M/E ratio calculated by Reviewer 1 was higher for advanced tumors than the ratio calculated by Reviewer 2. However, for both datasets, the mean of the maximum mRNA M/E ratio for advanced tumors (> T2; 6.52 and 4.15) appeared to be 2-fold higher than the corresponding values for organ-confined tumors (T2; 2.54 and 1.71) (P < 0.0001). There was no association between M/E ratio assessed in the tumor center and pathologic stage for either reviewer (Table 2). Considering differences noted in the M/E ratio between reviewers we assessed the correlation among reviewers and the variability in readings among the two reviewers in a given tumor area. A positive correlation existed among the two reviewers for tumor readings at the edge (r=0.42). However the correlation was lost for readings at the tumor center. There was significant variation for a given reviewer in the individual M/E ratio values for one tumor. The median coefficient of variation (CV) for edge and tumor measurements depending on tumor edge or center location ranged from 32–41% for reviewer 1 and 24–38% for reviewer 2. For both reviewers the CV tended higher for measurements at the tumor edge versus the center (reviewer 1 edge vs. center, 41 vs. 32% p=0.10; reviewer 2 edge vs. center 38% vs. 24% p=0.03)
Table II.
M/E ratio via ISH stratified by pathologic stage and reviewer.
| MMP/E-cad Ratio | ||||||
|---|---|---|---|---|---|---|
| Reviewer | Pathological Stage | N | Peripheral | P-value | Central | P-value |
| 1 | pT2 | 18 | 2.54 (1.20)
(0.86, 5.97) |
2.25 (1.00)
(0.94, 4.76) |
||
| >pT2 | 18 | 6.52 (3.47)
(0.77, 15.98) |
0.0001 |
2.95 (1.91)
(0.59, 9.36) |
0.29 |
|
| 2 | pT2 | 18 | 1.71 (0.66)
(0.74, 3.46) |
1.40 (0.49)
(0.49, 2.38) |
||
| >pT2 | 18 | 4.15 (2.60)
(1.30, 13.22) |
<0.0001 |
1.85 (1.28)
(0.61, 6.14) |
0.53 |
|
Results represent the mean (SD) of the maximum values for each tumor and the range. M/E, matrix metalloproteinase to E-cadherin; ISH, in situ hybridization; N, number.
M/E Protein Expression
To determine whether the relationship between MMP and E-cadherin expression assessed at the protein level provided similar information as mRNA ISH, we used IHC to examine 24 tumors that had previously been stained using ISH by reviewer #2.
Seventeen tumors had a Gleason score ≤ 7, and 7 had a Gleason score > 7. The pathologic stage was pT2 and > pT2 in 12 tumors each. Figure 2 shows that the M/E ratio assessed via IHC at the tumor edge was significantly higher than the corresponding value at the tumor center. In addition, the M/E ratio at the edge was significantly associated with increasing Gleason score (P = 0.008), (Figure 2A) as compared with its assessment at the tumor center (P = 0.13, Figure 2B). Similarly, when the relationship between the M/E ratio assessed via IHC and pathologic stage was evaluated (Fig. 3), we found that the ratio measured at the tumor edge (P = 0.0005, Figure 3A) was significantly associated with pathologic stage compared with its corresponding value measured at the tumor center (P = 0.98, Figure 3B).
Figure 2.
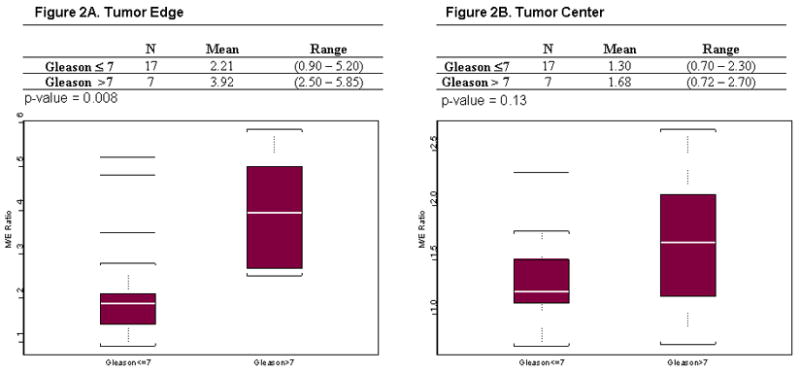
Box plots for M/E ratio assessed via IHC and stratified by Gleason score and location of intratumoral staining. A) M/E ratio measured at the tumor edge (P = 0.008 Gleason score > 7 significantly higher than Gleason score ≤7 prostate cancer). B) M/E ratio measured at the tumor center (P = 0.13, M/E ratio not significantly different by Gleason score at tumor center).
Figure 3.

Box plots for M/E ratio assessed via IHC and stratified by pathologic stage and location of intratumoral staining. A) M/E ratio measured at the tumor edge (P = 0.0005 for M/E ratio > pT2 significantly higher than pT2 prostate cancers). B) M/E ratio measured at the tumor center (P = 0.98 M/E ratio not significantly different by pathologic stage at tumor center).
Using CART to analyze the 24 tumors in which gene expression was assessed by ISH and IHC, we found the best cut point for differentiating pT2 tumors from > pT2 tumors to be 2.50 for ISH (Reviewer 2, 21 of 24 tumors [88%] correctly classified) and 2.30 for IHC (Reviewer 2, 21 of 24 [88%] tumors correctly classified). The correlation coefficient for ISH and IHC values among the 24 cases was r= 0.49. The 2 techniques agreed upon the stratification of pT2 versus >pT2 in 20 of 24 cases (83%, data not shown) using the above cut off values. Thus the ISH and IHC results correlated and provided similar information.
M/E Ratio and Disease Outcome Following RP
The distribution of clinical stage in the 34 specimen from AA patients included in the treatment outcome analysis was 14 T1c tumors, 11 T2a tumors, and 9 T2b tumors. The median pretherapy serum PSA level was 8.4 ng/mL (range 2–49 ng/mL). The median follow-up duration for the entire cohort was 4.3 years. Seven of the 34 patients (20.6%) experienced biochemical failure (a serum PSA level ≥ 0.2 ng/mL). Univariate analysis was utilized to determine which variables were significantly associated with biochemical failure. The M/E ratio was significantly associated with post-RP biochemical failure (Fig. 4). Only 1 of 20 patients with a M/E ratio ≤ 2.5 and 6 of 14 with a ratio > 2.5 experienced treatment failure (P = 0.01). Similarly, no patient with organ-confined cancer (pT2) experienced treatment failure, whereas 7 of 16 patients with advanced-stage cancer (> pT2) did (P = 0.007). The prostatectomy Gleason score was only marginally significant (P = 0.13). Neither clinical stage (P = 0.24) nor pretherapy serum PSA level (P = 0.18) were significantly associated with treatment outcome.
Figure 4.
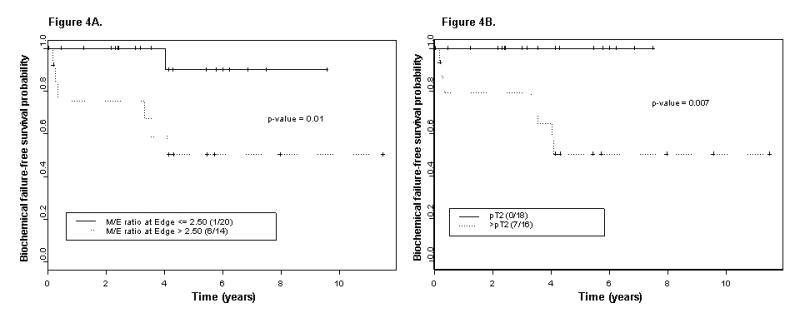
Kaplan-Meier estimates of biochemical failure–free survival probability: A) stratified by the maximum M/E ratio determined at the edge of the RP specimen and B) stratified by pathologic stage (N = 34 specimen from AA patients).
Discussion
The expression of genes that modulate the invasive phenotype of prostate cancer such as matrix metalloproteinase (promote cell invasion) [37–39], E-cadherin, (promote cell cohesiveness), [40–43] and tissue inhibitors of matrix metalloproteinase (TIMPS) [39] has been studied individually and collectively [23–24, 37–43] in prostate cancer and have prognostic significance with respect to the prediction of pathologic stage and disease recurrence. We have previously shown that the M/E expression ratio reflects the “invasive potential” of human prostate cancer as it is highly associated with pathologically proven extraprostatic spread of disease. [23–24] Others have also found that a multiparametric assessment of invasive potential based on the ratio of either Matrix metalloproteinase to TIMPS or other gene profiles such as enhancer of zest homolog 2:E-cadherin (EZH2:ECAD) provided significant prognostic information [39, 44].
With respect to the M/E ratio we discovered that MMP 2 and 9 expression was increased at the invasive edge of pathologically advanced tumors compared with those that were organ confined [23]. In the same areas E-cadherin expression was relatively decreased. This was in direct contrast to the tumor center where MMP expression was lower and E-cadherin expression was higher. The observation was true for both Cau and Japanese cohorts of patients but we were unaware that this type of assessment had been performed on AA prostate cancer patient specimens [23–24]. This is relevant as AA patients have previously been shown to exhibit a higher incidence of metastasis at presentation, pathologic stage, Gleason score, and prostate cancer mortality [1, 3, 45–47]. Thus the focus of the current study was to evaluate the M/E expression ratio among AA patients to define if intratumoral heterogeneity of gene expression occurred and if expression patterns characterized disease aggressiveness as was noted among Cau and Japanese patients [24].
It was our belief that a preliminary study was justified in order to define how to best construct a tissue micro array (TMA) using larger numbers of AA and Cau patients in a direct comparative study. As shown in Table 1 (and Figure 1) the M/E ratio measured at the tumor edge (versus the center) was consistently associated with higher Gleason score among both reviewers. This association of gene expression with tumor virulence was even stronger when considering tumor pathologic stage (Table 2). Thus taken together with our prior studies the current data suggests that the M/E ratio among AA patients characterizes the histologic progression of the disease as was noted for Cau and Japanese cohorts. Further in constructing a future TMA we have validated the importance of assuring that specimens from the tumor edge are procured.
While conceptually the M/E ratio values for the two reviewers were either increased or decreased in parallel the actual median values were different (see Tables 1–3). This raises concern regarding the possibility that the M/E ratio could be used more broadly as a potential prognostic biomarker in patient tissue specimens. The discrepancy among reviewers was likely related to the inherent heterogeneity of gene expression and values obtained in different prostate cancer glands within the various pre-designated fields. In support of this we noted a median variability of 32–41% and 24–38% around a given maximum M/E ratio for a tumor for reviewers 1 and 2 respectively. Thus considering the heterogeneity of prostate cancer this reinforces the necessity of independent validation of any tissue marker with large data sets when trying to establish the ultimate clinical utility. In this respect, using immunohistochemical techniques that are widely available in clinical laboratories we assessed the correlation of the M/E ratio as assessed via mRNA in situ hybridization and immunohistochemistry (IHC) in the same 24 specimens assessed by reviewer 2. As with ISH, the M/E protein expression ratio revealed a significant association of gene expression measured at the tumor invasive edge with increasing Gleason score and pathologic stage (see Figures 2–3). Among the 24 tumors both ISH and IHC readings correlated, correctly classified the pathologic stage of 21 tumors (87.5%) and agreed in the same 20/24 tumors (83%). Thus these data support that the M/E ratio can be assessed using standard immunohistochemical techniques allowing for further independent validation.
Finally we show that the M/E ratio was correlated with disease recurrence as assessed by a rising serum PSA level after what was felt to be curative primary tumor therapy. Both pathologic stage and the M/E ratio were highly associated with treatment failure among this AA cohort. In contrast neither pretreatment serum PSA level, Gleason score, nor clinical stage were significantly associated with treatment failure. Whether the M/E ratio is an independent predictor of disease recurrence or could be used as a clinically useful prognostic biomarker requires prospective validation and if successful multicenter evaluation for feasibility, prognostic significance and a determination of incremental clinical value (48–51).
Conclusion
The current data reveal that the M/E expression ratio characterizes an important aspect of the molecular phenotype associated with the histologic progression of prostate cancer among African American prostate cancer patients. However, significant tissue heterogeneity and interobserver variability in assessing gene expression were noted. Based upon these observations, a larger study is required and is in progress to determine the independent prognostic value of the M/E ratio with respect to gene expression levels, disease recurrence and racial variation among both AA and Cau patients.
Acknowledgments
Supported in part by a SPORE grant from the National Cancer Institute #CA90270 and the Department of Defense #PC030274.
References
- 1.Jemal A, Seigal R, Ward E, Yongping H, Xu J, Murray T, Thun MJ. Cancer Statistics, 2008. CA Cancer J Clin. 2008;58:71–96. doi: 10.3322/CA.2007.0010. [DOI] [PubMed] [Google Scholar]
- 2.Sakr WA, Grignon DJ, Haas GP, Schomer KL, Heilbrun LK, Cassin BJ, Powell J, Montie JA, Pontes JE. Epidemiology of high grade prostatic intraepithelial neoplasia. Pathol Res Pract. 1995;191:838–841. doi: 10.1016/s0344-0338(11)80965-9. [DOI] [PubMed] [Google Scholar]
- 3.Pettaway CA, Troncoso P, Ramirez EI, Johnston DA, Steelhammer L, Babaian RJ. Prostate specific antigen and pathological features of prostate cancer in black and white patients: a comparative study based on radical prostatectomy specimens. J Urol. 1998;160:437–442. [PubMed] [Google Scholar]
- 4.Tiguert R, Gheiler EL, Tefilli MV, Banerjee M, Grignon DJ, Sakr W, Wood DP, Jr, Powell IJ, Pontes JE. Racial differences and prognostic significance of tumor location in radical prostatectomy specimens. Prostate. 1998;37:230–235. doi: 10.1002/(sici)1097-0045(19981201)37:4<230::aid-pros4>3.0.co;2-l. [DOI] [PubMed] [Google Scholar]
- 5.Sanchez-Ortiz RF, Troncoso P, Babaian RJ, Lloreta J, Johnston DA, Pettaway CA. African American men with nonpalpable prostate cancer exhibit greater tumor volume than matched Caucasian men. Cancer. 2006;107:75–82. doi: 10.1002/cncr.21954. [DOI] [PubMed] [Google Scholar]
- 6.Moul JW, Connelly RR, Mooneyhan RM, Zhang W, Sesterhenn IA, Mostofi FK, McLeod DG. Racial differences in tumor volume and prostate specific antigen among radical prostatectomy patients. J Urol. 1999;162:394–397. [PubMed] [Google Scholar]
- 7.Ross RK, Bernstein L, Lobo RA, Shimizu H, Stanczyk FZ, Pike MC, Henderson BE. 5-alpha-reductase activity and risk of prostate cancer among Japanese and US white and black males. Lancet. 1992;339:887–889. doi: 10.1016/0140-6736(92)90927-u. [DOI] [PubMed] [Google Scholar]
- 8.Makridakis NM, Ross RK, Pike MC, Crocitto LE, Kolonel LN, Pearce CL, Henderson BE, Reichardt JK. Association of mis-sense substitution in SRD5A2 gene with prostate cancer in African-American and Hispanic men in Los Angeles, USA. Lancet. 1999;354:975–978. doi: 10.1016/S0140-6736(98)11282-5. [DOI] [PubMed] [Google Scholar]
- 9.Makridakis N, Ross RK, Pike MC, Chang L, Stanczyk FZ, Kolonel LN, Shi CY, Yu MC, Henderson BE, Reichardt JK. A prevalent missense substitution that modulates activity of prostatic steroid 5alpha-reductase. Cancer Res. 1997;57:1020–1022. [PubMed] [Google Scholar]
- 10.Devgan SA, Henderson BE, Yu MC, Shi CY, Pike MC, Ross RK, Reichardt JK. Genetic variation of 3 beta-hydroxysteroid dehydrogenase type II in three racial/ethnic groups: implications for prostate cancer risk. Prostate. 1997;33:9–12. doi: 10.1002/(sici)1097-0045(19970915)33:1<9::aid-pros2>3.0.co;2-h. [DOI] [PubMed] [Google Scholar]
- 11.Winters SJ, Brufsky A, Weissfeld J, Trump DL, Dyky MA, Hadeed V. Testosterone, Sex Hormone-Binding Globulin, and Body Composition in Young Adult African American and Caucasian Men. Metabolism. 2001;50:1242–1247. doi: 10.1053/meta.2001.26714. [DOI] [PubMed] [Google Scholar]
- 12.Paris PL, Kupelian PA, Hall JM, Williams TL, Levin H, Klein EA, Casey G, Witte JS. Association between a CYP3A4 Variant and Clinical Presentation in African American Prostate Cancer Patients. Cancer Epid, Bio Prev. 1999;8:901–905. [PubMed] [Google Scholar]
- 13.Kittles RA, Panguluri RK, Chen W, Massac A, Ahaghot UC, Adams-Campbell L, Isaacs W, Dunston GM. CYP17 Promoter Variant Associated with Prostate Cancer Aggressiveness in African Americans. Cancer Epidemiol Biomarkers Prev. 2001:10943–10947. [PubMed] [Google Scholar]
- 14.Irvine RA, Y MC, Ross RK, Coetzee GA. The CAG and GGC microsatellites of the androgen receptor gene are in linkage disequilibrium in men with prostate cancer. Cancer Res. 1995;55:1937. [PubMed] [Google Scholar]
- 15.Strom SS, Gu Y, Zhang H, Zhang H, Tron Coso P, Babarian RJ, Pettaway CA, Shete S, Spitz MR, Logothetis CJ. Androgen receptor polymorphisms and risk of biochemical failure among prostatectomy patients. The Prostate. 2004;60:343–351. doi: 10.1002/pros.20060. [DOI] [PubMed] [Google Scholar]
- 16.Tricoli JV, Winter DL, Hanlon AL, Raysor SL, Watkins-Bruner D, Pinover WH, Hanks GE. Racial differences in insulin-like growth factor binding protein-3 in men at increased risk of prostate cancer. Urology. 1999;54:178–182. doi: 10.1016/s0090-4295(99)00129-6. [DOI] [PubMed] [Google Scholar]
- 17.Platz EA, Pollak MN, Rimm EB, Majeed N, Tao Y, Willett WC, Giovannucci E. Racial variation in insulin-like growth factor-1 and binding protein-3 concentrations in middle-aged men. Cancer Epidemiol Biomarkers Prev. 1999;8:1107–1110. [PubMed] [Google Scholar]
- 18.Winter DL, Hanlon AL, Raysor SL, Watkins-Bruner D, Pinover WH, Hanks GE, Tricoli JV. Plasma levels of IGF-1, IGF-2, and IGFBP-3 in white and African-American men at increased risk of prostate cancer. Urology. 2001;58:614–618. doi: 10.1016/s0090-4295(01)01273-0. [DOI] [PubMed] [Google Scholar]
- 19.Pettaway CA, Pathak S, Greene G, Ramirez E, Wilson MR, Killion JJ, Fidler IJ. Selection of highly metastatic variants of different human prostatic carcinomas utilizing orthotopic implantation in nude mice. Clin Cancer Res. 1996;2:1627–1636. [PubMed] [Google Scholar]
- 20.Greene GF, Kitadai Y, Pettaway CA, von Eschenbach AC, Fidler IJ. In situ mRNA hybridization technique for analysis of metastasis-related genes in human prostate carcinoma cells. Am J Pathol. 1997;150:1571–1582. [PMC free article] [PubMed] [Google Scholar]
- 21.Balbay MD, Pettaway CA, Kuniyasu H, et al. Highly metastatic human prostate cancer growing within the prostate of athymic mice overexpressed vascular endothelial growth factor. Clin Cancer Res. 1999;5:783–789. [PubMed] [Google Scholar]
- 22.Inoue K, Slaton JW, Eve BY, et al. Interleukin 8 expression regulates tumorigenicity and metastases in androgen-independent prostate cancer. Clin Cancer Res. 2000;6:2104–2119. [PubMed] [Google Scholar]
- 23.Kuniyasu H, Troncoso P, Johnston D, Bucana CD, Tahara E, Fidler IJ, Pettaway CA. Relative expression of Type IV collagenase, E-cadherin, and vascular endothelial growth factor/vascular permeability factor in prostatectomy specimens distinguishes organ-confined from pathologically advanced prostate cancers. Clin Cancer Res. 2000;6:2295–2308. [PubMed] [Google Scholar]
- 24.Kuniyasu H, Ukai R, Johnston D, Troncoso P, Fidler IJ, Pettaway CA. The relative mRNA expression levels of matrix metalloproteinase to E-cadherin in prostate biopsy specimens distinguish organ-confined from advanced prostate cancer at radical prostatectomy. Clin Cancer Res. 2003;9:2185–2194. [PubMed] [Google Scholar]
- 25.Ayala AG, Ro JY, Babaian RJ, Troncoso P, Grignon D. The prostatic capsule: does it exist? Its importance in the staging and treatment of prostatic carcinoma. Am J Surg Pathol. 1989;13:21–27. [PubMed] [Google Scholar]
- 26.Babaian RJ, Troncoso P, Steelhammer LC, Lloreta-Trull J, Ramirez EI. Tumor volume and prostate specific antigen: implications for early detection and defining a window of curability. J Urol. 1995;154:1808. doi: 10.1016/s0022-5347(01)66790-9. [DOI] [PubMed] [Google Scholar]
- 27.Fleming ID, Cooper JS, Henson DE, Hutter RV, Kennedy BJ, Murphy GP, O’Sullivan B, Sobin LH, Yarbro JW. AJCC Cancer Staging Manual. 5. Philadelphia: Lippincott-Raven; 1997. pp. 121–126. [Google Scholar]
- 28.Schroder FH, Hermanek P, Denis L, Fair WR, Gospodarowicz MK, Pavone-Macaluso M. The TNM Classification of Prostate Cancer. Prostate Suppl. 1992;4:129–138. doi: 10.1002/pros.2990210521. [DOI] [PubMed] [Google Scholar]
- 29.Park C-S, Manahan LJ, Brigati DJ. Automated molecular pathology: one hour in situ DNA hybridization. J Histotechnol. 1991;14:219–229. [Google Scholar]
- 30.Bucana CD, Radinsky R, Dong Z, Sanchez R, Brigati DJ, Fidler IJ. A rapid colorimetric in situ mRNA hybridization technique using hyper biotinylated oligonucleotide probes for analysis of mdr-1 in mouse colon carcinoma cells. J Histochem Cytochem. 1993;41:499–506. doi: 10.1177/41.4.8095509. [DOI] [PubMed] [Google Scholar]
- 31.Ahmad SA, Liu W, Jung YD, Fan F, Wilson M, Reinmuth N, Shaheen RM, Bucana CD, Ellis LM. The effects of angiopoietin-1 and -2 on tumor growth and angiogenesis in human colon cancer. Cancer Res. 2001;61:1255–1259. [PubMed] [Google Scholar]
- 32.Brieman L, Friedman JH, Olshen RA, Stone CJ. Classification and Regression Trees. Monterrey, California: Wadsworth & Brooks/Cole; 1984. [Google Scholar]
- 33.Kaplan EL, Meier P. Nonparametric estimator from incomplete observations. J American Statistical Association. 1958;53:457–481. [Google Scholar]
- 34.Mantel N. Evaluation of survival data and two new rank order statistics arising in its consideration. Cancer Chemotherapy Reports. 1966;60:163–170. [PubMed] [Google Scholar]
- 35.Cox DR. Regression models and life tables (with discussion) J R Statistical Soc B. 1972;34:187–220. [Google Scholar]
- 36.Venables WN, Ripley BD. Modern Applied Statistics With Splus. 3. New York: Springer; 1999. [Google Scholar]
- 37.Stearns M, Stearns ME. Evidence for increased activated metalloproteinase-2 (MMP-2): expression associated with human prostate cancer progression. Oncol Res. 1996;8:69–75. [PubMed] [Google Scholar]
- 38.Trudel D, Fradet Y, Meyer F, Harel F, Tetu B. Significance of MMP-2 Expression in Prostate Cancer. Cancer Res. 2003;63:8511–8515. [PubMed] [Google Scholar]
- 39.Still K, Robson CN, Autzen Robinson MC, Hamdy FC. Localization and quantification of mRNA for matrix metalloproteinase-2 (MMP-2) and tissue inhibitor of matrix metalloproteinase-2 (TIMP-2) in benign and malignant prostatic tissue. Prostate. 2000;42:8–25. doi: 10.1002/(sici)1097-0045(20000101)42:1<18::aid-pros3>3.0.co;2-a. [DOI] [PubMed] [Google Scholar]
- 40.Umbas R, Isaacs WB, Bringuier PP, Schaafsma HE, Oosterhof GO, Debruyne FM, Schalken JA. Decreased E-cadherin expression is associated with poor prognosis in patients with prostate cancer. Cancer Res. 1994;54:3929–3933. [PubMed] [Google Scholar]
- 41.Richmond PJM, Karayiannakis AJ, Nagafuchi A, Kaisary AV, Pignatelli M. Aberrant E-cadherin and E-catenin expression in prostate cancer: correlation with patient survival. Cancer Res. 1997;57:3189–193. [PubMed] [Google Scholar]
- 42.Luo J, Lubaroff DM, Hendrix MJC. Suppression of Prostate cancer Invasive Phenotype and Matrix Metalloproteinase Activity by E-cadherin Transfection. Cancer Res. 1999;59:3552–3556. [PubMed] [Google Scholar]
- 43.DeMarzo A, Knudsen B, Chan-Tack K, Epstein JI. E-cadherin expression as a marker of tumor aggressiveness in routinely processed radical prostatectomy specimens. Urology. 1999;53:707–713. doi: 10.1016/s0090-4295(98)00577-9. [DOI] [PubMed] [Google Scholar]
- 44.Rhodes DR, Sanda MG, Otte AP, Chinnaiyan AM, Rubin MA. Multiplex Biomarker Approach for Determining Risk of Prostate-Specific antigen-Defined Recurrence of Prostate Cancer. J Natl Cancer Inst. 2003;95:661–668. doi: 10.1093/jnci/95.9.661. [DOI] [PubMed] [Google Scholar]
- 45.Mebane C, Gibbs T, Horm J. Current status of prostate cancer in North American black males. J Natl Med Assoc. 1990;82:782–788. [PMC free article] [PubMed] [Google Scholar]
- 46.Hoffman RM, Gilliland FD, Eley JW, Eley JW, Harlan LC, Stephenson RA, Stanford JL, Albertson PC, Hemilton AS, Hunt WC, Potosky AL. Racial and ethnic differences in advanced-stage prostate cancer: the Prostate Cancer Outcomes Study. J Natl Cancer Inst. 2001;93:388–395. doi: 10.1093/jnci/93.5.388. [DOI] [PubMed] [Google Scholar]
- 47.Freedland SJ, Isaacs WB. Explaining racial differences in prostate cancer in the United States: sociology or biology? Prostate. 2005;62:243–252. doi: 10.1002/pros.20052. [DOI] [PubMed] [Google Scholar]
- 48.Margaret Sullivan Pepe, Etzioni Ruth, Feng Ziding, Potter John D, Lou Mary, et al. Phases of Biomarker Development for Early Detection of Cancer. JNCI. 2001 July;93(14):1054–61. doi: 10.1093/jnci/93.14.1054. [DOI] [PubMed] [Google Scholar]
- 49.Etzioni R, Kooperberg C, Pepe M, Smith R, Gann PH. Combining biomarkers to detect disease with application to prostate cancer. Biostatistics. 2003;4(4):523–38. doi: 10.1093/biostatistics/4.4.523. [DOI] [PubMed] [Google Scholar]
- 50.Kattan MW. Judging new markers by their ability to improve predictive accuracy. JNCI. 2003 May 7;95(9):634–5. doi: 10.1093/jnci/95.9.634. [DOI] [PubMed] [Google Scholar]
- 51.Kattan MW. Comparison of Cox regression with other methods for determining prediction models and nomograms. J Urol. 2003 Dec;170(6 Pt 2):S6–9. doi: 10.1097/01.ju.0000094764.56269.2d. discussion S10. [DOI] [PubMed] [Google Scholar]