

Abstract
Tandem breast cancer C-terminal (BRCT) domains, present in many DNA repair and cell cycle checkpoint signaling proteins, are phosphoprotein binding modules. The best-characterized tandem BRCT domains to date are from the protein BRCA1 (BRCA1-BRCT), an E3 ubiquitin ligase that has been linked to breast and ovarian cancer. While X-ray crystallography and NMR spectroscopy studies have uncovered the structural determinants of specificity of BRCA1-BRCT for phosphorylated peptides, a detailed kinetic and thermodynamic characterization of the interaction is also required to understand how structure and dynamics are connected and therefore better probe the mechanism of phosphopeptide recognition by BRCT domains. Through a global analysis of binding kinetics data obtained from surface plasmon resonance (SPR) and stopped-flow fluorescence spectroscopy, we show that the recognition mechanism is complex and best modeled by two equilibrium conformations of BRCA1-BRCT in the free state that both interact with a phosphopeptide, with dissociation constants (Kd) in the micromolar range. We show that the apparent global dissociation constant derived from this kinetic analysis is similar to the Kd values measured using steady-state SPR, isothermal titration calorimetry, and fluorescence anisotropy. The dynamic nature of BRCA1-BRCT may facilitate the binding of BRCA1 to different phosphorylated protein targets.
The breast and ovarian cancer susceptibility protein BRCA1 has been implicated in transcription regulation, cell cycle and centrosome control, DNA damage signaling, and DNA double-strand break repair by homologous recombination (1-3). BRCA1 is a multidomain protein of 1863 residues that interacts with numerous proteins at diverse stages of the cell cycle. The modular nature of BRCA1 was initially revealed by the three-dimensional (3D) structure of its N-terminal RING domain in complex with the RING domain of the protein BARD1 (BRCA1-associated ring domain) (4), and it was subsequently shown that, like many other RING domain-containing proteins, the BRCA1–BARD1 heterodimer has ubiquitin ligase activity (5, 6). At the C-terminus of BRCA1 lies a tandem of breast cancer C-terminal (BRCT) domains that has also been implicated in protein–protein interactions (7, 8). Mutations in both the RING and tandem BRCT domains of BRCA1 have been linked to breast and ovarian tumors (9).
The tandem BRCT domains of BRCA1 (BRCA1-BRCT)1 form a complex with the DNA repair helicase BACH1 (10) in a phosphorylation-dependent manner (11, 12). The BRCT domains of several other proteins also associate specifically with phosphorylated protein targets (11, 13). Recent work suggests that BRCA1 could function as an E3 ubiquitin ligase that would recruit its associated E2 conjugating enzyme through the RING domain and its phosphorylated targets by means of the tandem BRCT domains (14, 15).
The phosphoprotein binding site of BRCA1-BRCT was revealed by the structural characterization of BRCA1-BRCT in complex with a phosphoserine-containing peptide derived from the BACH1 helicase (BACH1-P) using X-ray crystallography (16, 17) and nuclear magnetic resonance (NMR) spectroscopy (12). The interactions of BRCA1-BRCT with other phosphopeptides have also been investigated (18, 19). In all cases, the phosphate group of the peptide forms salt bridges and hydrogen bonds with several amino acid side chains of the first BRCT domain, whereas a conserved phenylalanine in the +3 position from the phosphorylated residue binds a hydrophobic pocket at the interface between the two BRCT domains.
To improve our understanding of the mechanism of phosphopeptide recognition by BRCA1-BRCT, a comprehensive biophysical characterization is required that can complement the structural studies. In this work, we probed the thermodynamic and kinetic aspects of BRCA1-BRCT–BACH1-P interaction. We first performed thermodynamic measurements through a series of isothermal titration calorimetry (ITC) experiments covering a wide range of temperatures and salt conditions. The results are consistent with a phosphorylation-dependent interaction that obeys a simple 1:1 binding isotherm (Langmuir model) but give a heat capacity change at constant pressure, ΔCp, that is markedly different from the value calculated from the crystal structure of the BRCA1-BRCT–BACH1-P complex. The difference between experimental and calculated ΔCp values suggested that a rigid-body binding model might not apply to this interaction. To test the possibility that phosphopeptide binding would involve some flexibility in the form of multiple conformations of BRCA1-BRCT, we performed a steady-state and kinetic analysis of the interaction by surface plasmon resonance (SPR). While the steady-state analysis of SPR data provided equilibrium dissociation constants (Kd) that are in good agreement with those derived from ITC measurements, the SPR sensorgrams did not follow the Langmuir model but exhibited biphasic kinetics of association and dissociation that were confirmed by stopped-flow fluorescence (SFF) experiments. We then sought a kinetic model that would fit both SPR and SFF data and possibly explain such a biphasic mode of interaction. Eleven models were tested using selection criteria based on information theory and statistics. The best model for the BRCA1-BRCT–BACH1-P interaction invokes two equilibrium exchange conformations of BRCA1-BRCT in the free state, each conformation being able to bind the phosphopeptide.
EXPERIMENTAL PROCEDURES
Sample Preparation
Peptides derived from the DNA repair helicase BACH1 and transcriptional corepressor CtIP were synthesized and HPLC-purified at the Mayo Clinic peptide core facility. The BRCA1-BRCT protein (residues 1646–1859) was prepared as described previously (12) and concentrated to ~700 μM (stock solution). Final protein concentrations were determined by UV absorbance using an extinction coefficient (ε278) of 36500 M−1 cm−1, while peptide concentrations were determined by amino acid analysis. Molecular masses of protein and peptide samples were confirmed by mass spectrometry. All proteins and peptides used in this work are listed in Table S1 of the Supporting Information.
Isothermal Titration Calorimetry
Measurements were carried out with a VP-ITC titration calorimeter (MicroCal, LLC, Northampton, MA). All concentrated stocks of protein and peptide samples were prepared in the target buffer and diluted with the same buffer to achieve desired concentrations. In a typical experiment, the peptide solution was placed in the calorimeter injection syringe and delivered as a series of 3 μL injections every 3.5 min to the reaction cell containing the protein. Measurements were paired with control experiments for heat of mixing and dilution. Data were analyzed with Levenberg–Marquardt nonlinear regression using a single-binding site model (MicroCal ORIGIN 7.0). Several ITC experiments were recorded in duplicate or triplicate. The typical range of variation for enthalpy measurements was ±5%.
Differential Scanning Calorimetry
High-sensitivity calorimetric measurements were carried out with a VP-DSC calorimeter (MicroCal, LLC). All experiments were conducted with 0.8 mg/mL BRCA1-BRCT. Multiple reference scans with buffer-filled cells were performed prior to each experiment to ensure that the baseline is repeatable. A typical differential scanning calorimetry (DSC) run consisted of a first heating scan with a heating rate of 1 K/min followed by a second heating scan that probed the irreversibility of the transitions being studied. All DSC experiments were conducted in at least duplicate.
Surface Plasmon Resonance
Data were collected with a BIAcore 3000 (BIAcore AB/GE Healthcare Bio-Sciences Corp., Piscataway, NJ). Running buffers were filtered through a 0.45 μm membrane and thoroughly degassed. High-volume samples (>0.5 mL) were also filtered, while low-volume samples were centrifuged (16400 rpm for 5 min) to remove any particulate matter.
Two types of biosensor surfaces were generated from streptavidin-precoated sensor chips (SA sensor chip) and shorter dextran layer chips (CM3 sensor chip) (BIAcore AB/GE Healthcare Bio-Sciences Corp.). Neutravidin was manually immobilized on the CM3 chip via amine coupling. Details of chip activation and coupling are described in the Supporting Information. The peptides, extended at the N-terminus with biotin, a 6-aminohexanoic acid spacer, and the amino acid sequence Gly-Ser-Gly-Ser as a flexible linker, were immobilized on a chip at low density [20 resonance units (RU) of biotinylated peptide]. On the same chip, data were recorded on a control blank flow cell to account for nonspecific binding of the analyte to the matrix and for the change in refractive index. The theoretical maximum binding signal (Rtheo) was determined using eq 1 (20):
| (1) |
where MWanalyte and MWligand are the molecular masses of the analyte (BRCA1-BRCT, 25.38 kDa) and the ligand (bBACH1-P, 2067 Da), respectively, Rimmobilized is the RU signal of the ligand originally immobilized on the surface, and n is the number of analyte binding sites on one molecule of the ligand. In this case, n = 1. Assuming that the peptide is 100% active on the surface, the theoretical maximum binding signal (Rtheo) is 240 RU of BRCA1-BRCT for 20 RU of immobilized peptide.
Binding experiments were performed at different temperatures using a running buffer consisting of 50 mM sodium phosphate (pH 7.5), 0.005% (v/v) P20 detergent, and NaCl at a concentration of 50, 300, 600, or 900 mM. During the association phase, a BRCA1-BRCT solution at a concentration ranging from 30 nM to 8 μM was passed over the chip surface at a flow rate of 50 μL/min for 4 min. To minimize rebinding effects, the nonbiotinylated phosphopeptide was injected during the dissociation phase for 5 min as described previously (21, 22). The free phosphopeptide concentration was 20 μM. Under these conditions, a regeneration step was not required. However, the running buffer was allowed to flow for an additional 5 min to extensively wash the chip. All experiments were carried out in triplicate. The SPR signals were recorded in real time with a sampling interval of 0.5 s and plotted as RU versus time.
Data processing was performed using BIAevaluation 4.1 (BIAcore AB/GE Healthcare Bio-Sciences Corp.) by a procedure termed “double referencing” (23) (see the Supporting Information for details) in which sensorgrams were corrected for buffer effect and bulk refractive index changes.
The steady-state binding signal (Req) was derived by averaging the signals from 230 to 235 s after each BRCA1-BRCT injection and plotting the average signal as a function of BRCA1-BRCT concentration with ORIGIN 7.0 (Origin-Lab). By assuming a single-site equilibrium model, the binding isotherm signal (Req) was used to determine the equilibrium dissociation constant (Kd) by nonlinear regression (weighted by experimental errors) following the formula derived from the Langmuir isotherm (24):
| (2) |
C is the concentration of free analyte during the binding and is approximately equal to the total analyte concentration since the amount of immobilized peptide is very small. Rmax is the maximum capacity of the surface and is to be compared to the theoretical maximum binding rate (Rtheo) of 240 RU for BRCA1-BRCT. Rmin is the signal expected in the absence of analyte (C = 0). After subtraction of the reference signal, Rmin should be as close to zero as possible in the fit.
Kinetic analysis of SPR data was performed using BIAe-valuation 4.1 (BIAcore AB/GE Healthcare Bio-Sciences Corp.) and CLAMP (25, 26). The two programs fit various models to experimental data by using numerical integration of the rate equations. For the best accuracy, global analysis was performed by simultaneously fitting the experimental association and dissociation curves at several BRCA1-BRCT concentrations. The quality of the fit was initially assessed by the residual standard deviation (STD) value. Data linearization and statistic calculations for model selections were performed with Microsoft Excel. ORIGIN 7.0 (OriginLab) was used for the analysis of steady-state SPR data.
Fluorescence Studies
Equilibrium and fluorescence anisotropy spectra were acquired using a Jobin Yvon Fluorolog 3 spectrofluorometer (HORIBA Jobin Yvon, Edison, NJ) with a 0.5 cm path length cell. All measurements, including unfolding experiments with guanidinium chloride (GdmCl), were performed at 25 °C with 2 μM protein samples in 50 mM sodium phosphate (pH 7.5) and 300 mM NaCl. The bandwidth for excitation and emission was 5 nm. For equilibrium fluorescence spectra, tryptophan residues were selectively excited at 295 nm and the emission was recorded from 308 to 400 nm. For the fluorescence anisotropy experiments, a dansyl-labeled BACH1 peptide (dBACH1-P) was used at a concentration of 4 μM and the maximum BRCA1-BRCT concentration was 6 μM. Excitation and emission wavelengths were 332 and 580 mm, respectively.
Stopped-flow fluorescence experiments for detecting changes in the dBACH1-P signal were performed using an Applied Photophysics (Leatherhead, Surrey, U.K.) SX.18MV stopped-flow spectrometer. The excitation wavelength was 332 nm, and the emitted light was recorded using a 395 nm cutoff filter between the cell and the fluorescence detector. The reported concentrations were those in the reaction chamber. Each trace was the average of three to four trials, depending on the signal intensity.
All stopped-flow data were analyzed globally using a computer program we developed that is based on exhaustive global minimization algorithm SIH (simplex-induction hybrid) (27) and Livermore ODE solver LSODA (28). For each reaction mechanism, first-order ordinary differential equations were numerically integrated and the unknown rate constants were determined by nonlinear regression, while multiple traces corresponding to different initial concentrations of BRCA1-BRCT or BACH1-P were simultaneously fit.
RESULTS
Optimization of Experimental Conditions
Working with high-quality protein and peptide samples is essential for reliable kinetic and thermodynamic measurements. Thus, several controls were performed at the outset to ensure that all samples used were stable and homogeneous. DSC was performed to assess the conformational stability of BRCA1-BRCT. The heat denaturation profiles exhibit irreversible endothermic transitions at Tm (temperature at maximum 〈ΔCp〉) values of 50 and 57 °C for the free and peptide-bound BRCA1-BRCT, respectively (Figure 1A). A similar result for the thermal denaturation of BRCA1-BRCT in the free state was previously reported (29). The denaturation profile shows that the start of the unfolding transition for free BRCA1-BRCT occurs at ~42 °C. In complex with BACH1-P, BRCA1-BRCT starts to unfold at ~47 °C (Figure 1A). The temperatures at which we carried out our experiments were all below 42 °C where the proteins remain native, folded, and stable. Sample stability was also evaluated from the guanidinium chloride (GdmCl) denaturation profiles using fluorescence spectroscopy (Figure 1B). The minimum fluorescence emission wavelength detected at 2.25 mM GdmCl for the tandem BRCT domains is due to an intermediate species which remains partly folded, as previously reported (30).
Figure 1.
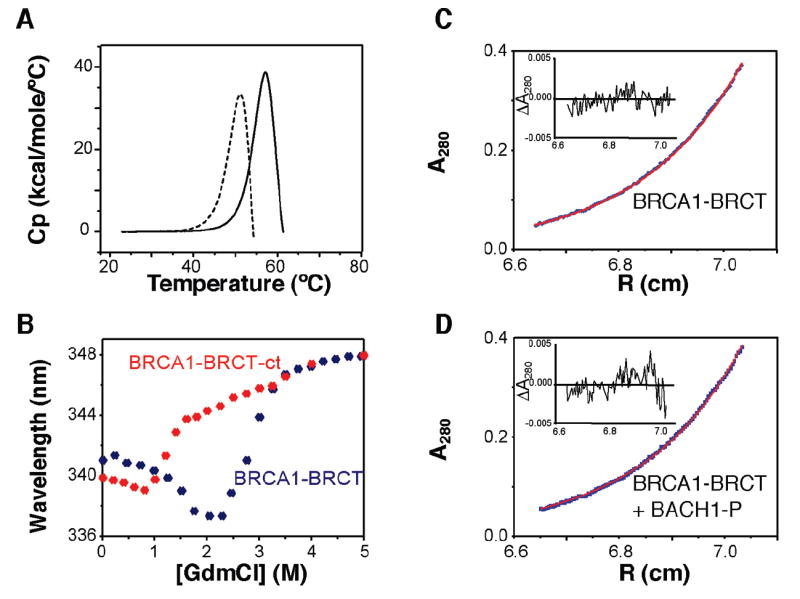
Stability and oligomerization state of BRCA1-BRCT and the BRCA1-BRCT–BACH1-P complex. (A) DSC thermograms of free BRCA1-BRCT (---) and BRCA1-BRCT in complex with BACH1-P (—). Experiments were conducted in 50 mM sodium phosphate (pH 7.5) and 300 mM NaCl with 30 μM BRCA1-BRCT with a protein:peptide ratio of 1:3 and a scan rate of 60 °C/h. The heat denaturation profiles show irreversibility with endothermic transitions at Tm values of 50 and 57 °C for free and BACH1-P-bound BRCA1-BRCT, respectively. (B) GdmCl-induced denaturation for BRCA1-BRCT and the C-terminal BRCT domain of BRCA1 (BRCA1-BRCT-ct) as measured by fluorescence spectroscopy at 25 °C. Protein concentrations were 2 μM each, and the excitation wavelength was 295 nm. Data are plotted as the average emission wavelength vs GdmCl concentration. (C) Sedimentation equilibrium profile of free BRCA1-BRCT (14 μM; OD = 0.3) shown as absorbance units at 280 nm vs radial position. The experimental curve was recorded in 50 mM sodium phosphate (pH 7.5) and 300 mM NaCl at 17 °C and 17000 rpm. The profile fits a monoexponential decay curve yielding a molecular mass of 24.6 ± 0.2 kDa. The inset shows residuals (in absorbance units) for the best-fit curve, assuming a single species. (D) Sedimentation equilibrium profile of BRCA1-BRCT (14 μM; OD = 0.3) in the presence of an excess of BACH1-P shown as absorbance units at 280 nm vs radial position. Data were recorded under the same conditions described for panel C. The profile fits a biexponential decay curve yielding molecular masses of 25.2 ± 0.2 kDa (contribution of 20%) and 26.5 ± 0.2 kDa (contribution of 80%). The inset shows residuals (in absorbance units) for the best-fit curve, assuming two species.
Analytical ultracentrifugation measurements were conducted to detect a possible self-association or aggregation of BRCA1-BRCT in solution. Sedimentation equilibrium experiments conducted on BRCA1-BRCT at concentrations of up to 0.35 mg/mL (14 μM) attest to the presence of a single species, as judged from the randomness of the residuals derived from a single-exponential analysis of the data (Figure 1C). The best-fit molecular mass obtained for free BRCA1-BRCT is 24.6 ± 0.2 kDa, which is in close agreement with the molecular mass of 25.38 kDa expected for the monomeric protein. To check for the possibility of dimer formation, the same data were fitted to a biexponential model. On the basis of this fit, if a dimer exists in solution it represents less that 10−10 of the total number of protein molecules. Equilibrium sedimentation measurements were also conducted for the BRCA1-BRCT–BACH1-P complex and revealed two species in solution, consistent with the presence of free and peptide-bound BRCA1-BRCT (Figure 1D). All subsequent kinetic and thermodynamic studies were conducted at a BRCA1-BRCT concentration of ≤14 μM.
The Interaction of BRCA1-BRCT and BACH1-P Is Enthalpically Driven
The energetics of association of BRCA1-BRCT with BACH1-P was measured directly by ITC. Figure 2 shows a typical calorimetric titration of BRCA1-BRCT with BACH1-P at 25 °C. The heat profile obtained for the addition of BACH1-P to BRCA1-BRCT is characteristic of an exothermic reaction. A control experiment in which the phosphopeptide was injected into buffer solution shows insignificant heat of dilution. No binding could be detected when a nonphosphorylated BACH1 peptide (BACH1-NP) was injected into the BRCA1-BRCT solution.
Figure 2.
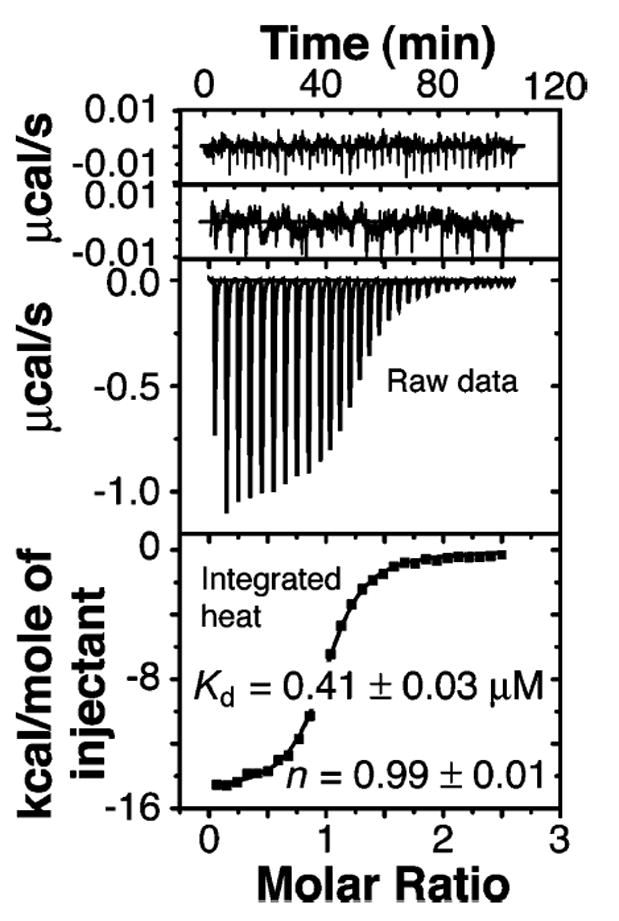
ITC of BACH1-P with BRCA1-BRCT at 25 °C in 50 mM sodium phosphate buffer (pH 7.5) and 300 mM NaCl. Shown from top to bottom are the raw titration data of BACH1-P injected into buffer, BACH1-NP injected into BRCA1-BRCT, and BACH1-P injected into BRCA1-BRCT and the integrated heat measurements for the titration of BRCA1-BRCT with BACH1-P. The Kd and stoichiometry (n) obtained by fitting a standard one-interaction site model are reported with the associated standard deviations determined by nonlinear least-squares analysis.
The enthalpy change upon binding (ΔH° = −14.8 ± 0.4 kcal/mol), the stoichiometry of the interaction (n = 0.99 ± 0.01), and the dissociation constant (Kd = 0.41 ± 0.03 μM) were obtained by fitting the binding isotherm to a single-binding site model using nonlinear least-squares regression. We also calculated the unitless parameter c (c = n[BRCA1-BRCT]/Kd) whose value of 45.5 falls within the optimal range of c values (10 < c < 100) for the accurate determination of the Kd (31).
Assuming a standard-state concentration of 1 M, the free energy change (ΔG°) for the binding of BACH1-P to BRCA1-BRCT was calculated to be −8.65 ± 0.02 kcal/mol using the formula ΔG° = −RT ln Ka. Knowing the values of ΔG° and ΔH°, the parameter ΔS° was then determined to be −20 ± 2 cal mol−1 K−1 (from TΔS° = −6.1 ± 0.6 kcal/mol at 25 °C). These results show that the binding of BACH1-P to BRCA1-BRCT is enthalpically driven at 25 °C.
Effect of Salt on the Binding Energetics Probed by ITC
To test if the BRCA1-BRCT–BACH1-P association is dependent on electrostatic interactions, we performed a series of calorimetric titrations at 25 °C at NaCl concentrations ranging from 0.05 to 0.9 M. We noted that at lower salt concentrations BRCA1-BRCT is prone to aggregation. Table 1 summarizes the thermodynamic parameters ΔG°, ΔH°, and ΔS° derived from these experiments. In all cases, binding of BRCA1-BRCT to BACH1-P is enthalpy-driven. The apparent Kd increases by only 2-fold from 0.05 to 0.9 M NaCl, indicating that the BRCA1-BRCT–BACH1-P association is mainly nonelectrostatic in nature. Replacement of NaCl with KCl revealed a similar salt dependency of the Kd (data not shown). The moderate decrease in affinity with increasing salt concentration might be due to electrostatic screening of the charge–charge interactions involving phosphoserine 990 of BACH1-P with lysine 1702 of BRCA1-BRCT, as well as lysine 995 of BACH1-P with glutamate 1836 and aspartate 1840 of BRCA1-BRCT, as seen in the crystal structures (16, 17).
Table 1.
Ionic Strength Dependence of the Thermodynamic Parameters for the Binding of BRCA1-BRCT to BACH1-P Characterized by ITC in 50 mM Sodium Phosphate (pH 7.5) at 25 °Ca and Different NaCl Concentrations
| [NaCl] (M) | N | Kd (μM) | ΔH° (kcal/mol) | ΔG° a (kcal/mol) | −TΔS° b (kcal/mol) |
|---|---|---|---|---|---|
| 0.05 | 1.00 ± 0.03 | 0.28 ± 0.02 | −16.3 ± 0.3 | −8.94 ± 0.04 | 7.4 ± 0.5 |
| 0.15 | 0.99 ± 0.02 | 0.33 ± 0.03 | −16.1 ± 0.3 | −8.83 ± 0.05 | 7.2 ± 0.6 |
| 0.30 | 1.02 ± 0.04 | 0.41 ± 0.03 | −15.1 ± 0.2 | −8.71 ± 0.04 | 6.4 ± 0.4 |
| 0.45 | 1.02 ± 0.04 | 0.49 ± 0.04 | −15.8 ± 0.3 | −8.61 ± 0.04 | 7.2 ± 0.4 |
| 0.60 | 1.03 ± 0.06 | 0.50 ± 0.02 | −16.3 ± 0.2 | −8.60 ± 0.03 | 7.7 ± 0.4 |
| 0.75 | 1.02 ± 0.04 | 0.51 ± 0.03 | −15.8 ± 0.5 | −8.59 ± 0.04 | 7.2 ± 0.6 |
| 0.90 | 1.01 ± 0.04 | 0.52 ± 0.02 | −15.4 ± 0.4 | −8.57 ± 0.03 | 6.8 ± 0.6 |
Calculated from the relation ΔG° = RT ln(Kd).
Calculated from the relation ΔG° = ΔH° − TΔS°.
Effect of Temperature on the Binding Energetics Probed by ITC
To determine the effect of temperature on the BRCA1-BRCT–BACH1-P interaction, we performed calorimetric titrations from 10 to 45 °C. The variations of ΔG°, ΔH°, and ΔS° against temperature are plotted in Figure 3A, while Table S2 of the Supporting Information lists the values. At any given temperature, the binding of BRCA1-BRCT to BACH1-P is characterized by a large favorable enthalpy change and a small unfavorable entropy change. At 30 °C, we start to see nonlinearity of ΔH° and TΔS° with temperature and the stoichiometry n starts to deviate from 1. These observations cannot be explained by thermal denaturation of BRCA1-BRCT, for the DSC data indicate that thermal denaturation of BRCA1-BRCT starts to occur only above 42 °C in the absence of peptide and 47 °C in the presence of BACH1-P (Figure 1A). The deviation from linearity may be linked to coupled equilibria taking place upon formation of the complex.
Figure 3.
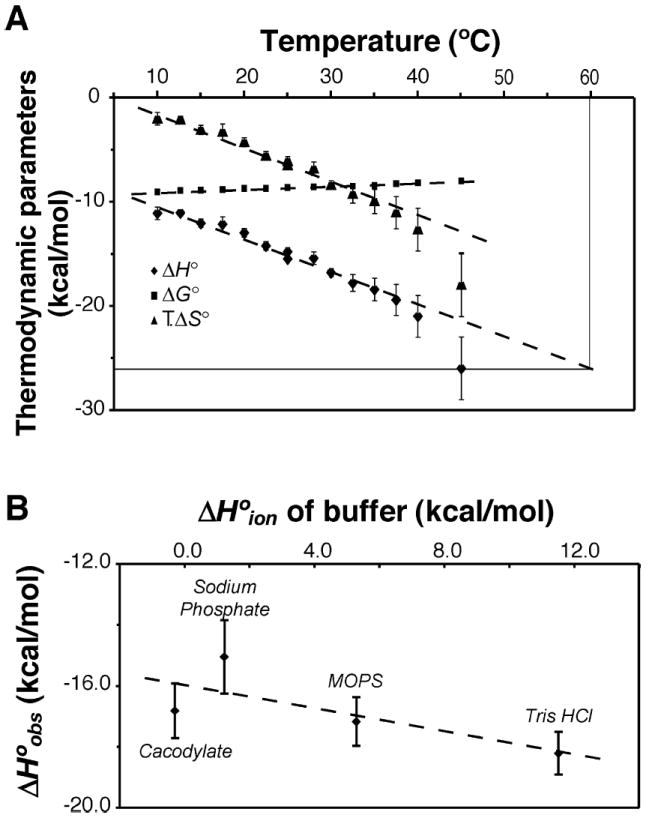
Effects of temperature and buffer on the thermodynamic parameters of BACH1-P binding to BRCA1-BRCT as determined by ITC. (A) BRCA1-BRCT and BACH1-P were in 50 mM sodium phosphate (pH 7.5) and 300 mM NaCl. Values of ΔH° (◆), ΔG° (■), and TΔS° (▲) are plotted as a function of temperature. Original data are presented in Table S2 of the Supporting Information. For the enthalpy dependence, the slope of the linear regression fit was used to derive a ΔCp value of −340 ± 30 cal K−1 mol−1. (B) The apparent binding enthalpy change (ΔH°obs) is plotted as a function of the ionization enthalpy (ΔH°ion) of buffers. All buffers contained 300 mM NaCl. The ΔH°ion values used in this experiment were as follows: −0.6 kcal/mol for cacodylate, 1.2 kcal/mol for sodium phosphate, 5.3 kcal/mol for MOPS, and 11.5 kcal/mol for Tris-HCl (59, 60). The number of protons linked to the reaction was obtained from the slope of the best-fit line, giving a value of −0.2 ± 0.1.
The Heat Capacity of the Reaction Is Inconsistent with the Value Determined from the 3D Structure of the BRCA1-BRCT–BACH1-P Complex
An estimate of the change in constant pressure heat capacity, ΔCp, upon formation of the BRCA1-BRCT–BACH1-P complex was determined from a plot of ΔH° as a function of temperature in the 10–30 °C range (Figure 3A) using the standard thermodynamic relationship:
| (3) |
The value of ΔCp derived by this method (ΔCp = −340 ± 30 cal mol−1 k−1) is similar to that obtained from fitting the inverse temperature dependency of log Kd using the integrated form of the van’t Hoff equation (ΔCp= − 280 ± 50 cal mol−1 K−1).
ΔCp can also be derived from 3D structures using an empirical relationship (32) based on the change in nonpolar (ΔAnp) and polar (ΔAp) surface areas that occurs upon formation of the complex (eq 4):
| (4) |
Although this formula was initially devised for protein folding processes, it also applies to protein–protein interactions (33). Using the crystal structure of the BRCA1-BRCT–BACH1-P complex [Protein Data Bank (PDB) entry 1T29 (17)] as well as the atomic coordinates of BRCA1-BRCT only from the same PDB entry, the changes in the buried nonpolar and polar surface areas at the protein–peptide interface upon formation of the complex were determined to be −386.4 and −278.1 Å2, respectively. These calculations were done with the algorithm of Lee and Richards (34) implemented in NACCESS. Using eq 4, we calculated a ΔCp value of −101 ± 16 cal mol−1 K−1, which deviates markedly from the values derived from the ITC experiments. Such a discrepancy in calculated versus observed ΔCp might be explained by taking into account the uptake or release of protons (35), or some other perturbations in the protein structure upon formation of the complex.
To clarify the effect of protonation, we conducted ITC experiments in four buffer solutions with different heats of ionization. The apparent binding enthalpies ΔH°obs were plotted against the ionization enthalpies of the buffers, ΔH°ion (Figure 3B), from which, following eq 5, we determined the intrinsic binding enthalpy (ΔH°bind) and npro, the molar number of protons taken up (positive) or released (negative) upon formation of the complex (33):
| (5) |
BACH1-P binding to BRCA1-BRCT exhibited a low number of protons released (npro = −0.2 ± 0.1); hence, a protonation effect does not explain the discrepancies in ΔCp. This finding prompted us to perform SPR-based measurements to investigate not only the thermodynamics but also the kinetics of the interaction.
Steady-State Analysis of the Interaction of BRCA1-BRCT with bBACH1-P by SPR
Biotinylated peptides immobilized on BIAcore CM3 neutravidin- or SA streptavidin-coated chips were used for the SPR experiments. We verified that the biotin moiety does not interfere with binding by measuring by ITC the dissociation constants of the interaction of BRCA1-BRCT with both biotinylated (bBACH1-P) and nonbiotinylated (BACH1-P) peptides. The Kd values obtained were similar: 0.23 ± 0.02 and 0.41 ± 0.03 μM, respectively.
Figure 4A shows sensorgrams resulting from the interaction of BRCA1-BRCT with biotinylated BACH1-P captured on the streptavidin surface of an SA chip. The peptide was first immobilized up to a level of ~20 RU. BRCA1-BRCT was then passed at a concentration of 1.6 μM over the bBACH1-P-coated chip surface. An increase in the magnitude of the response was observed, indicating that BRCA1-BRCT was binding bBACH1-P. In contrast, there was insignificant change in RU when BRCA1-BRCT was passed over the streptavidin surface without any peptide or with a biotinylated but nonphosphorylated peptide (bBACH1-NP), confirming the specificity of the interaction of BRCA1-BRCT with phosphorylated bBACH1.
Figure 4.

Steady-state analysis by SPR of the binding of BRCA1-BRCT to bBACH1-P. (A) Overlay plot of the kinetic analysis of BRCA1-BRCT binding to bBACH1-P at various concentrations of BRCA1-BRCT. BRCA1-BRCT (0.03–8 μM) in 50 mM sodium phosphate (pH 7.5) and 300 mM NaCl was injected for 4 min at a flow rate of 50 μL/min at 25 °C over a streptavidin surface without (reference) or with 25 RU of bBACH1-P and bBACH1-NP. The binding curves show RU as a function of time. (B) Effect of BRCA1-BRCT concentration on the steady-state equilibrium SPR response of bBACH1-P and bBACH1-NP at 10, 25, and 35 °C. The dissociation constants were calculated from the binding isotherms by nonlinear regression analysis using ORIGIN 7.0 and eq 2.
The sensorgrams attain a steady-state response during the association phase. This equilibrium response (Req) was recorded at multiple BRCA1-BRCT concentrations and used to determine the Kd for the interaction of BRCA1-BRCT with bBACH1-P (eq 2). Sample binding isotherms are shown in Figure 4B, from which at 25 °C a Kd of 0.33 ± 0.02 μM and an Rmax of 152 ± 3 RU were extracted. This Kd is in good agreement with the values obtained from ITC measurements (0.23 ± 0.02 and 0.41 ± 0.03 μM for BRCA1-BRCT in complex with bBACH1-P and BACH1-P peptides, respectively). Rmax, which represents the maximum capacity of the surface, also compares well with the theoretical maximum capacity (Rtheo) of 175 RU calculated using eq 1, indicating a stoichiometry of 1:1 for the BRCA1-BRCT–bBACH1-P interaction, similar to what was found in ITC experiments for the BRCA1-BRCT–BACH1-P interaction.
Salt and Temperature Dependence of BRCA1-BRCT–bBACH1-P Interaction Probed by SPR
To complement the ITC-based salt dependence study of the BRCA1-BRCT–BACH1-P interaction, we performed SPR steady-state analyses of the interaction of BRCA1-BRCT with bBACH1-P at four NaCl concentrations. All measurements were conducted with 15 RU of immobilized bBACH1-P on an SA sensor chip. Table 2 summarizes the results from fitting the data according to eq 2. The dissociation constants have values similar to those obtained from ITC. Furthermore, as shown using ITC, the SPR-derived dissociation constants do not appreciably depend on ionic strength.
Table 2.
Ionic Strength Dependence of the Vinding of BRCA1-BRCT to 22 RU of Immobilized bBACH1-P Determined by SPR in 50 mM Sodium Phosphate (pH 7.5) and 0.005% P20 at 25 °Ca
| [NaCl] (M) | Rmin (RU) | Rmax (RU) | Kd (μM) | Req/Rmax (%)b |
|---|---|---|---|---|
| 0.05 | −4 ± 7 | 235 ± 5 | 0.26 ± 0.03 | 94.1 |
| 0.30 | −4 ± 2 | 233 ± 3 | 0.35 ± 0.03 | 94.0 |
| 0.60 | −2 ± 3 | 223 ± 8 | 0.53 ± 0.04 | 89.2 |
| 0.90 | −0 ± 2 | 229 ± 10 | 0.56 ± 0.04 | 91.6 |
Steady-state parameters were obtained from data fitted to the Langmuir isotherm in terms of eq 2.
Ratio of the steady-state binding signal Req obtained for the highest BRCA1-BRCT concentration with the Rmax fitted value.
In Figure 5A, a plot of log Kd versus log[NaCl] exhibits a linear relationship according to eq 6:
Figure 5.
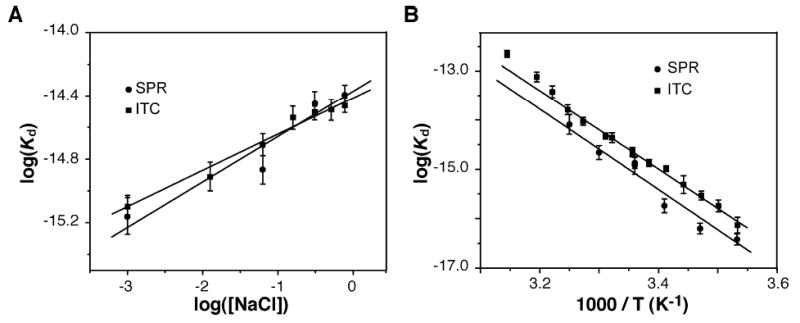
Comparison of equilibrium dissociation constants determined by ITC and SPR. (A) Effect of ionic strength on the binding of BRCA1-BRCT to BACH1-P. The log(Kd) is plotted vs log[NaCl] (in molar). Solid lines were drawn according to eq 6 with the best-fit parameter values of Γsalt of −0.22 ± 0.01 and −0.26 ± 0.06 obtained by ITC (■) and SPR (●), respectively. (B) Linear van’t Hoff plots of the BRCA1-BRCT–BACH1-P interaction for ITC (■) and SPR (●) data. Assuming a temperature-independent ΔH°, ΔH° was determined from the slope (=HvH/R) of the plot which is defined by the van’t Hoff equation ln(Kd) = ΔHvH/(RT) − ΔS°/R. From ITC and SPR data, ΔHvH = −15.1 ± 0.2 and −17.4 ± 1.6 kcal/mol, respectively. Correlation coefficients were 0.91 for SPR data, 0.96 for ITC data, and 0.99 for both when the data points at the three highest temperatures were removed from the fit. Original data are presented in Tables S3 and S4 of the Supporting Information. The linear fit was weighted using error bars (1/error2) with ORIGIN 7.0.
| (6) |
where the slope of the plot gives the phenomenological salt coefficient (Γsalt) (36). For ITC and SPR, Γsalt equals −0.22 ± 0.01 and −0.26 ± 0.06, respectively. According to several studies, one unit of absolute total charge gives a Γsalt value of −0.25 (36, 37). Thus, a Γsalt value of −0.22 implies that a net charge of ~1 is involved in the interaction. Extrapolation of the plot in Figure 5A to 1 M NaCl gives a Kd that can be used to calculate ΔG° (1 M NaCl), providing an estimate of the nonelectrostatic fraction of the binding energy. At 25 °C, ΔG° (1 M NaCl) is −8.5 kcal/mol. Even at this high salt concentration, the binding energy is more than 90% (8.5/8.7 × 100%) nonelectrostatic in nature, in agreement with the results from ITC that protonation has a negligible effect on the interaction of BRCA1-BRCT with BACH1-P.
Steady-state SPR experiments were also conducted at several temperatures. Figure 5B shows the van’t Hoff plots (ln Kd vs 1/T) determined from both ITC- and SPR-derived Kd values. There is a good agreement between the ΔH° values derived from the two data sets. The interaction is largely driven by a favorable enthalpy change. Table S3 of the Supporting Information summarizes the results of data fitting to eq 2.
Biphasic Behavior of BRCA1-BRCT–BACH1-P Interaction from SPR Data
The equilibrium dissociation constants derived from SPR are very similar to those obtained from ITC. However, the SPR sensorgrams are incompatible with a Langmuir model of the binding mechanism (Figure 4). A thorough design and analysis of the experiments, as well as the recording of multiple control experiments, led us to conclude that potential artifacts of the SPR measurements (24), such as mass transport during the association phase and rebinding of the protein during the dissociation phase, could not fully account for the deviation from the Langmuir model (see the Supporting Information for details).
Thus, the protein–peptide interaction mechanism is complex, and this is illustrated by the biphasic nature of association of BRCA1-BRCT with and dissociation of BRCA1-BRCT from the peptide-coated surface (Figure 6). The linearized SPR data for the protein association phase (i.e., plot of dR/dt vs R for each BRCA1-BRCT concentration) follow two discontinuous straight lines (Figure 6A). The linearization procedure is described in the Supporting Information. The first line has a steep slope and describes a fast reaction, while the other line has a more gradual slope and represents a slow reaction. The slopes of the fast and slow reactions are plotted against BRCA1-BRCT concentration in Figure 6B; while the former increases with BRCA1-BRCT concentration and then plateaus, the latter is essentially independent of BRCA1-BRCT concentration. The linearized SPR data for the protein dissociation phase (i.e., ln R vs time) can also be approximated by two straight lines with different slopes (Figure 6C).
Figure 6.
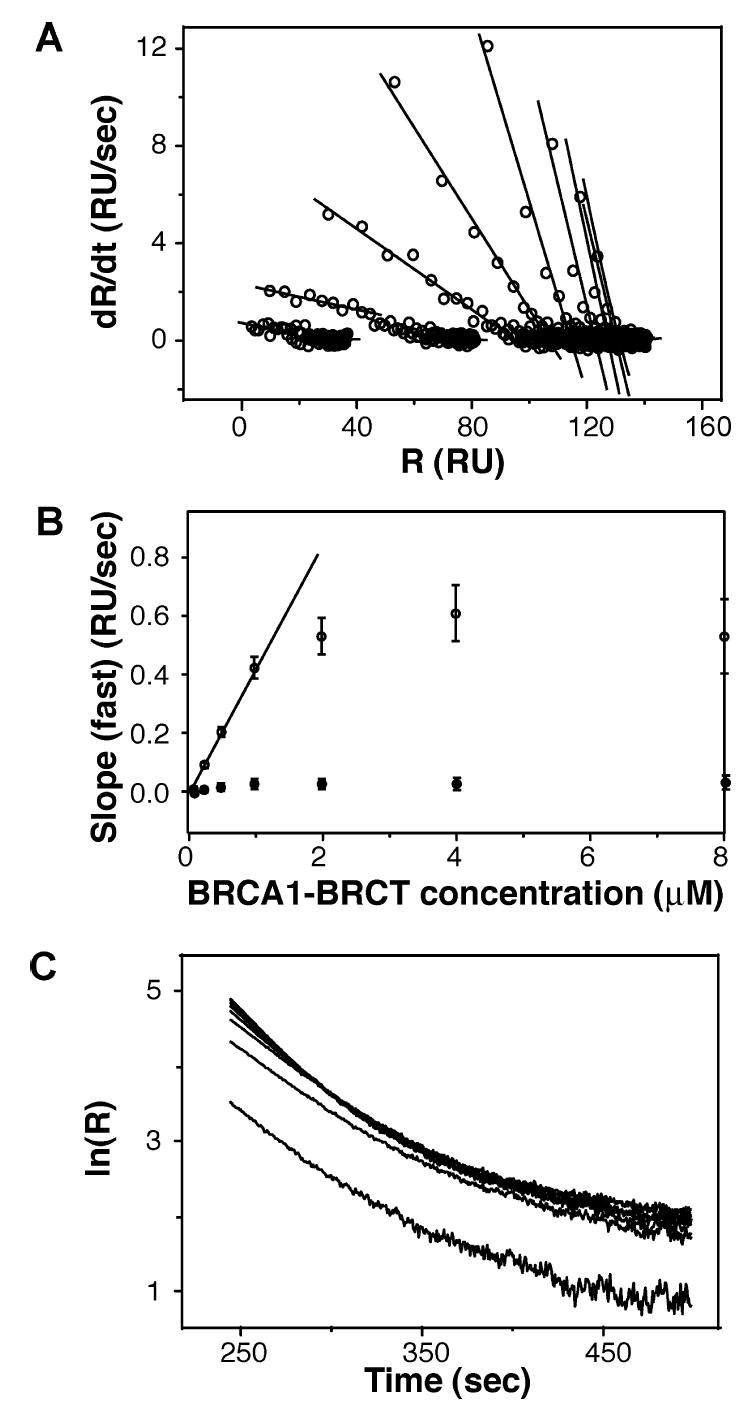
Linear analysis of the interaction of BRCA1-BRCT with immobilized bBACH1-P. (A) Linear transformation of the association phase was obtained by plotting dR/dt vs R. The plots fit two noncontinuous straight lines representing two distinct reactions, fast and slow. (B) Plot of the slopes from the fast and slow reactions in the association phase vs BRCA1-BRCT concentration. The first five data points of the fast reaction can be fitted to a linear model, providing a kon value of 0.4 × 10⁶ M−1 s−1. (C) Linear transformation of the dissociation phase obtained by plotting ln R vs time. The early part of the dissociation phase could be fitted to give a koff value of 0.02 s−1.
SFF Spectroscopy Confirms the Biphasic Nature of the BRCA1-BRCT–BACH1-P Interaction
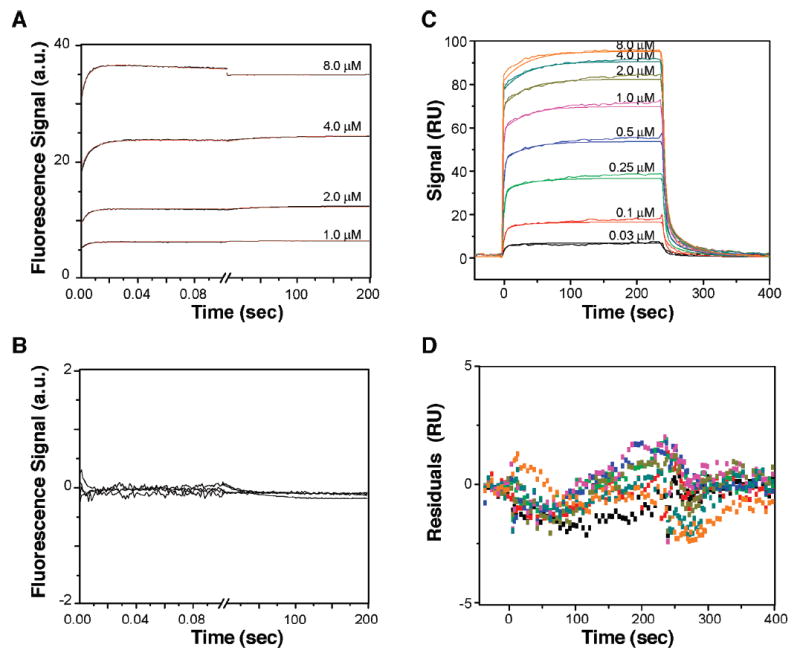
To independently verify the biphasic kinetic of BACH1-P binding to BRCA1-BRCT, this interaction was also probed using SFF spectroscopy. For this study, a dansyl group, an environmentally sensitive fluoroprobe, was attached to the N-terminus of BACH1-P (dBACH1-P) and the fluorescence anisotropy of the dansyl group was monitored. Recording fluorescence anisotropy for 4 μM dBACH1-P with increasing concentrations of BRCA1-BRCT produces an isotherm that fits eq s4 of the Supporting Information, which is specific for a 1:1 complex (Figure S1 of the Supporting Information). The apparent dissociation constant (Kd) was determined to be 0.18 ± 0.05 μM, which is similar to what was obtained from ITC experiments conducted with the bBACH1-P peptide (0.23 ± 0.02 μM) and the BACH1-P peptide (0.41 ± 0.03 μM), indicating that the dansyl group does not affect the interaction.
We first investigated the kinetics of BRCA1-BRCT binding to dBACH1-P under pseudo-first-order conditions with respect to BRCA1-BRCT concentration, i.e., where a large excess of BRCA1-BRCT was present inside the reaction chamber (Figure 7A). The fluorescence signal due to dilution of dBACH1-P into buffer is the same as the signal of the first data point obtained after the fluorescent peptide and the protein are mixed, indicating that there is no fluorescence decay during the dead time. The experimental curve for the association (and dissociation, as discussed below) is adequately described by a biexponential nonlinear least-squares fit (solid line) but not by a monoexponential fit (dashed line). Multiexponential functions with more than two exponentials did not improve the statistics of the fit (data not shown).
Figure 7.
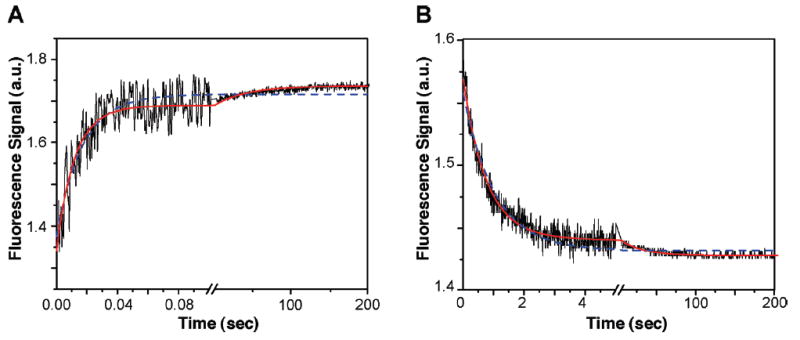
Binding kinetics of BRCA1-BRCT–dBACH1-P association as recorded by SFF spectroscopy. Experiments were conducted in 50 mM sodium phosphate (pH 7.5) and 300 mM NaCl at 25 °C (λexc = 332 nm; λem > 395 nm). (A) Stopped-flow fluorescence kinetic traces were recorded in two time bases, 0.1 and 200 s, after equal volumes of 0.5 μM dBACH1-P peptide and 5 μM BRCA1-BRCT (final concentrations) had been mixed. (B) Dissociation of the BRCA1-BRCT–dBACH1-P complex after addition of excess bBACH1-P recorded in two time bases, 5 and 200 s at 25 °C. The pre-equilibrated BRCA1-BRCT–dBACH1-P complex (5 μM BRCA1-BRCT and 1 μM dBACH1-P) was mixed at a 1:1 ratio (v/v) with a 20-fold excess of unlabeled bBACH1-P in the stopped-flow apparatus. Curves were fitted with ORIGIN 7.0 using nonlinear least-squares regression to an equation describing a monoexponential (---) or double-exponential (—) decay model. The constants obtained were averages of at least three individual traces fitted independently.
Next, we investigated the dissociation profile for the BRCA1-BRCT–dBACH1-P complex by displacement experiments, where an excess of dansyl-free bBACH1-P peptide was added to a preformed BRCA1-BRCT–dBACH1-P complex. The decrease in fluorescence intensity due to the dissociation of the complex is shown in Figure 7B. The association and dissociation curves indicate a biphasic process as seen in our SPR results (Figure 6C). Thus, we independently confirmed by SFF the biphasic nature of the BRCA1-BRCT–BACH1-P interaction.
A biphasic binding has usually been interpreted in terms of one or two limiting kinetic pathways. To improve our understanding of the interaction of BRCA1-BRCT with BACH1-P, we tested 11 models derived from binding mechanisms that include a two-step (dependent and independent) reaction. These models, designated A–K, are illustrated in Figure 8. Models A and B represent situations in which the analyte–ligand complex interacts with a second ligand and analyte, respectively. Model C involves an intermediate conformation of the complex. Models D and E assume two different populations of either the ligand in the matrix or the analyte in solution. Model F is characterized by an equilibrium between a monomeric protein and a dimeric protein, both forms being capable of interacting with the ligand. Model G is similar to model C but with an additional pathway. Model H considers an exchange between two forms of the analyte; one form interacts with the ligand to produce a complex that passes through a conformational change. Models I and J are similar to models D and E, respectively, but they additionally involve exchange between two species of the ligand (model I) or the analyte (model J). Model K describes two analyte populations interacting with the ligand to form respective complexes that are in exchange.
Figure 8.
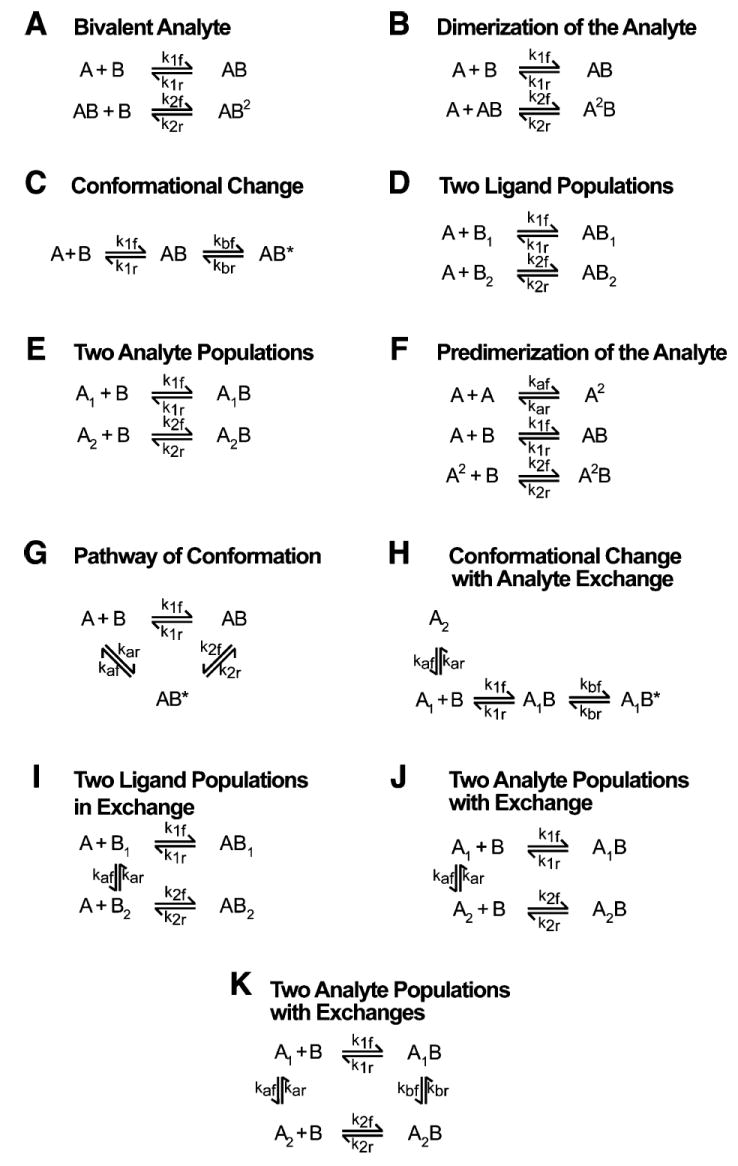
Models used to fit the SFF and SPR data. All models represent complex biological interaction mechanisms with respect to two dependent or independent reactions.
Selection of Models Compatible with SFF Data
We investigated by SFF the kinetics of BRCA1-BRCT binding over a range of BRCA1-BRCT concentrations (1–15 μM) and a single concentration (1 μM) of dBACH1-P. SFF data were analyzed globally by weighted nonlinear least-squares fitting using models A–K with a computer program developed in-house. The standard deviations for all models and selected residuals of the fitting are listed in Table 3A and shown in Figure 9, respectively. If a model adequately represents an interaction, the differences between experimental and predicted values, or residuals, are minimal and scattered around zero.
Table 3.
Overview of the Model Selection Criteria Obtained after Fitting SFF Data (see the text for details)
| (A) SFF experiments in which protein concentration varied
|
(B) SFF experiments in which peptide concentration varied
|
|||||||||
|---|---|---|---|---|---|---|---|---|---|---|
| model | STD | MSC | BIC | HQIC | TXK | STD | MSC | BIC | HQIC | TXK |
| A | 1.208 | 6.600 | 1.477 | 1.467 | 10.27 | 2.539 | 8.188 | 6.469 | 6.458 | 41 |
| B | 1.185 | 6.639 | 1.422 | 1.413 | 9.38 | 2.201 | 8.469 | 4.890 | 4.879 | 36 |
| C | 1.031 | 6.917 | 1.081 | 1.071 | 3.33 | 2.816 | 7.981 | 7.954 | 7.943 | 42 |
| D | 1.154 | 6.692 | 1.352 | 1.342 | 8.33 | 2.027 | 8.638 | 4.135 | 4.122 | 29 |
| E | 1.049 | 6.883 | 1.103 | 1.120 | 4.43 | 0.786 | 10.532 | 0.643 | 0.631 | 8 |
| F | 1.018 | 6.942 | 1.057 | 1.047 | 1.89 | 1.581 | 9.135 | 2.526 | 2.513 | 23 |
| G | 1.016 | 6.947 | 1.052 | 1.042 | 2.04 | 2.880 | 7.935 | 8.301 | 8.321 | 43 |
| H | 1.026 | 6.929 | 1.071 | 1.061 | 2.60 | 1.345 | 9.459 | 1.835 | 1.821 | 20 |
| I | 1.019 | 6.941 | 1.059 | 1.048 | 2.23 | 2.845 | 7.959 | 8.127 | 8.113 | 43 |
| J | 1.013 | 6.952 | 1.047 | 1.037 | 1.41 | 0.594 | 11.093 | 0.340 | 0.367 | −0.01 |
| K | 1.008 | 6.962 | 1.039 | 1.024 | n/a | 0.594 | 11.092 | 0.384 | 0.369 | n/a |
Figure 9.
Selected fits and residuals from nonlinear least-squares fitting of SFF data recorded for various protein concentrations. Fluorescence signals for 1 μM dBACH1-P mixed with different concentrations (0.5, 1, 2, 4, 6, 10, and 12 μM) of BRCA1-BRCT were recorded (black lines) and fitted with in-house software using model K (red lines). Residuals were obtained from the global analysis of time course traces using models A (A) and K (B) and then normalized (division by the errors) to compare both time bases simultaneously.
The standard deviation criterion (STD) and the sum of squares of the residuals (χ2) are parameters often used to compare models. In the case of the BRCA1-BRCT–BACH1-P interaction, however, the STD values for C and F–K models are fairly similar. Furthermore, the two models (A and K) with the most dissimilar STD values (Table 3A) do not show marked differences in the distribution of the residuals (Figure 9). Thus, additional selection criteria consisting of the modified Akaike information criterion (MSC), the Bayesian information criterion (BIC), and the Hannan-Quinn information criterion (HQIC) (see the Supporting Information for details) were used in the search for the most suitable model. The best model is expected to have the largest MSC and lowest BIC and HQIC values. On the basis of the MSC, BIC, and HQIC values for the different models reported in Table 3A, the best model would have to be model K. We note, however, that the values for model K are not very far from those of the other models, except models A and B, prompting us to include Zwanzig’s statistical selection criterion (38, 39) (see the Supporting Information for details) in our model search. Zwanzig’s statistical selection criterion allows direct comparison of two models, u and v. Accordingly, if Tuv > 1.96, model v is more appropriate than model u (with a significance level α = 0.05), and if |Tuv| ≤ 1.96, both models are equally appropriate. With a TAK of 10.27, Zwanzig’s criterion confirms that model A is not a good model for the SFF data compared to model K. On the other hand, the criterion clearly shows that models F and J (with a TFK of 1.89 and a TJK of 1.41) fit to the SFF data as well as model K does.
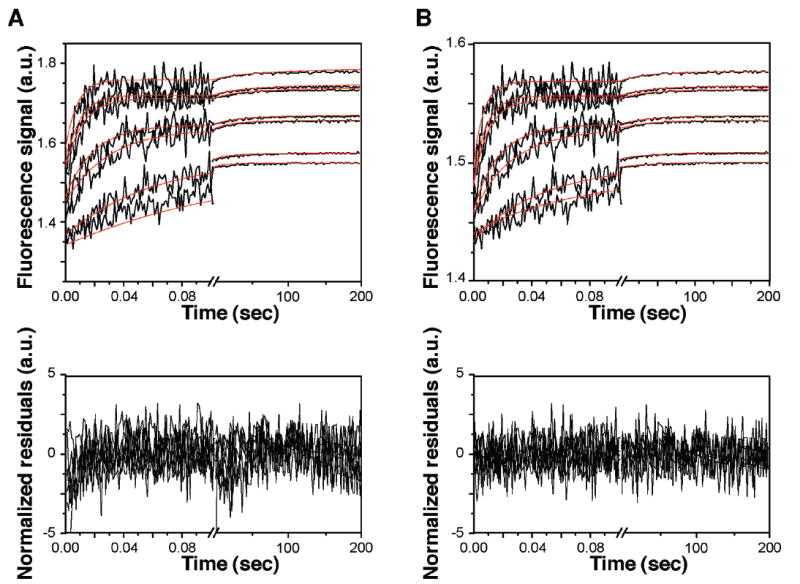
Conversely, we performed a series of SFF experiments in which different BACH1-P concentrations (1, 2, 4, and 8 μM) were used against a constant concentration of BRCA1-BRCT (1 μM). The SFF traces of BACH1-P fluorescence collected at 0.1 and 200 s time bases are shown in Figure 10A. A biphasic behavior is again observed, suggesting that the binding reaction proceeds in at least two independent or interdependent states. As before, the SFF data were analyzed globally by weighted nonlinear least-squares fitting using models A–K with the computer program that we developed. The values for the different selection criteria are listed in Table 3B. Accordingly, models J and K emerge as the best models for describing the interaction of BRCA1-BRCT and BACH1-P.
Figure 10.
Fits and residuals of SFF and SPR data. Buffer and temperature conditions are the same as those described in the legend of Figure 7. (A) SFF traces for four concentrations of dBACH1-P peptide mixed with 1 μM BRCA1-BRCT were recorded (black lines) and fitted with an in-house software using model J (red lines). (B) Residuals of the global fit shown in panel A. (C) Fit of SPR sensorgrams using model J. Eight BRCA1-BRCT concentrations, indicated near each curve, were injected over a surface with 15 RU of immobilized bBACH1-P peptide. Experimental data were zeroed in the RU and time dimensions, and then double-referenced with BIAevaluation 4.1. Curve fits were obtained with Clamp 3.50. Solid lines are the best global nonlinear least-squares fits of the experimental curves using model J. (D) Residuals of the global fit shown in panel C. For clarity, each SFF and SPR curve was reduced to 200 data points.
Compatibility of Model J to SPR and SPF Data
We reanalyzed our SPR data collected for eight concentrations of BRCA1-BRCT (0.03–8 μM) using the models (J and K) found to be most compatible with all the SFF data. Since Clamp 3.50 (26) can incorporate analyte exchange prior to ligand interaction, a common feature of the two models, Clamp 3.50 was used in the fitting. A mass transportation effect was also taken into account by forcing the mass transport constant kt to a value consistent with a monomeric species of BRCA1-BRCT. The rate constants obtained for the SFF data were used as starting values in the fitting of the SPR data. Values obtained for the STD, MSC, and TXK criteria as well as the fit results are summarized in Table 4. From these values, it becomes apparent that model J is more appropriate than model K in describing the interaction of BRCA1-BRCT and BACH1-P.
Table 4.
Global Analysis of the BRCA1-BRCT–BACH1-P Interaction Using Different Modelsa
| kaf (s−1) | kar (s−1) | k1f (μM−1 s−1) | k1r (s−1) | k2f (μM−1 s−1) | k2r (s−1) | kbf (s−1) | kbr (s−1) | r1 b (au) | r2 b (au) | r3 b (au) | STDc | MSCf | TXKg | |
|---|---|---|---|---|---|---|---|---|---|---|---|---|---|---|
| SFF Data with Protein Concentration Varied | ||||||||||||||
| F | 136d | 0.0023 | 1.79 | 0.0262 | 12.0 | 0.62 | n/a | n/a | 0.661 | 2 × 10⁻⁵ | 0.893 | 1.0183 | 6.9418 | 1.89 |
| 8d | 0.0001 | 0.07 | 0.0003 | 0.1 | 0.01 | 0.001 | 3 × 10⁻⁵ | 0.003 | ||||||
| J | 0.0015 | 0.19 | 10.3 | 1.22 | 0.13 | 0.0263 | n/a | n/a | 0.113 | 0.352 | 5.5 | 1.0133 | 6.9517 | 1.41 |
| 0.0003 | 0.02 | 0.1 | 0.05 | 0.05 | 0.0004 | 0.001 | 0.001 | 0.7 | ||||||
| K | 0.0019 | 0.062 | 10.5 | 0.91 | 1.6 | 4 × 10⁻⁵ | 0.0031 | 0.019 | 0.101 | 0.333 | 0.429 | 1.0080 | 6.9616 | n/a |
| 0.0002 | 0.005 | 0.1 | 0.04 | 0.1 | 1 × 10⁻³ | 0.0001 | 0.001 | 0.001 | 0.001 | 0.004 | ||||
| SFF Data with Peptide Concentration Varied | ||||||||||||||
| J | 3.6 × 10⁻⁶ | 2.2 × 10⁻⁴ | 0.299 | 0.020 | 48.3 | 9 × 10⁻⁸ | n/a | n/a | 2.73 | 1.71 | 4.799 | 0.5938 | 11.093 | −0.01 |
| 0.5 × 10⁻⁶ | 3 × 10⁻⁶ | 0.005 | 0.001 | 0.5 | 1 × 10⁻³ | 0.02 | 0.02 | 0.001 | ||||||
| K | 3.6 × 10⁻⁶ | 2.3 × 10⁻⁴ | 0.299 | 0.020 | 48.4 | 3 × 10⁻¹⁰ | 3 × 10⁻¹⁰ | 2.72 | 1.71 | 4.799 | 0.5938 | 11.092 | n/a | |
| 0.4 × 10⁻⁶ | 3 × 10⁻⁶ | 0.002 | 0.001 | 0.2 | 6 × 10⁻⁵ | 1 × 10⁻⁵ | 6 × 10⁻⁶ | 0.01 | 0.02 | 0.001 | ||||
|
| ||||||||||||||
| kaf (s−1) | kar (s−1) | k1f (μM−1 s−1) | k1r (s−1) | k2f (μM−1 s−1) | k2r (s−1) | kbf (s−1) | kbr (s−1) | kt e (RU s−1) | B0 (RU) | STDc | MSCf | TXKg | ||
|
| ||||||||||||||
| SPR Data | ||||||||||||||
| J | 0.0015 | 0.19 | 0.63 | 0.27 | 0.32 | 0.029 | n/a | n/a | 6.1 ×10⁸ | 100 | 1.55 | 6.0 | −2.0 | |
| 0h | 0h | 0.06 | 0.03 | 0.04 | 0.005 | 0.0h | 1 × 10⁴ | |||||||
| K | 0.0019 | 0.062 | 0.67 | 0.28 | 0.0 | 8 × 10⁻³ | 1 × 10⁻³ | 0.02 | 6.1 ×10⁸ | 100 | 1.59 | 5.5 | n/a | |
| 0h | 0h | 0.02 | 0.02 | 0.1 | 1 | 1 × 10⁻³ | 1 | 0.0h | 75 | |||||
Fitted parameters are only presented for models that are adequate. In-house software was used to fit SFF data. SFF data were generated by mixing several concentrations of BRCA1-BRCT (final concentrations between 0.5 and 18 μM) with a final constant concentration of dBACH1-P of 1 μM. Clamp 3.50 was used to fit SPR data. SPR data were generated by injecting eight concentrations of BRCA1-BRCT (0.03–8 μM) over a surface coated with 15 RU of biotinylated BACH1-P. Parameter values (first lines) and errors (second lines) for each model were deduced from a Monte Carlo analysis (see the Supporting Information).
r1, r2, and r3 correspond to the fluorescence amplitude of each species (B, A1B, and A2B, respectively).
Residual standard deviations (STDs) for SFF data were calculated using in-house software, while Clamp was used for SPR data.
Units for this reaction are μM−1 s−1.
The mass transport constant kt was determined using Clamp, assuming a monomeric species of BRCA1-BRCT.
The MSC parameter corresponds to the modified Akaike selection criterion.
The TXI parameter corresponds to Zwanzig’s statistical model selection criterion.
Parameters for which the error is equal to zero were not allowed to vary during the fit to ensure convergence.
Panels A and B of Figure 10 display the global fitting and residuals of the SFF time course traces for each of the four dBACH1-P concentrations using model J. Using the same model, the global fitting and residuals of the SPR data recorded for each of the eight BRCA1-BRCT concentrations are shown in panels C and D of Figure 10. These plots illustrate the excellent agreement between experimental and modeled data, with a quasi-random distribution of residuals with very low amplitudes. Taking all these observations into account, model J is the most appropriate model for describing the BRCA1-BRCT–BACH1-P interaction.
DISCUSSION
Complementary to the 3D structures of BRCA1-BRCT in the free state and in complex with BACH1-P that revealed one conformation only for BRCA1-BRCT (7, 16, 17), the kinetic and thermodynamic characterizations presented here provide direct evidence that the phosphopeptide binding mechanism of BRCA1-BRCT is more complex than a simple 1:1 Langmuir binding mode. Initially, we noted a marked discrepancy between measured ΔCp and ΔCp calculated empirically from 3D structures that suggested a complex binding mode (40, 41). In general, a good agreement between measured and theoretical ΔCp values holds true for interactions that conform to a rigid-body binding model (42, 43). In this case, deviation from the theoretical ΔCp value can sometimes be explained by the protonation of ionizable amino acids of the protein or ligand, or both, not being properly taken into account (44-46). ITC and steady-state SPR experiments probing the interaction of BRCA1-BRCT with a phosphorylated BACH1 peptide done in four different buffers with varying ionization enthalpies and under increasing NaCl and KCl concentrations show that peptide binding is not appreciably linked to the protonation of ionizable groups in the protein or peptide, and thus, these experiments rule out a protonation effect to explain the discrepancy between measured and theoretical ΔCp values.
The nonlinearity of ΔH° and TΔS° as determined by ITC and SPR at equilibrium is another indication of a complex binding mechanism suggesting that linked conformational equilibria drive the interaction and that a rigid-body binding model does not apply to the BRCA1-BRCT–BACH1-P interaction. This observation is consistent with the biexponential kinetics of association and dissociation revealed by SPR. However, drawing meaningful conclusions from non-Langmuir SPR kinetic data can be difficult, for one must ensure that the anomalous kinetics of binding is not due to experimental artifacts common to surface-based measurements (47). Thus, all kinetic measurements were recorded under experimental conditions that minimize mass transport, steric hindrance, molecular crowding, and analyte rebinding, and several control experiments were conducted, from which we concluded that while the complexity of the SPR binding curves might be partially due to residual mass transport effect, the biexponential kinetics of association and dissociation could not be fully explained by nonoptimal experimental conditions. This conclusion was independently supported by a stopped-flow fluorescence study of the same interaction, with protein and peptide in solution, that shows similar biphasic kinetics of BRCA1-BRCT–BACH1-P association and dissociation. The two approaches are complementary as SPR probes the adsorption of BRCA1-BRCT on a BACH1-P peptide-coated surface while stopped-flow fluorescence probes a dye-labeled BACH1-P peptide for its binding to BRCA1-BRCT.
Eleven models were invoked to explain the biphasic kinetics of BRCA1-BRCT–BACH1-P interaction as manifested in both the SPR and SFF data. Although selection criteria were applied to all 11 models, four models were clearly inconsistent with a number of experimental results and could be easily discarded. The models reflecting analyte or ligand dimerization after complex formation (models A and B) were ruled out on the basis of a poor fit to experimental data and results of analytical ultracentrifugation showing that there is no multimerization of BRCA1-BRCT in the free or peptide-bound state. Model E was likewise discarded as it invokes analyte heterogeneity that may arise from the coexistence of monomeric and multimeric forms of BRCA1-BRCT or from two conformations of BRCA1-BRCT in the free state, but analytical ultracentrifugation results are inconsistent with dimerization or a higher degree of multimerization. Model D implies heterogeneity of the ligand, which might arise from the peptide proline cis–trans isomerization previously suggested from NMR spectroscopy experiments (12).SPR experiments recorded with a bBACH1-P peptide in which an alanine replaces the proline gave sensorgrams that can be superimposed with those obtained using the wild-type bBACH1-P peptide (data not shown). This showed that proline isomerization was not the cause of the biphasic association and dissociation signals, making model D unlikely to explain the experimental data. Using STD, residuals, MSC, BIC, HQIC, and the Zwanzig selection criteria on all models, ultimately we picked model J to be the best model matching all experimental data.
The equilibrium exchange between the two conformations of BRCA1-BRCT in the free state (A1 and A2) is described by the following rate constants: kaf = 2 × 10⁻³ to 2 × 10⁻⁶ s−1, and kar = 0.2 to 2 × 10⁻⁴ s−1. Such a conformational exchange might explain the observation of resonance line broadening in the 1H–15N NMR correlation spectra of BRCA1-BRCT (12), although a slower kinetic exchange would be expected.
Several observations suggest that the two conformations of BRCA1-BRCT may result from distinct stacking interactions of the two BRCT domains. In agreement with this idea, the 23-residue inter-BRCT linker region is poorly defined in the electron density of the 2.5 Å resolution structure of BRCA1-BRCT (7) and the 3D structure of the isolated C-terminal BRCT domain is unchanged compared to the same domain in the context of the tandem repeats (48). Furthermore, the GdmCl denaturation profile of free BRCA1-BRCT tandem repeats shows two transitions (Figure 2A), unlike the single transition observed in the denaturation profile of the isolated C-terminal BRCT domain of BRCA1 (BRCA1-BRCT-ct) (Figure 2A). Thus, we speculate that the minimum fluorescence emission wavelength detected at 2.25 mM GdmCl for the tandem BRCT domains might be due to an intermediate species corresponding to a change in the relative orientation of the two BRCT domains. At higher GdmCl concentrations, the individual BRCT domains unfold.
Also consistent with interdomain flexibility leading to two distinct stacking interactions of the BRCT domains are the slightly different dissociation constants determined for the two conformations, A1 and A2, of BRCT1-BRCT when binding data are analyzed with model J. Differences in affinity are expected as a key conserved aromatic residue of the phosphopeptide (phenylalanine 993 in BACH1) binds a hydrophobic pocket at the interface of the two BRCT domains. For conformation A1, the dissociation constant Kd1 (=k1r/k1f) is 0.43 ± 0.07 μM when derived from SPR experiments and 0.11 ± 0.01 μM when derived from SFF experiments recorded under conditions where the protein concentration was varied. For conformation A2, Kd2 (=k2r/k2f) is 0.09 ± 0.03 μM for SPR experiments and 0.20 ± 0.08 μM for SFF experiments recorded under conditions where the protein concentration was varied. It should also be noted that with an equilibrium constant K1 (=kaf/kar) of 125 ± 40, more than 99% of the conformations are in the A1 state and less than 1% in the A2 state. When considering the reaction A2 ↔ A1 + B ↔ A1B, the apparent dissociation constant for the main conformation of BRCA1-BRCT, A1, can be expressed as Kd1app1 = Kd1(1 + [A2]/[A1]) (49) or Kd1app1 ≈ Kd1 as the value of [A2]/[A1] becomes negligible. It is noticeable that the values of Kd1app1 (0.43 ± 0.07 μM when derived from SPR and 0.11 ± 0.01 μM when derived from SFF) are in excellent agreement with the values determined at equilibrium, by either steady-state SPR experiments (Kd = 0.33 ± 0.02 μM), fluorescence anisotropy (Kd = 0.18 ± 0.05 μM), or ITC (Kd = 0.41 ± 0.03 μM). This further supports the choice of model J for describing the binding mechanism.
The conformational flexibility of the tandem BRCT domains may facilitate the interaction of BRCA1 with its multiple known phosphoprotein binding partners (11, 14, 50-53). For comparison with BACH1-P, we also probed the SPR kinetics of interaction of another phosphopeptide derived from the transcriptional corepressor CtIP, an alternative target of BRCA1 (14, 54). While CtIP has an ~5-fold lower affinity than BACH1-P (Kd = 1.3 ± 0.1 μM), in this case again the kinetics of association of the peptide to and dissociation of the peptide from BRCA1-BRCT are biphasic (data not shown), suggesting that the intrinsic conformational dynamics of BRCA1-BRCT determines its capacity to bind different phosphopeptide sequences.
In summary, by undertaking a thermodynamic and kinetic study of the interaction of BRCA1 tandem BRCT domains with phosphopeptides, we have derived a complex mechanism in which two conformations of BRCA1-BRCT bind a phosphopeptide. By providing a dynamic view of the interaction, in the future, our results may help correlate some of the mutations in BRCA1-BRCT with tumor formation. Analysis of the 3D structure of the BRCA1-BRCT–BACH1-P complex has explained the effect of a limited number of missense mutations, those that directly perturb the phosphopeptide binding interface (55). While a number of amino acid substitutions lead to destabilization or unfolding of BRCA1-BRCT (56-58), other mutations may affect the binding of phosphorylated targets in a more subtle way by altering the equilibrium exchange between the two conformations of BRCA1-BRCT. More work is needed to test this hypothesis.
Supplementary Material
Experimental details relating to SPR and SFF, description of the modified Akaike criterion, the Bayesian information criterion (BIC), the Hannan-Quinn information criterion (HQIC), and Zwanzig’s model selection criterion, one figure, and three tables. This material is available free of charge via the Internet at http://pubs.acs.org.
Acknowledgments
We thank Patricia Caffes and Jane Peterson for peptide synthesis and purification, Chetan Offord for help in software development, and Dr. Franklyn Prendergast for giving us access to a differential scanning calorimeter.
Footnotes
This research was supported by Grant R01 CA109449 from the National Institutes of Health to G.M. and by a Kendall-Mayo postdoctoral fellowship in biochemistry to Y.N.
Abbreviations: BRCA1-BRCT, tandem BRCT domains of BRCA1; BACH1-P, phosphorylated BACH1 peptide; bBACH1-P, biotin-tagged BACH1-P; dBACH1-P, dansyl-tagged BACH1-P; ITC, isothermal titration calorimetry; DSC, differential scanning calorimetry; SPR, surface plasmon resonance; SFF, stopped-flow fluorescence.
References
- 1.Friedman LS, Ostermeyer EA, Szabo CI, Dowd P, Lynch ED, Rowell SE, King MC. Confirmation of BRCA1 by analysis of germline mutations linked to breast and ovarian cancer in ten families. Nat Genet. 1994;8:399–404. doi: 10.1038/ng1294-399. [DOI] [PubMed] [Google Scholar]
- 2.Gudmundsdottir K, Ashworth A. The roles of BRCA1 and BRCA2 and associated proteins in the maintenance of genomic stability. Oncogene. 2006;25:5864–5874. doi: 10.1038/sj.onc.1209874. [DOI] [PubMed] [Google Scholar]
- 3.Mullan PB, Quinn JE, Harkin DP. The role of BRCA1 in transcriptional regulation and cell cycle control. Oncogene. 2006;25:5854–5863. doi: 10.1038/sj.onc.1209872. [DOI] [PubMed] [Google Scholar]
- 4.Brzovic PS, Rajagopal P, Hoyt DW, King MC, Klevit RE. Structure of a BRCA1-BARD1 heterodimeric RING-RING complex. Nat Struct Biol. 2001;8:833–837. doi: 10.1038/nsb1001-833. [DOI] [PubMed] [Google Scholar]
- 5.Brzovic PS, Keeffe JR, Nishikawa H, Miyamoto K, Fox D, III, Fukuda M, Ohta T, Klevit R. Binding and recognition in the assembly of an active BRCA1/BARD1 ubiquitin-ligase complex. Proc Natl Acad Sci U S A. 2003;100:5646–5651. doi: 10.1073/pnas.0836054100. [DOI] [PMC free article] [PubMed] [Google Scholar]
- 6.Eakin CM, Maccoss MJ, Finney GL, Klevit RE. Estrogen receptor R is a putative substrate for the BRCA1 ubiquitin ligase. Proc Natl Acad Sci U S A. 2007;104:5794–5799. doi: 10.1073/pnas.0610887104. [DOI] [PMC free article] [PubMed] [Google Scholar]
- 7.Williams RS, Green R, Glover JN. Crystal structure of the BRCT repeat region from the breast cancer-associated protein BRCA1. Nat Struct Biol. 2001;8:838–842. doi: 10.1038/nsb1001-838. [DOI] [PubMed] [Google Scholar]
- 8.Mark WY, Liao JC, Lu Y, Ayed A, Laister R, Szymczyna B, Chakrabartty A, Arrowsmith CH. Characterization of segments from the central region of BRCA1: An intrinsically disordered scaffold for multiple protein-protein and protein-DNA interactions? J Mol Biol. 2005;345:275–287. doi: 10.1016/j.jmb.2004.10.045. [DOI] [PubMed] [Google Scholar]
- 9.Takahashi H, Behbakht K, McGovern PE, Chiu HC, Couch FJ, Weber BL, Friedman LS, King MC, Furusato M, LiVolsi VA, Menzin AW, Liu PC, Benjamin I, Morgan MA, King SA, Rebane BA, Cardonick A, Mikuta JJ, Rubin SC, Boyd J. Mutation analysis of the BRCA1 gene in ovarian cancers. Cancer Res. 1995;55:2998–3002. [PubMed] [Google Scholar]
- 10.Cantor SB, Bell DW, Ganesan S, Kass EM, Drapkin R, Grossman S, Wahrer DC, Sgroi DC, Lane WS, Haber DA, Livingston DM. BACH1, a novel helicase-like protein, interacts directly with BRCA1 and contributes to its DNA repair function. Cell. 2001;105:149–160. doi: 10.1016/s0092-8674(01)00304-x. [DOI] [PubMed] [Google Scholar]
- 11.Yu X, Chini CC, He M, Mer G, Chen J. The BRCT domain is a phospho-protein binding domain. Science. 2003;302:639–642. doi: 10.1126/science.1088753. [DOI] [PubMed] [Google Scholar]
- 12.Botuyan MV, Nominé Y, Yu X, Juranic N, Macura S, Chen J, Mer G. Structural basis of BACH1 phosphopeptide recognition by BRCA1 tandem BRCT domains. Structure. 2004;12:1137–1146. doi: 10.1016/j.str.2004.06.002. [DOI] [PMC free article] [PubMed] [Google Scholar]
- 13.Manke IA, Lowery DM, Nguyen A, Yaffe MB. BRCT repeats as phosphopeptide-binding modules involved in protein targeting. Science. 2003;302:636–639. doi: 10.1126/science.1088877. [DOI] [PubMed] [Google Scholar]
- 14.Yu X, Chen J. DNA damage-induced cell cycle checkpoint control requires CtIP, a phosphorylation-dependent binding partner of BRCA1 C-terminal domains. Mol Cell Biol. 2004;24:9478–9486. doi: 10.1128/MCB.24.21.9478-9486.2004. [DOI] [PMC free article] [PubMed] [Google Scholar]
- 15.Yu X, Fu S, Lai M, Baer R, Chen J. BRCA1 ubiquitinates its phosphorylation-dependent binding partner CtIP. Genes Dev. 2006;20:1721–1726. doi: 10.1101/gad.1431006. [DOI] [PMC free article] [PubMed] [Google Scholar]
- 16.Clapperton JA, Manke IA, Lowery DM, Ho T, Haire LF, Yaffe MB, Smerdon SJ. Structure and mechanism of BRCA1 BRCT domain recognition of phosphorylated BACH1 with implications for cancer. Nat Struct Mol Biol. 2004;11:512–518. doi: 10.1038/nsmb775. [DOI] [PubMed] [Google Scholar]
- 17.Shiozaki EN, Gu L, Yan N, Shi Y. Structure of the BRCT repeats of BRCA1 bound to a BACH1 phosphopeptide: Implications for signaling. Mol Cell. 2004;14:405–412. doi: 10.1016/s1097-2765(04)00238-2. [DOI] [PubMed] [Google Scholar]
- 18.Williams RS, Lee MS, Hau DD, Glover JN. Structural basis of phosphopeptide recognition by the BRCT domain of BRCA1. Nat Struct Mol Biol. 2004;11:519–525. doi: 10.1038/nsmb776. [DOI] [PubMed] [Google Scholar]
- 19.Varma AK, Brown RS, Birrane G, Ladias JA. Structural basis for cell cycle checkpoint control by the BRCA1-CtIP complex. Biochemistry. 2005;44:10941–10946. doi: 10.1021/bi0509651. [DOI] [PubMed] [Google Scholar]
- 20.Karlsson R, Roos H, Bruno J, Stolz L. Practical aspects concerning direct detection of low molecular weight analytes using BIACORE 2000. BIA J. 1997:18–21. [Google Scholar]
- 21.Glaser RW. Antigen-antibody binding and mass transport by convection and diffusion to a surface: A two-dimensional computer model of binding and dissociation kinetics. Anal Biochem. 1993;213:152–161. doi: 10.1006/abio.1993.1399. [DOI] [PubMed] [Google Scholar]
- 22.Hall D. Use of optical biosensors for the study of mechanistically concerted surface adsorption processes. Anal Biochem. 2001;288:109–125. doi: 10.1006/abio.2000.4851. [DOI] [PubMed] [Google Scholar]
- 23.Myszka D. Improving biosensor analysis. J Mol Recognit. 1999;12:279–284. doi: 10.1002/(SICI)1099-1352(199909/10)12:5<279::AID-JMR473>3.0.CO;2-3. [DOI] [PubMed] [Google Scholar]
- 24.O’Shannessy DJ, Winzor DJ. Interpretation of deviations from pseudo-first-order kinetic behavior in the characterization of ligand binding by biosensor technology. Anal Biochem. 1996;236:275–283. doi: 10.1006/abio.1996.0167. [DOI] [PubMed] [Google Scholar]
- 25.Morton TA, Myszka DG. Kinetic analysis of macromolecular interactions using surface plasmon resonance biosensors. Methods Enzymol. 1998;295:268–294. doi: 10.1016/s0076-6879(98)95044-3. [DOI] [PubMed] [Google Scholar]
- 26.Myszka D, Morton T. CLAMP: A biosensor kinetic data analysis program. Trends Biochem Sci. 1998;23:149–150. doi: 10.1016/s0968-0004(98)01183-9. [DOI] [PubMed] [Google Scholar]
- 27.Offord C, Bajzer Z. A hybrid global optimization algorithm involving simplex and inductive search. Computational Science 194 Iccs 2001, Proceedings Part 2. 2001;2074:680–688. [Google Scholar]
- 28.Petzold L. Automatic selection of methods for solving stiff and non-stiff systems of ordinary differential equations. J Sci Stat Comput. 1983;4:136–148. [Google Scholar]
- 29.Pyrpassopoulos S, Ladopoulou A, Vlassi M, Papanikolau Y, Vorgias C, Yannoukakos D, Nounesis G. Thermal denaturation of the BRCT tandem repeat region of human tumour suppressor gene product BRCA1. Biophys Chem. 2005;114:1–12. doi: 10.1016/j.bpc.2004.09.014. [DOI] [PubMed] [Google Scholar]
- 30.Ekblad CM, Wilkinson HR, Schymkowitz JW, Rousseau F, Freund SM, Itzhaki LS. Characterisation of the BRCT domains of the breast cancer susceptibility gene product BRCA1. J Mol Biol. 2002;320:431–442. doi: 10.1016/s0022-2836(02)00478-3. [DOI] [PubMed] [Google Scholar]
- 31.Wiseman T, Williston S, Brandts J, Lin L. Rapid measurement of binding constants and heats of binding using a new titration calorimeter. Anal Biochem. 1989;179:131–137. doi: 10.1016/0003-2697(89)90213-3. [DOI] [PubMed] [Google Scholar]
- 32.Murphy K, Xie D, Garcia K, Amzel L, Freire E. Structural energetics of peptide recognition: Angiotensin II/antibody binding. Proteins. 1993;15:113–120. doi: 10.1002/prot.340150203. [DOI] [PubMed] [Google Scholar]
- 33.Gomez J, Freire E. Thermodynamic mapping of the inhibitor site of the aspartic protease endothiapepsin. J Mol Biol. 1995;252:337–350. doi: 10.1006/jmbi.1995.0501. [DOI] [PubMed] [Google Scholar]
- 34.Lee B, Richards F. The interpretation of protein structures: Estimation of static accessibility. J Mol Biol. 1971;55:379–400. doi: 10.1016/0022-2836(71)90324-x. [DOI] [PubMed] [Google Scholar]
- 35.Stites W. Protein-protein interactions: Interface structure, binding thermodynamics, and mutational analysis. Chem Rev. 1997;97:1233–1250. doi: 10.1021/cr960387h. [DOI] [PubMed] [Google Scholar]
- 36.Guinto E, Di Cera E. Large heat capacity change in a protein-monovalent cation interaction. Biochemistry. 1996;35:8800–8804. doi: 10.1021/bi9608828. [DOI] [PubMed] [Google Scholar]
- 37.Vindigni A, White C, Komives E, Di Cera E. Energetics of thrombin-thrombomodulin interaction. Biochemistry. 1997;36:6674–6681. doi: 10.1021/bi962766a. [DOI] [PubMed] [Google Scholar]
- 38.Zwanzig S. The choice of approximative models in nonlinear regression. Statistics. 1980;11:23–47. [Google Scholar]
- 39.Buckwitz D, Holzhutter H-G. A new method to discriminate between enzyme-kinetic models. Comp Math Appl. 1990;20:117–126. [Google Scholar]
- 40.Prabhu NV, Sharp KA. Heat capacity in proteins. Annu Rev Phys Chem. 2005;56:521–548. doi: 10.1146/annurev.physchem.56.092503.141202. [DOI] [PubMed] [Google Scholar]
- 41.Ely LK, Beddoe T, Clements CS, Matthews JM, Purcell AW, Kjer-Nielsen L, McCluskey J, Rossjohn J. Disparate thermodynamics governing T cell receptor-MHC-I interactions implicate extrinsic factors in guiding MHC restriction. Proc Natl Acad Sci U S A. 2006;103:6641–6646. doi: 10.1073/pnas.0600743103. [DOI] [PMC free article] [PubMed] [Google Scholar]
- 42.Janin J. Elusive affinities. Proteins. 1995;21:30–39. doi: 10.1002/prot.340210105. [DOI] [PubMed] [Google Scholar]
- 43.Baker BM, Murphy KP. Prediction of binding energetics from structure using empirical parameterization. Methods Enzymol. 1998;295:294–315. doi: 10.1016/s0076-6879(98)95045-5. [DOI] [PubMed] [Google Scholar]
- 44.Baker BM, Murphy KP. Evaluation of linked protonation effects in protein binding reactions using isothermal titration calorimetry. Biophys J. 1996;71:2049–2055. doi: 10.1016/S0006-3495(96)79403-1. [DOI] [PMC free article] [PubMed] [Google Scholar]
- 45.Makhatadze GI, Lopez MM, Privalov PL. Heat capacities of protein functional groups. Biophys Chem. 1997;64:93–101. doi: 10.1016/s0301-4622(96)02234-x. [DOI] [PubMed] [Google Scholar]
- 46.Nguyen B, Stanek J, Wilson WD. Binding-linked protonation of a DNA minor-groove agent. Biophys J. 2006;90:1319–1328. doi: 10.1529/biophysj.105.071381. [DOI] [PMC free article] [PubMed] [Google Scholar]
- 47.Day YS, Baird CL, Rich RL, Myszka DG. Direct comparison of binding equilibrium, thermodynamic, and rate constants determined by surface- and solution-based biophysical methods. Protein Sci. 2002;11:1017–1025. doi: 10.1110/ps.4330102. [DOI] [PMC free article] [PubMed] [Google Scholar]
- 48.Gaiser OJ, Ball LJ, Schmieder P, Leitner D, Strauss H, Wahl M, Kuhne R, Oschkinat H, Heinemann U. Solution structure, backbone dynamics, and association behavior of the C-terminal BRCT domain from the breast cancer-associated protein BRCA1. Biochemistry. 2004;43:15983–15995. doi: 10.1021/bi049550q. [DOI] [PubMed] [Google Scholar]
- 49.Winzor DJ, Jackson CM. Interpretation of the temperature dependence of equilibrium and rate constants. J Mol Recognit. 2006;19:389–407. doi: 10.1002/jmr.799. [DOI] [PubMed] [Google Scholar]
- 50.Wang B, Matsuoka S, Ballif BA, Zhang D, Smogorzewska A, Gygi SP, Elledge SJ. Abraxas and RAP80 form a BRCA1 protein complex required for the DNA damage response. Science. 2007;316:1194–1198. doi: 10.1126/science.1139476. [DOI] [PMC free article] [PubMed] [Google Scholar]
- 51.Liu Z, Wu J, Yu X. CCDC98 targets BRCA1 to DNA damage sites. Nat Struct Mol Biol. 2007;14:716–720. doi: 10.1038/nsmb1279. [DOI] [PubMed] [Google Scholar]
- 52.Ray H, Moreau K, Dizin E, Callebaut I, Venezia ND. ACCA phosphopeptide recognition by the BRCT repeats of BRCA1. J Mol Biol. 2006;359:973–982. doi: 10.1016/j.jmb.2006.04.010. [DOI] [PubMed] [Google Scholar]
- 53.Lokesh GL, Muralidhara BK, Negi SS, Natarajan A. Thermodynamics of phosphopeptide tethering to BRCT: The structural minima for inhibitor design. J Am Chem Soc. 2007;129:10658–10659. doi: 10.1021/ja0739178. [DOI] [PubMed] [Google Scholar]
- 54.Yu X, Baer R. Nuclear localization and cell cycle-specific expression of CtIP, a protein that associates with the BRCA1 tumor suppressor. J Biol Chem. 2000;275:18541–18549. doi: 10.1074/jbc.M909494199. [DOI] [PubMed] [Google Scholar]
- 55.Karchin R, Monteiro AN, Tavtigian SV, Carvalho MA, Sali A. Functional impact of missense variants in BRCA1 predicted by supervised learning. PLoS Comput Biol. 2007;3:e26. doi: 10.1371/journal.pcbi.0030026. [DOI] [PMC free article] [PubMed] [Google Scholar]
- 56.Williams RS, Glover JN. Structural consequences of a cancer-causing BRCA1-BRCT missense mutation. J Biol Chem. 2003;278:2630–2635. doi: 10.1074/jbc.M210019200. [DOI] [PubMed] [Google Scholar]
- 57.Williams RS, Chasman DI, Hau DD, Hui B, Lau AY, Glover JN. Detection of protein folding defects caused by BRCA1-BRCT truncation and missense mutations. J Biol Chem. 2003;278:53007–53016. doi: 10.1074/jbc.M310182200. [DOI] [PubMed] [Google Scholar]
- 58.Nikolopoulos G, Pyrpassopoulos S, Thanassoulas A, Klimentzou P, Zikos C, Vlassi M, Vorgias CE, Yannoukakos D, Nounesis G. Thermal unfolding of human BRCA1 BRCT-domain variants. Biochim Biophys Acta. 2007;1774:772–780. doi: 10.1016/j.bbapap.2007.03.018. [DOI] [PubMed] [Google Scholar]
- 59.Christensen J, Hansen L, Izatt R. Handbook of proton ionization heats and related thermodynamic quantities. Wiley; New York: 1976. [Google Scholar]
- 60.Jelesarov I, Bosshard HR. Thermodynamics of Ferredoxin Binding to Ferredoxin-NADP+ reductase and the role of water at the complex interface. Biochemistry. 1994;33:13321–13328. doi: 10.1021/bi00249a019. [DOI] [PubMed] [Google Scholar]
Associated Data
This section collects any data citations, data availability statements, or supplementary materials included in this article.
Supplementary Materials
Experimental details relating to SPR and SFF, description of the modified Akaike criterion, the Bayesian information criterion (BIC), the Hannan-Quinn information criterion (HQIC), and Zwanzig’s model selection criterion, one figure, and three tables. This material is available free of charge via the Internet at http://pubs.acs.org.