

Abstract
Androgens are anabolic hormones that affect many tissues, including bone. However, an anabolic effect of androgen treatment on bone in eugonadal subjects has not been observed and clinical trials have been disappointing. The androgen receptor (AR) mediates biological responses to androgens. In bone tissue, both AR and the estrogen receptor (ER) are expressed. Since androgens can be converted into estrogen, the specific role of the AR in maintenance of skeletal homoeostasis remains controversial. The goal of this study was to use skeletally targeted overexpression of AR in differentiated osteoblasts as a means of elucidating the specific role(s) for AR transactivation in the mature bone compartment. Transgenic mice overexpressing AR under the control of the 2.3-kb α1(I)-collagen promoter fragment showed no difference in body composition, testosterone, or 17β-estradiol levels. However, transgenic males have reduced serum osteocalcin, CTx and TRAPC5b levels, and a bone phenotype was observed. In cortical bone, high-resolution micro-computed tomography revealed no difference in periosteal perimeter but a significant reduction in cortical bone area due to an enlarged marrow cavity. Endocortical bone formation rate was also significantly inhibited. Biomechanical analyses showed decreased whole bone strength and quality, with significant reductions in all parameters tested. Trabecular morphology was altered, with increased bone volume comprised of more trabeculae that were closer together but not thicker. Expression of genes involved in bone formation and bone resorption was significantly reduced. The consequences of androgen action are compartment-specific; anabolic effects are exhibited exclusively at periosteal surfaces, but in mature osteoblasts androgens inhibited osteogenesis with detrimental effects on matrix quality, bone fragility and whole bone strength. Thus, the present data demonstrate that enhanced androgen signaling targeted to bone results in low bone turnover and inhibition of bone formation by differentiated osteoblasts. These results indicate that direct androgen action in mature osteoblasts is not anabolic, and raise concerns regarding anabolic steroid abuse in the developing skeleton or high-dose treatment in eugonadal adults.
Keywords: Androgen receptor, Osteocyte, Bone histomorphometry, Biomechanics, Dual energy X-ray absorptiometry
Introduction
Androgens are steroids that are generally characterized as anabolic hormones, with effects on many tissues including the brain, the immune system, the cardiovasculature, muscle, adipose tissue, liver and bone. Given the large increase in drug sales for testosterone (the major androgen metabolite), estimated at over 500% in the last fifteen years, analysis of the biological consequences of androgen signaling should receive considerable research attention. However, the specific effects of androgen on the skeleton remain poorly characterized and understudied. Since osteoporosis is often coupled with a hypogonadal state in both men and women, sex steroids are implicated in the maintenance of skeletal health. Although both estrogen and androgen circulate in men and women, albeit at different levels, the influence of each on the remodeling skeleton is distinct [34,55]. Consistent with this, combination therapy with both estrogen and androgen provides an improved response in post-menopausal women compared to estrogen alone [2,47]. Estrogens are thought to act to maintain adult bone mass predominantly through an inhibition of bone resorption by the osteoclast, i.e. as anti-resorptive agents, which protects the skeleton from further loss of bone. Non-aromatizable androgens such as 5α-dihydrotestosterone (DHT), on the other hand, have been proposed as possible bone anabolic agents that increase bone formation and bone mass [30,35].
In support of an anabolic effect of androgen on the skeleton, free testosterone concentrations have been shown to correlate with bone mineral density (BMD) in elderly men [56], however testosterone levels also correlated with muscle mass and strength. Testosterone treatment is effective at ameliorating bone loss during aging, but only in men with low testosterone levels [8,61]. Conversely, men undergoing androgen deprivation therapy for prostate cancer show significantly decreased BMD [49] and an increase in clinical fractures [32]. During growth, there are gender differences in skeletal morphology that develop with puberty particularly in cortical bone, with radial expansion that is predominantly observed in boys [31]. Combined, these findings suggest that androgens serve important functions to both maintain bone mass in the adult and to influence the growing, modeling skeleton (see[63]).
Nevertheless, a controversy exists regarding the consequences and/or importance of androgen signaling on skeletal homeostasis. Whether the observed effects of circulating testosterone are due to direct effects on bone is complicated by the fact that androgens influence a variety of tissues known to be associated with bone health, most importantly muscle. Nonetheless, bone is a direct target tissue with respect to androgen action. AR is expressed in the cell types required for skeletal formation and homeostasis, including mesenchymal stromal precursors [4], osteoblasts [1], osteocytes [1,64] and osteoclasts [57]. An additional complication for interpretation of the direct effects of testosterone results from the consequences of its metabolism. Since testosterone serves as the substrate for estradiol synthesis through the action of the enzyme aromatase, systemic testosterone may have effects mediated predominantly or exclusively through activation of estrogen receptor (ER) signaling. Therefore, a specific role for AR signaling cannot be inferred with simple testosterone therapy.
In addition, not all of the studies examining the association of testosterone levels with BMD in adults have actually shown a positive correlation. In general, correlations between bone mass and serum androgen concentrations in adult men have been either weak or insignificant [17,42,48]. Furthermore, many of the various clinical trials examining androgen therapy have been unable to demonstrate robust effects on bone mass, including treatment with anabolic steroids [11]. In most studies that do show an increase in BMD, the most marked improvement is observed only in men with the lowest testosterone levels [61]. Notably, an anabolic effect of androgen treatment on bone in eugonadal men (or in women) has not been observed, in contrast to known anabolic dose-dependent effects to increase muscle mass [5]. For these reasons and because of concerns about safety, androgen replacement even in hypogonadal men remains a controversial issue [20]. Given the modest therapeutic benefit observed with androgen therapy [33], speculation has arisen that a portion of the positive effect of androgens on bone mass may be mediated indirectly through known effects to increase muscle mass and strength. An increase in lean mass would have beneficial effects on BMD though biomechanical linkage and skeletal adaptation. Consistent with this suggestion, Murphy et al [39] have shown that administration of the synthetic anabolic androgen oxandrolone to severely burned children increases lean body mass three to six months before an increase in bone mineral content is observed.
Not surprisingly given the complex nature of bone tissue, systemic androgen administration has shown distinct responses in different skeletal compartments, i.e., cortical, trabecular (cancellous) or intramembranous bone. In hypogonadal settings, a beneficial response to androgen therapy is observed in the trabecular compartment, the more active surface in bone, with an increase in bone mass. However, this relative increase in bone mass occurs with suppression of bone resorption, with micro-architectural changes demonstrating an increase in trabecular number but not thickness. For example, histomorphometric analysis of androgen replacement in hypogonadal male mice has shown that AR activation preserves the number of trabeculae but does not maintain thickness, volumetric density or mechanical strength [38]. Notably, these studies also demonstrated that the bone-sparing effect of AR activation is distinct from the bone-sparing effect of ERα. In addition, androgen appears to play an important role in intramembranous bone formation [16]. Finally, there are reports of increased cortical bone mass, as a consequence of increased bone width and surface periosteal expansion (see[59,63]). High-dose testosterone therapy over 2 years in (genetic female) female-to-male transsexuals resulted in increased areal BMD at the femoral neck, in a setting where estradiol declined to post-menopausal levels [54]. In men with constitutional delay of puberty, impaired periosteal expansion is observed [68]. Taken together, these reports indicate that androgens in vivo act to maintain trabecular bone mass through inhibition of osteoclast activity and to expand cortical bone at the periosteal surface. While these findings argue that androgen positively affects cortical bone at the periosteal surface (see[67]), what is lacking is clear documentation of an anabolic effect to increase bone formation in mature osteoblasts and osteocytes. Thus, the direct consequences of androgen action on differentiated osteoblasts in vivo remain unclear, and mechanisms underlying potential positive outcomes on bone formation and bone mass remain uncharacterized.
Concentrations of estrogen and androgen receptors vary during osteoblast differentiation, with AR levels highest in mature osteoblasts and osteocytes [64]. Since osteocytes are the most abundant cell type in bone [50], these cells are likely an important target cell for androgen action, and may represent a central mediator for skeletal responses to testosterone therapy in vivo. The goal of this study was to use skeletally targeted overexpression of AR as a means of elucidating the specific role(s) for AR transactivation in the mature differentiated osteoblast. AR overexpression was targeted by the col2.3 promoterand was chosen for several reasons: the skeletal expression patterns for this promoter are bone-selective and well-characterized (see[24–26,36,37]); with strong col2.3 promoter activity in differentiated osteoblasts/osteocytes and mineralizing nodules [25,26,36] but not in osteoclasts [7]. Promoter activity varies in different bone compartments. In intramembraneous bone, strong expression was seen in cells at osteogenic fronts of parietal bones but not in the suture [36]. In long bones, strong transgene expression was observed in most osteoblasts on endocortical surfaces, and in a large proportion of osteocytes in femurs throughout cortical bone but with no expression in periosteal fibroblasts [25,26]. In the trabecular area of metaphyseal bone, strong expression was observed at all developmental stages [26].
A distinct advantage of employing a transgenic model is the enhancement of androgen signaling in a specific target in vivo, e.g., mature osteoblasts and osteocytes, as a consequence of increased AR abundance. The AR2.3-transgenic model allows for characterization of skeletal responses in the absence of changes in circulating hormone (testosterone or 17β-estradiol) that occurs with global genetic manipulations, to take advantage of increased sensitivity to androgen in distinct skeletal sites for analysis of compartment-specific effects. At the same time, manipulation of androgen action through AR overexpression, rather than systemic administration, gonadectomy or global knockout, excludes effects that would occur at other androgen target tissues in vivo including muscle and fat. Here we describe the skeletal consequences of enhanced androgen signaling that is restricted to mature osteoblasts and osteocytes, employing the 2.3-kb type I collagen promoter to control AR overexpression.
Materials and methods
Cloning of expression plasmids
The pBR327-based plasmid col2.3-βgal-ClaPa contains the basic rat collagen Iα1 promoter sequence − 2293 to + 115 (provided by Dr. David Rowe, University of Connecticut Health Center), which served as the starting vector. BamHI sites were added to the rat AR cDNA (provided by Dr. Shutsung Liao, University of Chicago) with PCR primers. The PCR product was T/A cloned in pCR 2.1-TOPO vector (Invitrogen Corp., Carlsbad, CA, USA). Finally the BamHI-rAR fragment was cloned into the BamHI site in the col2.3-βgal-ClaPa (after removal of the βgal cDNA sequences), to give the expression construct referred to as the AR2.3-transgene. The correct sequence and orientation of the AR insert was verified by direct DNA sequencing.
Generation of AR2.3-transgenic mice
AR2.3-transgenic mice were produced using standard technology by the Oregon Health and Science University (OHSU) Transgenic Mouse Facility, following methodology previously described [67]. Embryos were obtained from matings of C57BL/6 males×DBA/2J females (B6D2F1). Founder mice were identified by PCR genotyping and mated with B6D2F1 (Jackson Labs, Bar Harbor, ME, USA) to produce F2 litters. Transgenic mice were healthy and transmitted the transgene at the expected frequency. The generation and use of transgenic mice were performed according to institutional, local, state, federal and NIH guidelines for the use of animals in research under an Institutional Animal Use and Care Committee-approved protocol.
Animals
AR2.3-transgenic mice were bred to B6D2F1 mice (Jackson Labs); both genders were employed. The mice had free access to tap water and were fed a diet containing 1.14% calcium, 0.8% phosphorous, 2200 IU/kg vitamin D3, 6.2% fat and 25% protein (Purina PMI Nutrition International, St. Louis, MO, USA). All animals were weighed weekly, and body length (nose to rump) was determined at monthly intervals over six months (n=4–5). For analysis, the animals were sacrificed under CO2 narcosis by decapitation. The right femur was used for measurement of cortical and trabecular volumetric density and geometry by ex vivo micro-computed tomography (μCT), followed by destructive analysis of whole bone biomechanical properties. The left femur was used for dynamic histomorphometric analysis. The length of the femur was measured from the femoral head to the distal condyles. In addition, a variety of tissues/organs were collected for RNA isolation or histological and immunohistochemical analyses. For RNA isolation, tibia was cleaned of muscle tissue and aseptically dissected. After removal of the epiphyseal area, marrow was briefly flushed with sterile phosphate buffered saline and the bone was frozen in liquid nitrogen and stored at −80 °C until RNA isolation as described below.
Primary calvarial osteoblast culture and western blot analysis
Primary osteoblastic cells were isolated after collagenase digestion from fetal calvaria from both wild-type and AR2.3-transgenic fetal mice. Calvariae were isolated from 3–6 day old mice after genotyping and subjected to four sequential 15-min digestions in a mixture containing 0.05% trypsin and 0.1% collagenase-P at 37 °C. Cell fractions 2–4 were pooled and plated at 8000 cells/cm2 in MEM supplemented with 10% FBS. Beginning at confluence around day 7, cultures were switched to differentiation medium in phenol-red free BGJb (Fitton-Jackson modification) containing 50 μg/ml ascorbic acid. From day 14 on, 5 mM β-glycerophosphate was added to the differentiation media. Whole cell lysates were prepared with lysis buffer. Equal amounts of cell extract were electrophoresed on a 10% SDS-polyacrylamide gel, and the separated proteins were transferred to an Immobilon-P polyvinylidene-difluoride transfer membrane (Millipore, Bedford, MA, USA). AR abundance was determined by immunoblotting with polyclonal rabbit AR antibodies (ARN-20) purchased from Santa Cruz Biotechnology, Inc. (Santa Cruz, CA, USA) and used at 1:300 dilution. The α-tubulin antibody (T9026) was a mouse monoclonal antibody purchased from Sigma and was used at 1:1000 dilution. Bound antibodies were visualized by enhanced chemiluminescence (Amersham Pharmacia Biotech, Piscataway, NJ, USA) on Kodak X-AR5 autoradiographic film. The analysis of α-tubulin was used for protein loading control.
Real-time quantitative reverse transcription-polymerase chain reaction (qRT-PCR) analysis
Total RNA was extracted and the concentration was measured at 260 nm using a spectrophotometer, with purity assessed by the A260/280 ratio. RNA integrity was confirmed on a 1% agarose gel after SYBR Gold staining (Invitrogen Corp), and qRT-PCR was performed as previously described [19]. Intron-spanning primers for tibial RNA analysis were purchased pre-designed from Qiagen (Valencia, CA, USA). Transgene-specific RT primers were forward 5′-GCATGAGCCGAAGCTAAC-3′ and reverse 5′-GAACGCTCCTCGATAGGTCTTG-3′ designed using Oligo Software (Molecular Biology Insights, Inc. Cascade CO, USA), and specifically amplified colAR using sites in the collagen untranslated region and AR near to those used for genotyping. Fold regulation was determined by normalizing all values to the mean of the value in calvaria.
Serum biochemistry and hormone analysis
Serum specimens from 2-month-old female and male mice of both genotypes were collected and stored at −20 °C until analysis was performed (n=6–17). Blood samples were obtained under anesthesia by cardiac puncture. Serum analysis was as previously described [67], with 17β-estradiol measured by radioimmunoassay (RIA) using Immuchem Double Antibody 17β-Estradiol RIA (ICN Biomedicals Inc., Costa Mesa, CA, USA); testosterone measured by enzyme linked immunoassay from Diagnostic Automation Inc. (Calabasas, CA, USA); osteocalcin quantitated by ELISA (Biomedical Technologies Inc., Stoughton, MA, USA); and OPG determined by immunoassay kit (R&D systems, Minneapolis, MN, USA). Indices of bone resorption in vivo were quantitated using the serum biochemical marker C-terminal telopeptide of collagen (CTx) analyzed by a RatLaps ELISA kit (Nordic Bioscience Diagnostics A/S, Herlev, Denmark). Assays were performed using 20 μl serum aliquots in duplicate following the manufacture’s recommendations. Intraassay variation was 5.6%, and interassay variation was 10.5%. Serum TRAPC5b activity was determined using MouseBoneTRAP Assay (Immunodiagnostic Systems Inc., Fountain Hills, AZ, USA) using 25 μl serum aliquots in duplicate following the manufacturer’s protocol.
Histochemical analysis of calvaria
Immunohistochemical analysis was performed on representative calvaria from 2-month-old mice. Calvaria were fixed, decalcificied in Immunocal (Decal Corp., Tallman, NY, USA), and sections were processed by dehydration, paraffin infiltration and embedding. Tissue sections (5–6 μm) were cut, processed and subjected to immunohistochemical staining after incubation in a primary antibody directed against AR N-terminus (ab3510, 4 μg/ml; Abcam Inc, Cambridge, MA, USA) at 4 °C overnight. For AR detection, sections were incubated for 1 h in a biotinylated goat antirabbit secondary antibody (1:200; Vector Laboratories, Burlingame, CA, USA). Following rinses, sections were incubated for 60 min in avidin-biotin complex (1: 1000; Vectastain Elite; Vector Laboratories). After 30 min of rinsing, sections were incubated for 10 min with a diaminobenzidine (DAB) solution (0.05% DAB) activated by 0.001% hydrogen peroxide. Slides were counterstained with hematoxylin.
Dynamic histomorphometry
Bone formation and resorption during the last week of growth was assessed by dynamic histomorphometric measures after fluorochrome labeling (n=8–20 males; 10–15 females). Prior to sacrifice, 2-month-old mice received two fluorochrome labels by intraperitoneal (ip) injection [oxytetracycline hydrochloride (Sigma, St. Louis, MO, USA) at 30 mg/kg and calcein green (Sigma) at 10 mg/kg], given 10 days and 3 days before death, respectively. Left femora were dissected and processed non-decalcified for plastic embedding as previously described [23]. Cross-sections (100 μm) through mid-diaphysis were prepared using a diamond-wafering saw (Buhler, Lake Bluff, IL, USA), thenpolished to a thickness of 30 μm. Sections were left unstained and dynamic histomorphometry was carried out using a light/epifluorescent microscope and a semiautomatic image analysis system (OsteoMetrics, Inc., Decatur, GAUSA). Standard measures of bone formation and resorption were determined for both the periosteum and endocortex, including mineral apposition rate (MAR, μm/day), mineralizing perimeter ([dL.Pm + sL.Pm/2]/B.Pm, %), bone formation rate (BRF/B.Pm, μm2/μm/day), and eroded perimeter (%). Bone formation rate (perimeter referent) was calculated by multiplying mineralizing perimeter by mineral apposition rate. In addition, the cross-sectional area and cortical area were measured on cortical cross-sections and cortical thickness calculated. The terminology and units used were those recommended by the Histomorphometry Nomenclature Committee of the American Society for Bone and Mineral Research [44].
Bone morphology and microstructure
The morphological consequences of increased AR expression in osteoblastic/osteocytic cells in AR2.3-transgenic animals were evaluated in 2-month-old male and female mice by dual energy X-ray absorptiometry (DXA) and quantitative μCT. Areal BMD, bone mineral content (BMC) and body composition was measured by whole body DXA using a mouse densitometer (PIXImus2, Lunar, Madison WI, USA). Right femurs from each genotype (n=10–21 males; 13–19 females) were examined for diaphyseal cross-sectional morphology and tissue mineral density (TMD) using an eXplore Locus SP Pre-Clinical Specimen MicroComputed Tomography system (GE Medical Systems, London, Ontario) as described previously [22]. Area measures were body weight adjusted to reduce variability. Three-dimensional images of the entire femur were obtained at an 8.7 μm voxel size and individually thresholded using a standard segmentation algorithm [43]. A 3 mm region of the reconstructed mid-diaphysis, corresponding to the typical failure region for 4-point bending (see below), was examined. Determination of cross-sectional morphology was performed using custom analysis program (MathWorks, v. 6.5; The MathWorks, Inc., Natick MA, USA) [22]. Trabecular morphometry of the distal metaphysis, including bone volume fraction (BV/TV) and trabecular thickness (Tb.Th), trabecular number (Tb.N) and trabecular separation (Tb.Sp), was assessed using Microview Advanced Bone Analysis (GE Medical Systems, v. 1.23).
Images from the μCT analysis were also used to quantify TMD as described previously [22]. TMD is the average mineral value of the bone voxels alone, expressed in hydroxyapatite (HA) density equivalents. TMD was calculated by converting the grayscale output of bone voxels in Hounsfield units (HU) to mineral values (mg/cc of HA) through the use of a calibration phantom hydroxyapatite (SB3: Gamex RMI, Middleton, WI, USA) [TMD=average bone voxel HU/average HA phantom HU*1130 mg/cm3 (HA physical density)] [22]. The same calibration phantom was used for all scans to normalize mineral density measurements and to account for possible variability among scan sessions.
Mechanical testing
Following DXA and μCT analysis, the right femurs were subjected to destructive testing to establish whole bone mechanical properties. Femurs were loaded to failure in 4-point bending. All whole bone-bending tests were conducted by loading the femurs in the posterior to anterior direction. The load-deflection curves were analyzed for stiffness (the slope of the initial portion of the curve), maximum load, post-yield deflection (PYD), and work-to-failure as described previously [23]. Stiffness and maximum load were adjusted for body weight.
Statistical analysis
All data were analyzed using Prism software v4 (GraphPad Software, Inc., San Diego, CA, USA). Significance of difference between wild-type and AR2.3-transgenic mice was assessed by an unpaired two-tailed t-test using Welch’s correction. Body lengths and weights were analyzed by repeated measures two-way ANOVA for the effects of gender and genotype. All data are shown as mean±standard error of the mean (SEM).
Results
Generation of transgenic mice with enhanced androgen signaling in mature osteoblasts and osteocytes
Confusion exists regarding the in vivo action of androgens in bone due to metabolism to estrogen, because androgen influences many tissues in the body, and many months of treatment are required to observe improvement in BMD. The AR2.3-transgenic animal model was created to determine the specific physiologic relevance of androgen action in the mature osteoblast/osteocyte population in bone, through tissue-specific overexpression of AR. This line is distinct from our previously described AR3.6-transgenic model, with AR overexpression in stromal precursors, periosteal fibroblasts and throughout the osteoblast lineage directed by the col3.6 promoter [67]. A transgene cassette (AR2.3) was cloned as described in Materials and methods and AR2.3-transgenic mice were created following standard procedures. Positive founders were identified by PCR genotyping and were bred to wild-type B6D2F1 mice; two AR2.3-transgenic lines (lines 219 and 223) derived from independent founders have been retained. Southern analysis confirmed a single insertion site for the AR2.3-transgene (data not shown). Table 1 lists the qRT-PCR analysis of expression of the AR2.3-transgene in various tissues, showing the expected bone targeting with highest levels in calvaria but ~100–3000-fold lower levels in muscle, skin, heart, intestine, kidney, liver, lung and spleen.
Table 1.
Analysis of transgene expression in a variety of tissues from AR2.3-transgenic mice
| Tissue | AR2.3-tg level | Fold difference |
|---|---|---|
| Calvaria | 1.0000±0.2373 | n.a. |
| Thymus | 0.0066±0.0011 | −152 |
| Lung | 0.0054±0.0005 | −185 |
| Heart | 0.0047±0.0019 | −213 |
| Kidney | 0.0044±0.0006 | −227 |
| Fat | 0.0027±0.0007 | −370 |
| Spleen | 0.0025±0.0004 | −400 |
| Muscle | 0.0006±0.0000 | −1667 |
| Skin | 0.0006±0.0002 | −1667 |
| Ear | 0.0004±0.0001 | −2500 |
| Liver | 0.0004±0.0002 | −2500 |
| Tendon | 0.0003±0.0000 | −3333 |
| Intestine | 0.0000±0.0000 | n.d. |
Tissues listed were harvested from male AR2.3-transgenic mice and total RNA was isolated (n=5). Expression of the transgene was evaluated by real-time qRT-PCR analysis after normalization to the total RNA concentration using RiboGreen [19]. Data are expressed relative to the expression level in calvaria as mean±SEM. n.a., not applicable; n.d., not detectable.
Phenotype in AR2.3-transgenic mice with bone-targeted AR overexpression
To begin to characterize the phenotype of AR2.3-transgenic mice, we first determined body weight gain and nose–rump length over a 6-month period. At birth, animals were indistinguishable and as the mice aged, AR2.3-transgenic males and females gained length and weight similar to wild-type controls (Figs. 1a, b). Body composition and bone density were evaluated by DXA at 2 months in male and female AR2.3-transgenic mice and wild-type littermate controls. While systemic androgen treatment is known to affect body compositional changes, no difference was noted in either lean mass (Fig. 1c) or fat mass (Fig. 1d) in either males or females, consistent with skeletal targeting of the AR transgene. In addition, areal BMD (Fig. 1e) and BMC (Fig. 1f) were not significantly different in males or females, indicating a lack of effect on periosteal surfaces as expected.
Fig. 1.
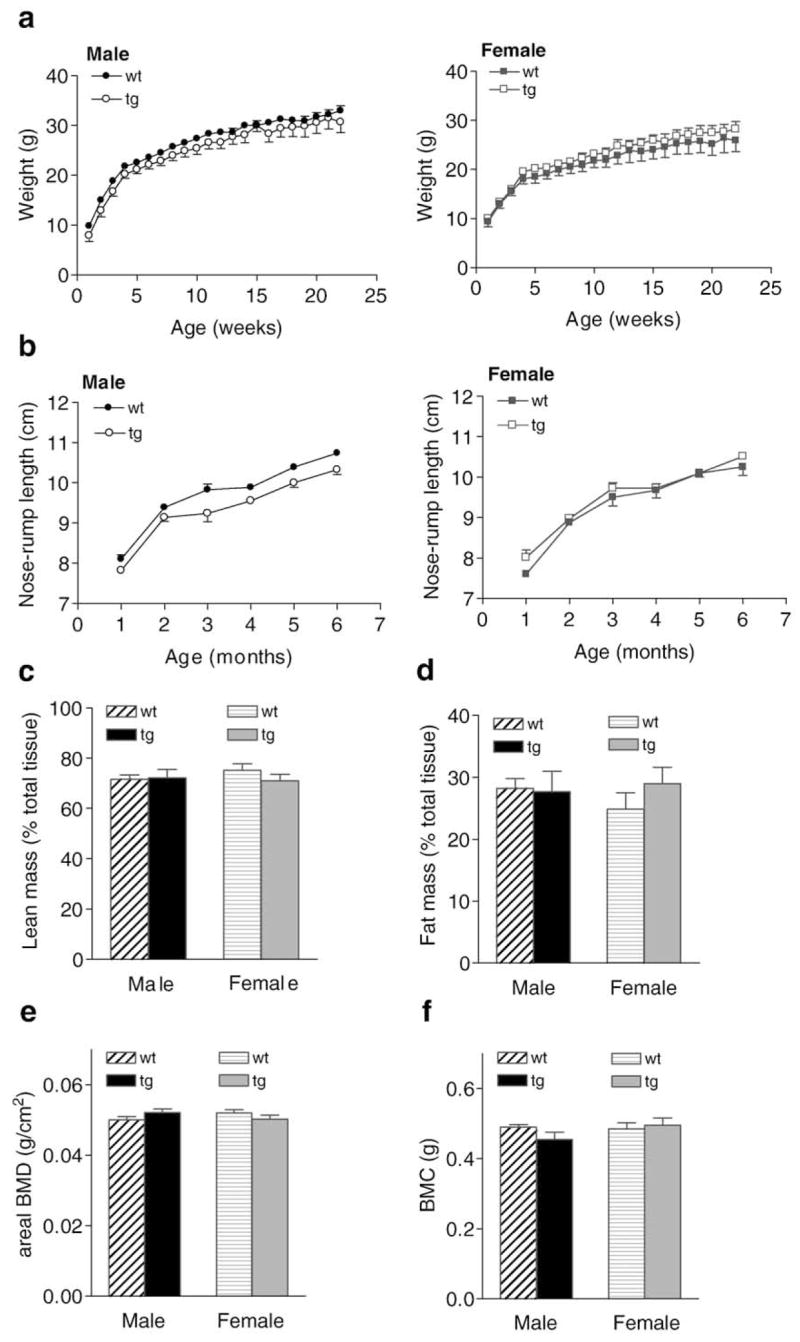
Weight changes and body composition analysis in AR2.3-transgenic mice. Body weight and nose–rump-length determinations were carried out weekly or monthly, respectively, over six months in both genders in both wild-type (wt) and AR2.3-transgenic (AR2.3-tg) mice. a. Weight gain in growing male (left) and female (right) mice. Analysis for the effects of time and genotype by repeated measures two-way ANOVA in males revealed an extremely significant effect of time (F=218.36; P<0.0001) but not genotype, and with no interaction; females were similar (F=114.80; P<0.0001). b. Nose–rump length in male (left) and female (right) mice. Analysis by repeated measures in males revealed an extremely significant effect of time (F=228.54; P<0.0001) and an effect of genotype (F=15.87; P<0.01) with no interaction; females only showed an effect of time (F=149.48; P<0.0001). Data is shown as mean±SEM, n=4–5. DXA was performed on 6-month-old AR2.3-transgenic and littermate control mice to assess bone mineral, lean mass and fat mass. c. Lean mass adjusted for total tissue mass. d. Fat mass adjusted for total tissue mass. e. Areal BMD (minus head). f. BMC. Values are expressed as mean±SEM, n=4–10.
AR2.3-transgenic mice were next evaluated for serum biochemistry and hormone levels at 2 months of age. As expected with bone targeting of AR overexpression, serum testosterone and estradiol levels were not significantly different between littermate controls and transgenic animals in either sex (Figs. 2a, b). There were also no significant differences in serum calcium levels between transgenic mice and littermate controls (Fig. 2c). Interestingly, there was a significant ~50% decrease in serum osteocalcin levels in male AR2.3-transgenic animals (P<0.01, Fig. 2d), but not in females. Serum OPG showed little difference between genotypes (Fig. 2e), but bone resorption markers TRAPC5b and CTx (that mostly reflect cortical bone properties) were significantly reduced in male AR2.3-transgenic mice (P<0.05, Figs. 2f, g).
Fig. 2.
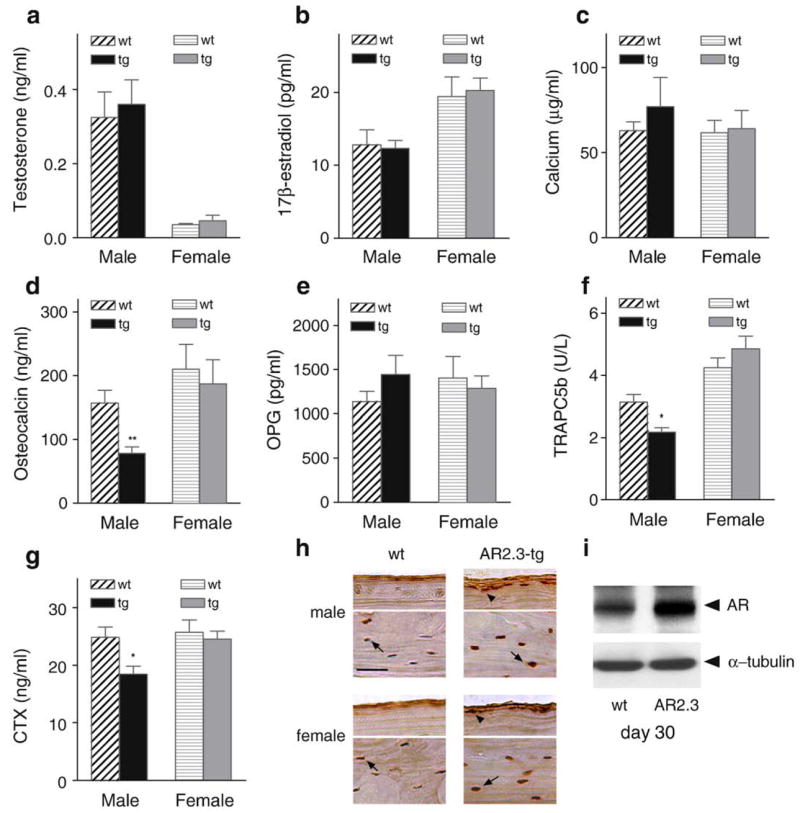
Phenotypic characterization of serum markers and AR overexpression in AR2.3-transgenic animals. Comparisons were performed between wild-type littermate control (wt) and AR2.3-transgenic (AR2.3-tg) animals. Serum from 2-month-old mice was analyzed to determine levels of hormones and markers of calcium metabolism. Assays were performed in duplicate by RIA for 17β-estradiol or EIA for testosterone, OPG and intact mouse osteocalcin, and for calcium by the colorimetric cresolphthalein-binding method. a. Testosterone. b. 17β-estradiol. c. Calcium. There were no statistical differences between the genotypes for 17β-estradiol, testosterone or calcium levels. Values are expressed as mean±SEM, n=6–17. d. Osteocalcin. e. OPG. f. TRAPC5b. g. CTx. Osteocalcin, TRAPC5b and CTx were all significantly reduced in male AR2.3-transgenic mice. Values are expressed as mean±SEM, n=3–8. *P<0.05; **P<0.01 (vs. gender-appropriate wild-type control). h. Immunohistochemical analysis of AR levels in calvaria isolated from 2-month-old mice. Sections were subjected to immunohistochemical staining after demineralization and paraffin embedding. For each sex, the top panel represents a section at the calvarial surface to focus on osteoblasts (arrowheads) while the bottom panel represents a section through the center of the bone to show osteocytes (arrow). Representative sections are shown. AR abundance was visualized with rabbit polyclonal antisera for male and female mice from wt and AR2.3-tg mice. AR is brown and the nucleus is purple after DAB incubation and counterstaining with hematoxylin. Scale bar=50 μm. i. AR levels by Western blot analysis during ex vivo differentiation of calvarial osteoblasts derived by collagenase digestion from wild-type or AR2.3-transgenic mice. Analysis was performed at day 30 in mineralizing cultures. Control for loading was characterized by α-tubulin levels. (For interpretation of the references to color in this figure legend, the reader is referred to the web version of this article.)
To further evaluate the phenotype of AR2.3-transgenic mice, we characterized AR protein expression in vivo by immunohistochemical analysis in calvarial sections from both sexes (Fig. 2h). The antibody used does not distinguish between endogenous AR and the product of the AR2.3-transgene, so immunostaining represents combined levels for both proteins. AR expression is seen in osteocytes in wild-type mice (brown color combined with blue color from hematoxylin counterstaining), in sections from the middle of the calvaria (bottom panels for each sex). Consistent with increased AR2.3-transgene expression, robust AR expression is seen in osteocytes in both male and female transgenic mice (bottom panels for each sex). AR is also seen in differentiating osteoblasts at the innermost layer at the bone surface (upper panels for each sex). Thus, increased AR expression in osteocytes and the most differentiated osteoblasts is seen in both male and female transgenic animals, consistent with previous characterization of promoter activity [25,26]. There was no notable difference between the sexes or between independent families (data not shown). Morphological changes were evaluated by H&E staining (data not shown); there was no difference in calvarial width between wild-type and AR2.3-transgenic mice of either gender, nor between the independent AR2.3-transgenic families 219 and 223. In contrast, calvaria from male AR3.6-transgenic mice, with AR overexpression in periosteal fibroblasts and throughout the lineage, demonstrated substantial calvarial thickening [67]. Finally, we examined AR levels by Western analysis in ex vivo studies using primary calvarial osteoblast cultures derived from wild-type vs. transgenic mice. As shown in Fig. 2i, increased AR levels are seen in mature osteoblasts/osteocytes at day 30 in differentiating cultures from transgenic mice.
Enhanced androgen signaling results in altered bone morphology and reduced cortical area in male transgenic mice
Overall cortical bone morphology and femoral structure were quantified from high-resolution μCT images. Measures obtained for morphological assessment from μCT analysis are described in Fig. 3a. No effect of AR2.3-transgene expression on total cross-sectional area or surface periosteal perimeter was observed in either males or females (Figs. 3b, e). However, marrow cavity area was significantly increased in transgenic males (i.e., reduced infilling occurred; P<0.01, Fig. 3c). Given no compensatory changes in the periosteal layer, this inhibition resulted in a modest but significant reduction in cortical bone area in male transgenic mice (P<0.05, Fig. 3d). Thus, enhanced AR signaling in mature osteoblasts has significant inhibitory effects on overall femoral cortical bone area. This morphological difference at the diaphysis was not observed in female transgenic mice. We also evaluated polar moment of inertia and tissue mineral density (TMD) at the mid-diaphysis. While there was no significant effect on polar moment of inertia (Fig. 3f), transgenic males show a significant reduction in TMD (P<0.001; Fig. 3g).
Fig. 3.

Cortical morphology, structural analysis and bone formation rates in AR2.3-transgenic mice. Femurs were isolated from 2-month-old male and female wild-type (wt) or AR2.3-transgenic mice (tg) and subjected to high-resolution μCT imaging at mid-diaphysis. a. Parameters for morphological characterization by μCT. b. Total cross-sectional area. c. Marrow cavity area. d. Cortical bone area. e. Periosteal perimeter. f. Polar moment of inertia. g. Tissue mineral density. Values are shown as mean±SEM, n=10–21 males; 13–19 females. Differences between genotypes were determined by Student’s unpaired t-test with Welch’s correction. *P<0.05; **P<0.01; ***P<0.001 (vs. gender-appropriate wt controls). For dynamic histomorphometric analysis, male femurs were sectioned at the mid-diaphysis; rates were determined at both the endocortex and periosteum. h. Fluorescent images of femur after double-label administration. Representative photomicrographs are shown with higher power insets demonstrating labeling on the endocortex. Bands were photographed at comparable anatomic positions for each bone. i. Bone formation rate (BFR). j. Mineral apposition rate (MAR). k. Percent eroded perimeter. l. Percent mineralizing perimeter (M.Pm/B.Pm×100). Values are shown as mean±SEM; n=8–20 males; 10–15 females. **P<0.01; ***P<0.001 (vs. wt controls). Scale bar=200 μm in figure; scale bar=100 μm in insets as indicated.
Reduced endocortical bone formation with bone-targeted AR overexpression
Because of the changes observed with the μCT analysis in cortical bone area in transgenic males, dynamic histomorphometric analysis was carried out at the femoral diaphysis using fluorescent imaging. Fluorochromes were administered (oxytetracycline followed by calcein) to label new mineral deposition. Fig. 3h shows patterns of bone formation in images of fluorochrome labeling from femoral cross-sections. The AR2.3-transgenic males (upper panel) show a dramatic lack of labeling at the endocortical surface compared with wild-type controls (lower panel). Consistent with these fluorescent images, quantitative dynamic histomorphometric analysis revealed inhibitory responses at the endocortex in transgenic males, with strong inhibition (~70%) of BFR/B.Pm (P<0.001; Fig. 3i) and ~50% reduction in MAR, the latter being a measure of osteoblast vigor (P<0.001; Fig. 3j). Eroded perimeter was reduced at the periosteum (P <0.001; Fig. 3k), while mineralizing perimeter (M.Pm/B.Pm) showed inhibition at the endocortex (P<0.01) but stimulation at the periosteum (P<0.01) in Fig. 3l. The modest increase in periosteal activity seen does not parallel a change in cortical bone morphology characterized by μCT analysis, likely since the labeling is representative of mineralization patterns only for the period of time that the labels are present.
Ability to resist fracture is impaired in male AR2.3-transgenic mice
To analyze whole bone biomechanical and failure properties, femurs from 2-month-old wild-type and AR2.3-transgenic animals were loaded to failure in 4-point bending at 0.05 mm/s. Although overall geometry of the femur showed no obvious differences between wild-type and transgenic mice (Fig. 4a), failure properties were significantly impaired. Diaphyseal strength assessed as both maximum load (P<0.05, Fig. 4b) and stiffness (P<0.05, Fig. 4c) was decreased slightly by about 10% in male transgenics (with no change in females), consistent with the decreased cortical bone area (see Fig. 3c). However, a dramatic impairment was seen in male transgenic bones in their ability to resist fracture. They were more brittle (less ductile), with an approximately 40% decrease in post-yield deflection (P<0.05, Fig. 4d). Work-to-failure was reduced by nearly 30% compared to wild-type control bones (P<0.05, Fig. 4e). Male AR2.3-transgenic mice in this cohort showed no difference in femoral length or weight (Figs. 4f, g).
Fig. 4.
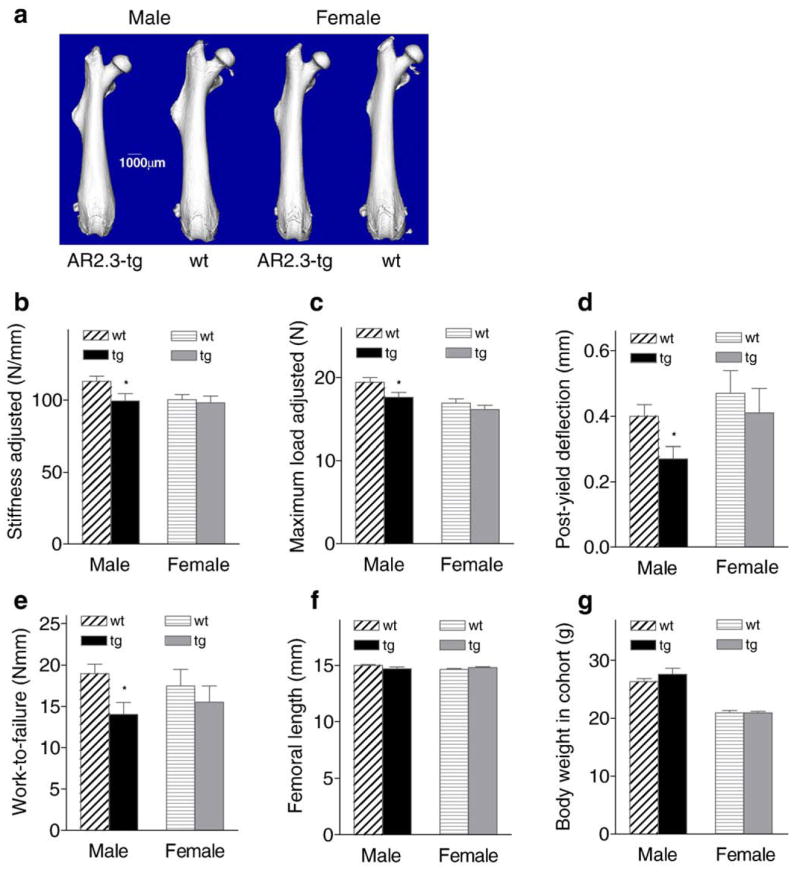
Whole bone strength and failure properties determined from biomechanical analyses. Femurs from 2-month-old male and female wild-type (wt) and AR2.3-transgenic (tg) mice were loaded to failure in 4-point bending analysis. Stiffness, maximum load, and post-yield deflection were calculated from the load-deflection curves. Stiffness and maximum load are adjusted for body weight differences. a. Whole bone morphology from μCT imaging. b. Stiffness adjusted. c. Maximum load adjusted. d. Post-yield deflection. e. Work-to-failure. f. Femoral length. g. Body weight in cohort. Whole bone biomechanical properties are shown as mean±SEM, n=10–21 males; 13–19 females. Differences between genotypes were determined by Student’s unpaired t-test with Welch’s correction. *P<0.05 (vs. gender-appropriate wt controls).
AR overexpression in bone results in increased trabecular bone volume in male transgenic mice
We also used μCT analysis to evaluate the consequences of AR overexpression on the trabecular bone compartment. Visualization of trabecular bone in the metaphysis after manual subtraction of the cortical shell shows an increase in trabecular bone volume in male AR2.3-transgenic mice (Fig. 5a). To better characterize trabecular micro-anatomy and architecture, static histomorphometric analysis was performed from images of the metaphyseal trabecular region (Figs. 5b–e). Male AR2.3-transgenic mice showed an ~35% increase in trabecular bone volume as a percent of tissue volume (BV/TV; P<0.05; Fig. 5b), consistent with the μCT image. The increase in trabecular bone volume was associated with an ~25% increase in trabecular number (Tb.N; P<0.01; Fig. 5c), with no effect on trabecular thickness (Tb.Th; Fig. 5d), and thus an ~30% decrease in spacing (Tb.Sp; P<0.01; Fig. 5e).
Fig. 5.
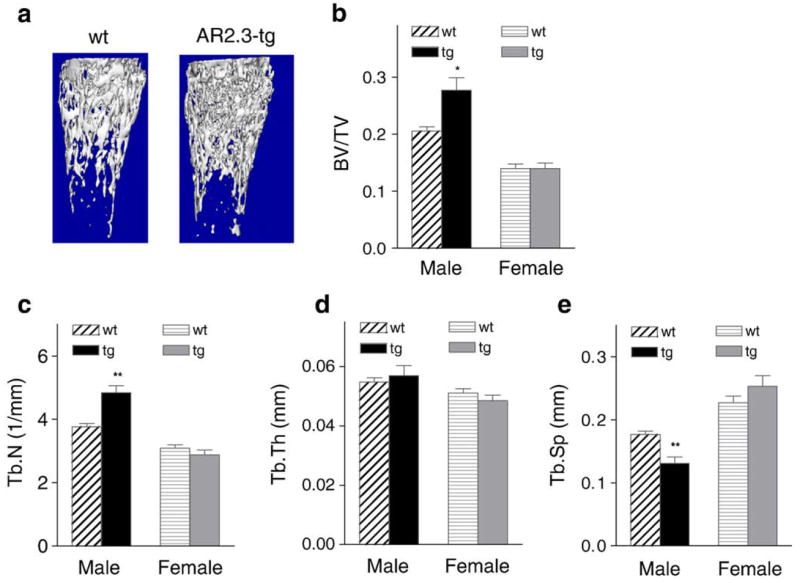
Trabecular morphology and micro-architecture in AR2.3-transgenic mice. Computer-aided analysis of μCT images was used to derive measures of trabecular bone microarchitecture in the metaphysis of 2-month-old male and female wild-type (wt) or AR2.3-transgenic (tg) mice. Measurements included trabecular bone volume as a percent of tissue volume (BV/TV); trabecular number, spacing, and thickness (Tb.N, Tb.Sp, Tb.Th). a. Reconstructed images were evaluated for trabecular morphology in the distal metaphysis. b. BV/TV. c. Tb.N. d. Tb.Th. e. Tb.Sp. Values are expressed as mean±SEM, n=10–21 males; 13–19 females. Differences between genotypes were determined by Student’s unpaired t-test with Welch’s correction. *P<0.05; **P<0.01 (vs. gender-appropriate wt controls).
Enhanced androgen signaling in mature osteoblasts leads to reduced expression of molecular markers of bone formation and osteoclast activation in cortical bone
Lastly, we analyzed gene expression in long bone from wild-type and AR2.3-transgenic mice of both genders. Differences in gene expression in RNA isolated from tibial mid-diaphysis for sets of genes that play a significant role in either bone formation or bone resorption (Fig. 6). Osteoblastic marker genes evaluated were cyclin D1, osterix, type I collagen (col), osteocalcin (OC) and sclerostin (SOST). Levels of osteoblastic marker genes are listed in an order reflecting their temporal expression patterns during osteoblast differentiation, e.g., osteocalcin is expressed late in osteoblast differentiation. Significant reductions were noted in transgenic males in levels of osterix, collagen, osteocalcin and SOST (Fig. 6a, left panel). The reduction in osteocalcin gene expression mirrors the reduction in serum concentrations (Fig. 2d). Interestingly, expression of osteoblastic markers in mid-diaphyseal tissue from male transgenic mice was inversely correlated with the differentiation stage, with increased inhibition for genes representative of more mature differentiated osteoblasts, suggesting alteration of the organic matrix consistent with reduced osteoblast vigor shown in Fig. 3j. For example, SOST is produced by mature osteocytes [46], and SOST mRNA levels were significantly inhibited in male transgenic bones. This pattern mirrors the expected increase in col2.3 promoter activity during osteoblast differentiation [12]. Osteoclastic marker genes analyzed were OPG, receptor activator of NF-κB ligand (RANKL), tartrate-resistant acid phosphatase (TRAP), cathepsin K (CatK) and calcitonin receptor (CTR). Similar to the osteoblastic marker genes, inhibition of gene expression was also observed in osteoclastic marker genes CTR, CatK, and TRAP again only in male AR2.3-transgenic mice (Fig. 6a, right panel). The reduction osteoclastic gene expression is consistent with reduced serum levels of bone resorption markers (TRACP5b and CTx; Figs. 2e, f). This qRT-PCR analysis represents changes observed in cortical bone, and may not reflect similar changes in trabecular bone. Consistent with the lack of a bone phenotype in females, there was little difference in expression in female transgenics compared to control mice for any of the osteoblastic or osteoclastic marker genes analyzed (Fig. 6b).
Fig. 6.
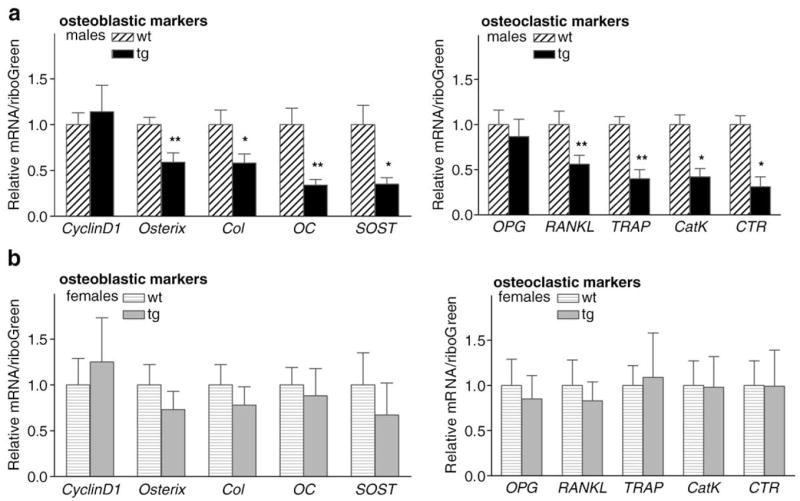
Cortical bone gene expression in AR2.3-transgenic mice. Analysis of steady-state mRNA expression for genes involved in bone formation or bone resorption was determined by real-time qRT-PCR analysis using tibial RNA isolated from male and female wild-type (wt) or AR2.3-transgenic mice (tg). Osteoblastic marker genes involved in bone formation and matrix production examined included cyclin D1, osterix, type I α1 collagen (Col), osteocalcin (OC) and sclerostin (SOST). Osteoclastic marker genes involved bone resorption and osteoclastic activity were osteoprotegerin (OPG), RANK ligand (RANKL), tartrate-resistant acid phosphatase (TRAP), calcitonin receptor (CTR) and cathepsin K (CatK). a. Examination of osteoblastic and osteoclastic marker gene expression in male mice. b. Analysis in females. n=3–8 males; 4–7 females. Values are expressed as mean±SEM. *P<0.05, **P<0.01.
Discussion
The specific role of androgen signaling though transactivation of the AR in maintenance of skeletal homoeostasis remains controversial. To determine the specific physiologic relevance of androgen action in the mature osteoblast/osteocyte population in bone, mice with targeted AR overexpression in mature osteoblasts were developed. Characterization of the consequences of bone-targeted overexpression revealed a skeletal phenotype in male transgenic mice vs. littermate controls, with little difference between the females. Collectively, the phenotype observed in male transgenic mice is likely dependent on the higher serum levels of testosterone (~10-fold) in males vs. females. In this study we have found that AR overexpression in the mature osteoblast population in vivo results in a low turnover state, with increased trabecular bone volume but a significant reduction in cortical bone area due to inhibition of bone formation at the endocortical surface and a lack of marrow infilling. Combined, our results indicate that AR overexpression in mature osteoblasts/osteocytes inhibits endocortical bone formation, and results in changes that are detrimental to matrix quality, biomechanical competence and whole bone strength.
Among the most striking biomechanical characteristics of the bone from male AR2.3-transgenic mice was its markedly impaired fracture resistance. Brittleness is a measure of the amount of deformation a structure undergoes prior to failure, and long bones were significantly more brittle and consequently showed large decreases in work-to-failure. The observed inhibition in bone quality appears to be principally determined by changes in the organic matrix of bone, through the ~50% reduction in MAR at the endocortical surface (which reflects osteoblast vigor or work). Such a robust reduction would lead to detrimental changes in the composition of the material properties of the organic matrix, and thus a worsening in post-yield deflection and work-to-failure. Brittleness, and its opposite, ductility, are functional attributes that in bone derive principally from matrix composition and collagen organization rather than bone geometry and mass, which are the major determinants of bone stiffness and strength. The increased brittleness (i.e., decreased post-yield deflection or ductility) of cortical bone is not likely due to over-mineralization, since TMD was reduced in transgenic males, not increased. Thus, reduced ductility observed in these AR-transgenic mouse bones points to a defect in bone matrix quality. This in turn suggests a defect in osteoblast production of a functionally appropriate bone matrix in the presence of enhanced androgen signaling in mature osteoblasts/osteocytes. Indeed, our molecular analysis of expression differences from the AR-transgenic mice show dramatically reduced collagen and osteocalcin production, consistent with the impaired matrix quality in these mice.
It is instructive to compare the skeletal phenotypes that develop in the two distinct lines that we have generated, the AR2.3-transgenic mice described in these studies and the previously characterized AR3.6-transgenic model [67]. In broad terms, the skeletal phenotype characterized in AR2.3-transgenic mice mirrors that described previously for AR3.6-transgenic males, indicating the reproducibility of the phenotypic consequences of bone-targeted androgen signaling. In common between the two models, we have shown increased trabecular bone volume, reduced formation at endocortical surfaces, reduced bone turnover and compromised biomechanical strength in male transgenic mice. With the exception of enhanced periosteal activity in AR3.6-transgenic males, neither model exhibits anabolic bone formation responses in the cortical bone compartment and instead both show inhibition of bone formation at the endocortical surface. Both also demonstrate significantly compromised biomechanical properties. By comparing and contrasting the two AR-transgenic models, we propose that the commonalities in the bone phenotype between AR2.3-transgenic and AR3.6-transgenic mice arise from AR overexpression in mature osteoblasts and osteocytes, since both promoters are active in these cells. Thus, bone phenotypic changes likely to be mediated at least in part by enhanced androgen signaling in mature osteoblasts/osteocytes include reduced bone turnover, increased trabecular bone volume, reduced endocortical bone formation with decreased osteoblast vigor at endocortical surfaces, and compromised biomechanical strength with increased bone fragility.
The most striking contrast between the two AR-transgenic models is observed at periosteal surfaces in AR3.6-transgenic males, which show increased cortical bone formation in the periosteum and dramatic intramembranous calvarial thickening. This finding was expected, given col3.6 transgene targeting to the periosteum and, conversely, the lack of expression at the same compartment with col2.3 transgene expression [25,26]. The specificity of the periosteal anabolic effect on bone formation in AR3.6-transgenic males is consistent with previous reports documenting the importance of androgen signaling in periosteal expansion [60]. During development, girls and boys build mechanically functional structures (i.e., the size, shape and quality of the bone appears to be well-matched for the size of the individual), but by different means [51]. During/after puberty, an increase in estrogen in girls leads to reduced periosteal expansion and then a reversal on the endosteum, from expansion to infilling. In boys, testosterone levels increase, which in contrast to girls is associated with further growth of the periosteum but also continued expansion of the endocortical cavity. Consequently, the outer diameter of girls’ bones tends to be smaller than that of boys’ bones and greater cross-sectional area is observed in males [13], yet cortical thickness is similar between males and females (but see[41,62]) because of adaptive infilling in females. Thus, we propose that androgen inhibition of medullary bone formation at the endocortical surface in males may subserve an important physiological adaptive function, being the key for appropriate spatial distribution and maintenance of the total amount/weight of bone in the cortical envelope. A reasonable hypothesis is that androgens strongly promote the addition of cortical width through periosteal growth, but balance that growth with inhibition in the marrow cavity so that the skeleton does not become too heavy (see [9]). Based on our characterization of AR-transgenic mouse models and other published reports, we propose a model for the consequences of androgen signaling where the effects of AR activation are distinct in different skeletal compartments (Fig. 7). In trabecular bone, androgens reduce bone formation [58] and suppress resorption to increase trabecular volume through an increase in trabecular number. In cortical bone, androgens inhibit osteogenesis at endocortical surfaces but increase bone formation at periosteal sites [67], to maintain cortical thickness yet displace bone further away from the neutral axis in males. Androgens also positively influence bone growth at intramembranous sites [16,67]. In addition to actions directly in bone, androgen administration also increases muscle mass, partially mediated by effects on mesenchymal stem cell lineage commitment [52]. This increase in muscle mass may indirectly influence bone density through biomechanical linkage. Additional studies will be needed to more fully test these hypotheses.
Fig. 7.
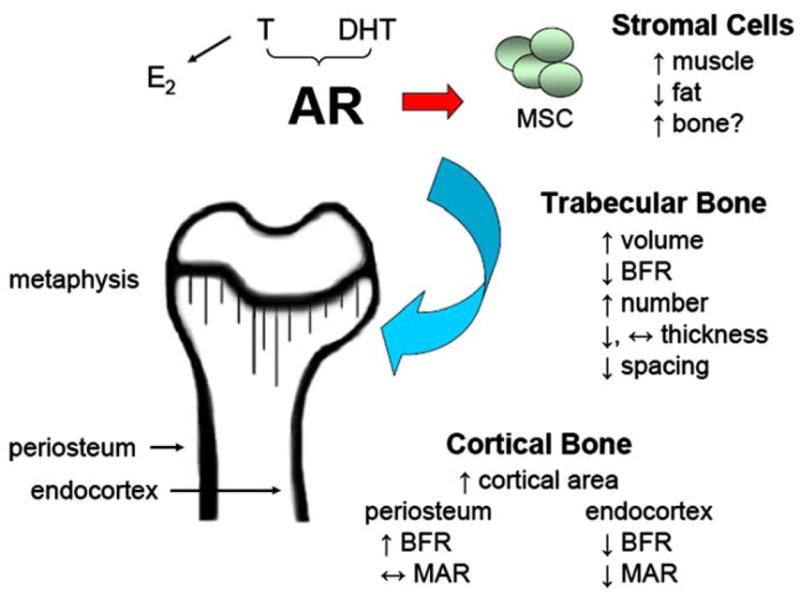
Model for androgen action in the skeleton mediated by AR transactivation. Androgen activation of AR influences a variety of target organs and skeletal sites, including marrow stromal cells, and trabecular, cortical and intramembranous bone compartments. Arrows indicate the changes associated with androgen action. In trabecular bone, androgen action preserves or increases trabecular number, has little effect on trabecular thickness, and thus reduces trabecular spacing. In cortical bone, AR activation results in reduced bone formation at the endocortical surface but stimulation of bone formation at the periosteal surface. Summary based on results presented here and references cited in the text. In the transgenic model, AR activation in mature bone cells in vivo results in a low turnover phenotype, with inhibition of bone formation and inhibition of gene expression in both osteoblasts and osteoclasts. In the absence of compensatory changes at the periosteal surface, these changes are detrimental to overall matrix quality, biomechanics and whole bone strength.
Male AR-transgenic mice also demonstrate a phenotype consistent with reduced osteoclast resorptive activity. In cortical bone, both TRAP and RANKL gene expression is inhibited, and serum levels of both TRAPC5b and CTx are also significantly reduced in transgenic males. In addition, the observed increase in trabecular bone volume with a decrease in trabecular separation is a hallmark of antiresorptive activity. However, future studies employing dynamic histomorphometric analysis will be needed to verify these results. Potential modulation of osteoclast action by DHT is incompletely characterized, although there are reports of AR expression in the osteoclast [57]. Androgen may be a less significant determinant of bone resorption in vivo than estrogen [14], but this remains controversial [34]. The bone phenotype that develops in a global AR null male mouse model, a high-turnover osteopenia with reduced trabecular bone volume and a stimulatory effect on osteoclast activity [28,29,69], also supports the importance of androgen signaling through the AR to influence resorption, and is generally opposite to the phenotype we observe with skeletally targeted AR overexpression. Interestingly, the global AR null model also develops late onset obesity [15]. Finally, recent publications document that androgen can directly reduce bone resorption of isolated osteoclasts [45], inhibits osteoclast formation stimulated by PTH [10], and may play a direct role regulating aspects of osteoclast activity in conditional AR null mice [40]. Our results suggest that at least some component of inhibition of osteoclastic resorptive activity as a consequence of androgen administration is mediated indirectly through effects on mature osteoblasts and osteocytes.
Some of the negative consequences of AR overexpression in mature osteoblasts we have observed in vivo may reflect previously documented in vitro analyses. For example, there are reports, some in clonal osteoblastic cell lines, of effects of gonadal androgen treatment on differentiation, matrix production and mineral accumulation mediated by AR signaling [3,27,53]. These findings are variable however, with other reports of no effect or even inhibition of osteoblast markers [6,18,21], consistent with our gene expression analysis in AR-transgenic mice. In addition, the effect of androgens on osteoblast proliferation is controversial. We have previously demonstrated that either stimulation or inhibition of osteoblast viability by androgen can be observed, and these effects are dependent on the length of treatment. Transient administration of nonaromatizable DHT can enhance transcription factor activation and osteoblast proliferation, while chronic treatment inhibits both mitogenic signaling and MAP kinase activity [66]. Chronic DHT treatment in vitro can also enhance osteoblast apoptosis [65]. Combined, these in vitro reports are consistent with the detrimental changes in matrix quality and osteoblast vigor we observe in the AR-transgenic model in vivo.
In summary, complex skeletal analysis using morphological characterization by μCT, dynamic and static histomorphometric analysis, DXA, biomechanical testing and gene expression studies all indicate that AR overexpression in mature osteoblasts inhibits osteogenesis at endocortical surfaces and produces a low turnover state. Importantly, these changes are detrimental to overall matrix quality, biomechanical competence, bone fragility and whole bone strength. It is possible that the observed inhibition of endocortical osteogenesis and lack of anabolic response, as a consequence of enhanced androgen signaling in mature bone cells, underscores an important physiological function for androgen in the skeleton: to maintain an appropriate spatial distribution of bone in the cortical envelope. Androgens are able to maintain trabecular bone mass and are effective in the treatment of bone loss associated with hypogonadism. Nevertheless, the strong inhibition of bone formation at the endocortical surface and increased bone fragility observed here highlight compartment-specific responses that might underlie the limited therapeutic benefits observed with androgen therapy. Because of the detrimental consequences of bone-targeted androgen signaling on bone fragility and whole bone strength, these results raise concerns regarding anabolic steroid abuse or high-dose androgen therapy during growth and in healthy eugonadal adults.
Acknowledgments
The authors would like to thank Dr. David Rowe (University of Connecticut Health Center) for providing the plasmids containing the rat colα1 promoter sequences, Dr. Shutsung Liao (University of Chicago) for the rat AR cDNA, Dr. Robert Klein (Oregon Health and Science University) for the use of equipment for DXA analysis, Drs. Russell Turner and Urszula Iwaniec (Oregon State University) for the careful reading of the manuscript, and Joel Hashimoto for the excellent technical assistance. This material is based upon work supported by grants from the United States Army Research Acquisition Activity Award No. W81XWH-05-1-0086 (KMW) and the National Institute of Diabetes, Digestive and Kidney Disease R01 DK067541 (KMW). The information contained in this publication does not necessarily reflect the position or the policy of the Government, and no official endorsement should be inferred. All work was performed in facilities provided by the Department of Veterans Affairs.
References
- 1.Abu E, Horner A, Kusec V, Triffitt J, Compston J. The localization of androgen receptors in human bone. J Clin Endocrinol Metab. 1997;82:3493–7. doi: 10.1210/jcem.82.10.4319. [DOI] [PubMed] [Google Scholar]
- 2.Barrett-Connor E, Young R, Notelovitz M, Sullivan J, Wiita B, Yang HM, Nolan J. A two-year, double-blind comparison of estrogen-androgen and conjugated estrogens in surgically menopausal women. Effects on bone mineral density, symptoms and lipid profiles. J Reprod Med. 1999;44:1012–20. [PubMed] [Google Scholar]
- 3.Benz D, Haussler M, Thomas M, Speelman B, Komm B. High-affinity androgen binding and androgenic regulation of a1(I)-procollagen and transforming growth factor-β steady state messenger ribonucleic acid levels in human osteoblast-like osteosarcoma cells. Endocrinology. 1991;128:2723–30. doi: 10.1210/endo-128-6-2723. [DOI] [PubMed] [Google Scholar]
- 4.Bhasin S, Taylor W, Singh R, Artaza J, Sinha-Hikim I, Jasuja R, Choi H, Gonzalez-Cadavid N. The mechanisms of androgen effects on body composition: mesenchymal pluripotent cell as the target of androgen action. J Gerontol A Biol Sci Med Sci. 2003;58:M1103–1110. doi: 10.1093/gerona/58.12.m1103. [DOI] [PubMed] [Google Scholar]
- 5.Bhasin S, Woodhouse L, Casaburi R, Singh AB, Mac RP, Lee M, Yarasheski KE, Sinha-Hikim I, Dzekov C, Dzekov J, Magliano L, Storer TW. Older men are as responsive as young men to the anabolic effects of graded doses of testosterone on the skeletal muscle. J Clin Endocrinol Metab. 2005;90:678–88. doi: 10.1210/jc.2004-1184. [DOI] [PubMed] [Google Scholar]
- 6.Bi LX, Wiren K, Zhang X, Oliveira G, Klein G, Mainous E, Herndon D. The effect of oxandrolone treatment on human osteoblastic cells. J Burns Wounds. 2007;6:53–64. [PMC free article] [PubMed] [Google Scholar]
- 7.Boban I, Jacquin C, Prior K, Barisic-Dujmovic T, Maye P, Clark S, Aguila H. The 3.6 kb DNA fragment from the rat Col1a1 gene promoter drives the expression of genes in both osteoblast and osteoclast lineage cells. Bone. 2006;39:1302–12. doi: 10.1016/j.bone.2006.06.025. [DOI] [PubMed] [Google Scholar]
- 8.Bouloux P. Testim 1% testosterone gel for the treatment of male hypogonadism. Clin Ther. 2005;27:286–98. doi: 10.1016/j.dinthera.2005.02.015. [DOI] [PubMed] [Google Scholar]
- 9.Chavassieux P, Seeman E, Delmas P. Insights into material and structural basis of bone fragility from diseases associated with fractures: how determinants of the biomechanical properties of bone are compromised by disease. Endocr Rev. 2007;28:151–64. doi: 10.1210/er.2006-0029. [DOI] [PubMed] [Google Scholar]
- 10.Chen Q, Kaji H, Sugimoto T, Chihara K. Testosterone inhibits osteoclast formation stimulated by parathyroid hormone through androgen receptor. FEBS Lett. 2001;491:91–3. doi: 10.1016/s0014-5793(01)02160-3. [DOI] [PubMed] [Google Scholar]
- 11.Choi H, Gray P, Storer T, Calof O, Woodhouse L, Singh A, Padero C, Mac R, Sinha-Hikim I, Shen R, Dzekov J, Dzekov C, Kushnir M, Rockwood A, Meikle A, Lee M, Hays R, Bhasin S. Effects of testosterone replacement in human immunodeficiency virus-infected women with weight loss. J Clin Endocrinol Metab. 2005;90:1531–41. doi: 10.1210/jc.2004-1677. [DOI] [PubMed] [Google Scholar]
- 12.Dacic S, Kalajzic I, Visnjic D, Lichtler A, Rowe D. Col1a1-driven transgenic markers of osteoblast lineage progression. J Bone Miner Res. 2001;16:1228–36. doi: 10.1359/jbmr.2001.16.7.1228. [DOI] [PubMed] [Google Scholar]
- 13.Duan Y, Turner C, Kim B, Seeman E. Sexual dimorphism in vertebral fragility is more the result of gender differences in age-related bone gain than bone loss. J Bone Miner Res. 2001;16:2267–75. doi: 10.1359/jbmr.2001.16.12.2267. [DOI] [PubMed] [Google Scholar]
- 14.Falahati-Nini A, Riggs B, Atkinson E, O’Fallon W, Eastell R, Khosla S. Relative contributions of testosterone and estrogen in regulating bone resorption and formation in normal elderly men. J Clin Invest. 2000;106:1553–60. doi: 10.1172/JCI10942. [DOI] [PMC free article] [PubMed] [Google Scholar]
- 15.Fan W, Yanase T, Nomura M, Okabe T, Goto K, Sato T, Kawano H, Kato S, Nawata H. Androgen receptor null male mice develop late-onset obesity caused by decreased energy expenditure and lipolytic activity but show normal insulin sensitivity with high adiponectin secretion. Diabetes. 2005;54:1000–8. doi: 10.2337/diabetes.54.4.1000. [DOI] [PubMed] [Google Scholar]
- 16.Fujita T, Ohtani J, Shigekawa M, Kawata T, Kaku M, Kohno S, Tsutsui K, Tenjo K, Motokawa M, Tohma Y, Tanne K. Effects of sex hormone disturbances on craniofacial growth in newborn mice. J Dent Res. 2004;83:250–4. doi: 10.1177/154405910408300313. [DOI] [PubMed] [Google Scholar]
- 17.Gennari L, Merlotti D, Martini G, Gonnelli S, Franci B, Campagna S, Lucani B, Dal Canto N, Valenti R, Gennari C, Nuti R. Longitudinal association between sex hormone levels, bone loss, and bone turnover in elderly men. J Clin Endocrinol Metab. 2003;88(11):5327–33. doi: 10.1210/jc.2003-030736. [DOI] [PubMed] [Google Scholar]
- 18.Gray C, Colston K, Mackay A, Taylor M, Arnett T. Interaction of androgen and 1,25-dihydroxyvitamin D3: effects on normal rat bone cells. J Bone Miner Res. 1992;7:41–6. doi: 10.1002/jbmr.5650070107. [DOI] [PubMed] [Google Scholar]
- 19.Hashimoto JG, Beadles-Bohling AS, Wiren KM. Comparison of RiboGreen and 18S rRNA quantitation for normalizing real-time RT-PCR expression analysis. Biotech-niques. 2004;36(54–6):58–60. doi: 10.2144/04361BM06. [DOI] [PubMed] [Google Scholar]
- 20.Hijazi R, Cunningham G. Andropause: is androgen replacement therapy indicated for the aging male? Annu Rev Med. 2005;56:117–37. doi: 10.1146/annurev.med.56.082103.104518. [DOI] [PubMed] [Google Scholar]
- 21.Hofbauer L, Hicok K, Khosla S. Effects of gonadal and adrenal androgens in a novel androgen-responsive human osteoblastic cell line. J Cell Biochem. 1998;71:96–108. [PubMed] [Google Scholar]
- 22.Jepsen K, Hu B, Tommasini S, Courtland H, Price C, Terranova C, Nadeau J. Genetic randomization reveals functional relationships among morphologic and tissue-quality traits that contribute to bone strength and fragility. Mamm Genome. 2007;18:492–507. doi: 10.1007/s00335-007-9017-5. [DOI] [PMC free article] [PubMed] [Google Scholar]
- 23.Jepsen K, Pennington D, Lee Y-L, Warman M, Nadeau J. Bone brittleness varies with genetic background in A/J and C57BL/6J inbred mice. J Bone Miner Res. 2001;16:1854–62. doi: 10.1359/jbmr.2001.16.10.1854. [DOI] [PubMed] [Google Scholar]
- 24.Jiang X, Kalajzic Z, Maye P, Braut A, Bellizzi J, Mina M, Rowe DW. Histological analysis of GFP expression in murine bone. J Histochem Cytochem. 2005;53:593–602. doi: 10.1369/jhc.4A6401.2005. [DOI] [PubMed] [Google Scholar]
- 25.Kalajzic I, Kalajzic Z, Kaliterna M, Gronowicz G, Clark S, Lichtler A, Rowe D. Use of type I collagen green fluorescent protein transgenes to identify subpopulations of cells at different stages of the osteoblast lineage. J Bone Miner Res. 2002;17:15–25. doi: 10.1359/jbmr.2002.17.1.15. [DOI] [PubMed] [Google Scholar]
- 26.Kalajzic Z, Liu P, Kalajzic I, Du Z, Braut A, Mina M, Canalis E, Rowe D. Directing the expression of a green fluorescent protein transgene in differentiated osteoblasts: comparison between rat type I collagen and rat osteocalcin promoters. Bone. 2002;31:654–60. doi: 10.1016/s8756-3282(02)00912-2. [DOI] [PubMed] [Google Scholar]
- 27.Kapur S, Reddi A. Influence of testosterone and dihydrotestosterone on bone-matrix induced endochondral bone formation. Calcif Tissue Int. 1989;44:108–13. doi: 10.1007/BF02556469. [DOI] [PubMed] [Google Scholar]
- 28.Kato S, Matsumoto T, Kawano H, Sato T, Takeyama K. Function of androgen receptor in gene regulations. Steroid Biochem Mol Biol. 2004;89–90(1–5):627–33. doi: 10.1016/j.jsbmb.2004.03.099. [DOI] [PubMed] [Google Scholar]
- 29.Kawano H, Sato T, Yamada T, Matsumoto T, Sekine K, Watanabe T, Nakamura T, Fukuda T, Yoshimura K, Yoshizawa T, Aihara K, Yamamoto Y, Nakamichi Y, Metzger D, Chambon P, Nakamura K, Kawaguchi H, Kato S. Suppressive function of androgen receptor in bone resorption. Proc Natl Acad Sci USA. 2003;100:9416–21. doi: 10.1073/pnas.1533500100. [DOI] [PMC free article] [PubMed] [Google Scholar]
- 30.Kenny A, Raisz L. Mechanisms of bone remodeling: implications for clinical practice. J Reprod Med. 2002;47:63–70. [PubMed] [Google Scholar]
- 31.Kim BT, Mosekilde L, Duan Y, Zhang XZ, Tornvig L, Thomsen JS, Seeman E. The structural and hormonal basis of sex differences in peak appendicular bone strength in rats. J Bone Miner Res. 2003;18:150–5. doi: 10.1359/jbmr.2003.18.1.150. [DOI] [PubMed] [Google Scholar]
- 32.Krupski TL, Foley KA, Baser O, Long S, Macarios D, Litwin MS. Health care cost associated with prostate cancer, androgen deprivation therapy and bone complications. J Urol. 2007;178(4):1423–8. doi: 10.1016/j.juro.2007.05.135. [DOI] [PubMed] [Google Scholar]
- 33.Leder B. Gonadal steroids and bone metabolism in men. Curr Opin Endocrinol Diabetes Obes. 2007;14:241–6. doi: 10.1097/MED.0b013e32814db87b. [DOI] [PubMed] [Google Scholar]
- 34.Leder B, LeBlanc K, Schoenfeld D, Eastell R, Finkelstein J. Differential effects of androgens and estrogens on bone turnover in normal men. J Clin Endocrinol Metab. 2003;88:204–10. doi: 10.1210/jc.2002-021036. [DOI] [PubMed] [Google Scholar]
- 35.Liegibel U, Sommer U, Tomakidi P, Hilscher U, Van Den Heuvel L, Pirzer R, Hillmeier J, Nawroth P, Kasperk C. Concerted action of androgens and mechanical strain shifts bone metabolism from high turnover into an osteoanabolic mode. J Exp Med. 2002;196:1387–92. doi: 10.1084/jem.20021017. [DOI] [PMC free article] [PubMed] [Google Scholar]
- 36.Liu F, Woitge HW, Braut A, Kronenberg MS, Lichtler AC, Mina M, Kream BE. Expression and activity of osteoblast-targeted Cre recombinase transgenes in murine skeletal tissues. Int J Dev Biol. 2004;48:645–53. doi: 10.1387/ijdb.041816fl. [DOI] [PubMed] [Google Scholar]
- 37.Marijanovic I, Jiang X, Kronenberg M, Stover M, Erceg I, Lichtler A, Rowe D. Dual reporter transgene driven by 2.3Col1a1 promoter is active in differentiated osteoblasts. Croat Med J. 2003;44:412–7. [PubMed] [Google Scholar]
- 38.Moverare S, Venken K, Eriksson A, Andersson N, Skrtic S, Wergedal J, Mohan S, Salmon P, Bouillon R, Gustafsson J, Vanderschueren D, Ohlsson C. Differential effects on bone of estrogen receptor alpha and androgen receptor activation in orchidectomized adult male mice. Proc Natl Acad Sci USA. 2003;100:13573–8. doi: 10.1073/pnas.2233084100. [DOI] [PMC free article] [PubMed] [Google Scholar]
- 39.Murphy K, Thomas S, Mlcak R, Chinkes D, Klein G, Herndon D. Effects of long-term oxandrolone administration in severely burned children. Surgery. 2004;136:219–24. doi: 10.1016/j.surg.2004.04.022. [DOI] [PubMed] [Google Scholar]
- 40.Nakamura T, Watanabe T, Nakamichi Y, Fukuda T, Matsumoto T, Yoshimura K, Miyamoto J, Yamamoto Y, Shiina H, Tanaka S, Sakari M, Sato T, Metzger D, Chambon P, Kato S. Genetic evidence of androgen receptor function in osteoclasts: generation and characterization of osteoclast-specific androgen receptor knockout mice. J Bone Miner Res. 2004;19(Suppl 1):S3. abstract #1006. [Google Scholar]
- 41.Nieves JW, Formica C, Ruffing J, Zion M, Garrett P, Lindsay R, Cosman F. Males have larger skeletal size and bone mass than females, despite comparable body size. J Bone Miner Res. 2005;20:529–35. doi: 10.1359/JBMR.041005. [DOI] [PubMed] [Google Scholar]
- 42.Nyquist F, Gärdsell P, Sernbo I, Jeppsson J, Johnell O. Assessment of sex hormones and bone mineral density in relation to occurrence of fracture in men: a prospective population-based study. Bone. 1998;22(2):147–51. doi: 10.1016/s8756-3282(97)00250-0. [DOI] [PubMed] [Google Scholar]
- 43.Otsu N. A threshold selection method from gray-level histograms. IEEE Trans Systems Man Cybern. 1979;9:62–6. [Google Scholar]
- 44.Parfitt A, Drezner M, Glorieux F, Kanis J, Malluche H, Meunier P, Ott S, Recker R. Bone histomorphometry: standardization of nomenclature, symbols, and units. Report of the ASBMR Histomorphometry Nomenclature Committee. J Bone Miner Res. 1987;2:595–610. doi: 10.1002/jbmr.5650020617. [DOI] [PubMed] [Google Scholar]
- 45.Pederson L, Kremer M, Judd J, Pascoe D, Spelsberg T, Riggs B, Oursler M. Androgens regulate bone resorption activity of isolated osteoclasts in vitro. Proc Natl Acad Sci USA. 1999;96:505–10. doi: 10.1073/pnas.96.2.505. [DOI] [PMC free article] [PubMed] [Google Scholar]
- 46.Poole KE, van Bezooijen RL, Loveridge N, Hamersma H, Papapoulos SE, Lowik CW, Reeve J. Sclerostin is a delayed secreted product of osteocytes that inhibits bone formation. Faseb J. 2005;19:1842–4. doi: 10.1096/fj.05-4221fje. [DOI] [PubMed] [Google Scholar]
- 47.Raisz L, Wiita B, Artis A, Bowen A, Schwartz S, Trahiotis M, Shoukri K, Smith J. Comparison of the effects of estrogen alone and estrogen plus androgen on biochemical markers of bone formation and resorption in postmenopausal women. J Clin Endocrinol Metab. 1996;81:37–43. doi: 10.1210/jcem.81.1.8550780. [DOI] [PubMed] [Google Scholar]
- 48.Rapado A, Hawkins F, Sobrinho L, Díaz-Curiel M, Galvao-Telles A, Arver S, Melo Gomes J, Mazer N, Garcia e Costa J, Horcajada C, López-Gavilanes E, Mascarenhas M, Papapietro K, López Alvarez M, Pereira M, Martinez G, Valverde I, García J, Carballal J, García I. Bone mineral density and androgen levels in elderly males. Calcif Tiss Int. 1999;65(6):417–21. doi: 10.1007/s002239900726. [DOI] [PubMed] [Google Scholar]
- 49.Ryan CW, Huo D, Stallings JW, Davis RL, Beer TM, McWhorter LT. Lifestyle factors and duration of androgen deprivation affect bone mineral density of patients with prostate cancer during first year of therapy. Urology. 2007;70:122–6. doi: 10.1016/j.urology.2007.03.026. [DOI] [PubMed] [Google Scholar]
- 50.Seeman E. Osteocytes–martyrs for integrity of bone strength. Osteoporos Int. 2006;17:1443–8. doi: 10.1007/s00198-006-0220-0. [DOI] [PubMed] [Google Scholar]
- 51.Seeman E. The structural and biomechanical basis of the gain and loss of bone strength in women and men. Endocrinol Metab Clin North Am. 2003;32:25–38. doi: 10.1016/s0889-8529(02)00078-6. [DOI] [PubMed] [Google Scholar]
- 52.Sinha-Hikim I, Taylor W, Gonzalez-Cadavid N, Zheng W, Bhasin S. Androgen receptor in human skeletal muscle and cultured muscle satellite cells: up-regulation by androgen treatment. J Clin Endocrinol Metab. 2004;89:5245–55. doi: 10.1210/jc.2004-0084. [DOI] [PubMed] [Google Scholar]
- 53.Takeuchi M, Kakushi H, Tohkin M. Androgens directly stimulate mineralization and increase androgen receptors in human osteoblast-like osteosarcoma cells. Biochem Biophys Res Commun. 1994;204:905–11. doi: 10.1006/bbrc.1994.2545. [DOI] [PubMed] [Google Scholar]
- 54.Turner A, Chen T, Barber T, Malabanan A, Holick M, Tangpricha V. Testosterone increases bone mineral density in female-to-male transsexuals: a case series of 15 subjects. Clin Endocrinol (Oxf) 2004;61:560–6. doi: 10.1111/j.1365-2265.2004.02125.x. [DOI] [PMC free article] [PubMed] [Google Scholar]
- 55.Turner R, Hannon K, Demers L, Buchanan J, Bell N. Differential effects of gonadal function on bone histomorphometry in male and female rats. J Bone Miner Res. 1989;4:557–63. doi: 10.1002/jbmr.5650040415. [DOI] [PubMed] [Google Scholar]
- 56.van den Beld A, de Jong F, Grobbee D, Pols H, Lamberts S. Measures of bioavailable serum testosterone and estradiol and their relationships with muscle strength, bone density, and body composition in elderly men. J Clin Endocrinol Metab. 2000;85(9):3276–82. doi: 10.1210/jcem.85.9.6825. [DOI] [PubMed] [Google Scholar]
- 57.van der Eerden B, van Til N, Brinkmann A, Lowik C, Wit J, Karperien M. Gender differences in expression of androgen receptor in tibial growth plate and metaphyseal bone of the rat. Bone. 2002;30:891–6. doi: 10.1016/s8756-3282(02)00723-8. [DOI] [PubMed] [Google Scholar]
- 58.Vandenput L, Swinnen J, Boonen S, Van Herck E, Erben R, Bouillon R, Vanderschueren D. Role of the androgen receptor in skeletal homeostasis: the androgen-resistant testicular feminized male mouse model. J Bone Miner Res. 2004;19:1462–70. doi: 10.1359/JBMR.040505. [DOI] [PubMed] [Google Scholar]
- 59.Vanderschueren D, Vandenput L, Boonen S, Lindberg M, Bouillon R, Ohlsson C. Androgens and bone. Endocr Rev. 2004;25:389–425. doi: 10.1210/er.2003-0003. [DOI] [PubMed] [Google Scholar]
- 60.Venken K, Moverare-Skrtic S, Kopchick J, Coschigano K, Ohlsson C, Boonen S, Bouillon R, Vanderschueren D. Impact of androgens, growth hormone, and IGF-I on bone and muscle in male mice during puberty. J Bone Miner Res. 2007;22:72–82. doi: 10.1359/jbmr.060911. [DOI] [PubMed] [Google Scholar]
- 61.Wang C, Cunningham G, Dobs A, Iranmanesh A, Matsumoto A, Snyder P, Weber T, Berman N, Hull L, Swerdloff R. Long-term testosterone gel (AndroGel) treatment maintains beneficial effects on sexual function and mood, lean and fat mass, and bone mineral density in hypogonadal men. J Clin Endocrinol Metab. 2004;89:2085–98. doi: 10.1210/jc.2003-032006. [DOI] [PubMed] [Google Scholar]
- 62.Wang X, Duan Y, Beck T, Seeman E. Varying contributions of growth and ageing to racial and sex differences in femoral neck structure and strength in old age. Bone. 2005;36:978–86. doi: 10.1016/j.bone.2004.11.015. [DOI] [PubMed] [Google Scholar]
- 63.Wiren KM. Androgens and bone growth: it’s location, location, location. Curr Opin Pharmacol. 2005;5:626–32. doi: 10.1016/j.coph.2005.06.003. [DOI] [PubMed] [Google Scholar]
- 64.Wiren KM, Chapman Evans A, Zhang XW. Osteoblast differentiation influences androgen and estrogen receptor-alpha and -beta expression. J Endocrinol. 2002;175:683–94. doi: 10.1677/joe.0.1750683. [DOI] [PubMed] [Google Scholar]
- 65.Wiren KM, Toombs AR, Semirale AA, Zhang X. Osteoblast and osteocyte apoptosis associated with androgen action in bone: requirement of increased Bax/Bcl-2 ratio. Bone. 2006;38:637–51. doi: 10.1016/j.bone.2005.10.029. [DOI] [PubMed] [Google Scholar]
- 66.Wiren KM, Toombs AR, Zhang XW. Androgen inhibition of MAP kinase pathway and Elk-1 activation in proliferating osteoblasts. J Mol Endocrinol. 2004;32:209–26. doi: 10.1677/jme.0.0320209. [DOI] [PubMed] [Google Scholar]
- 67.Wiren KM, Zhang XW, Toombs AR, Kasparcova V, Gentile MA, Harada S, Jepsen KJ. Targeted overexpression of androgen receptor in osteoblasts: unexpected complex bone phenotype in growing animals. Endocrinology. 2004;145:3507–22. doi: 10.1210/en.2003-1016. [DOI] [PubMed] [Google Scholar]
- 68.Yap F, Hogler W, Briody J, Moore B, Howman-Giles R, Cowell C. The skeletal phenotype of men with previous constitutional delay of puberty. J Clin Endocrinol Metab. 2004;89:4306–11. doi: 10.1210/jc.2004-0046. [DOI] [PubMed] [Google Scholar]
- 69.Yeh S, Tsai M, Xu Q, Mu X, Lardy H, Huang K, Lin H, Yeh S, Altuwaijri S, Zhou X, Xing L, Boyce B, Hung M, Zhang S, Gan L, Chang C, Hung M. Generation and characterization of androgen receptor knockout (ARKO) mice: an in vivo model for the study of androgen functions in selective tissues. Proc Natl Acad Sci USA. 2002;99:13498–503. doi: 10.1073/pnas.212474399. [DOI] [PMC free article] [PubMed] [Google Scholar]