Abstract
Objectives
No simple method exists for repeatedly measuring cardiac output in intensive care pediatric and neonatal patients. The purpose of this study is to present the theory and examine the in vitro accuracy of a new ultrasound dilution cardiac output measurement technology in which an extracorporeal arteriovenous tubing loop is inserted between existing arterial and venous catheters.
Design
Laboratory experiments.
Setting
Research laboratory.
Subjects
None.
Interventions
None.
Measurements and Main Results
In vitro validations of cardiac output, central blood volume, total end-diastolic volume, and active circulation volume were performed in a model mimicking pediatric (children 2-10 kg) and neonatal (0.5-3 kg) flows and volumes against flows and volumes measured volumetrically. Reusable sensors were clamped onto the arterial and venous limbs of the arteriovenous loop. A peristaltic pump was used to circulate liquid at 6-12 mL/min from the artery to the vein through the arteriovenous loop. Body temperature injections of isotonic saline (0.3-10 mL) were performed. In the pediatric setting, the absolute difference between cardiac output measured by dilution and cardiac output measured volumetrically was 3.97% ± 2.97% (range 212-1200 mL/min); for central blood volume the difference was 4.59% ± 3.14% (range 59-315 mL); for total end-diastolic volume the difference was 4.10% ± 3.08% (range 24-211 mL); and for active circulation volume the difference was 3.30% ± 3.07% (range 247-645 mL). In the neonatal setting the difference for cardiac output was 4.40% ± 4.09% (range 106-370 mL/min); for central blood volume the difference was 4.90% ± 3.69% (range 50-62 mL); and for active circulation volume the difference was 5.39% ± 4.42% (range 104-247 mL).
Conclusions
In vitro validation confirmed the ability of the ultrasound dilution technology to accurately measure small flows and volumes required for hemodynamic assessments in small pediatric and neonatal patients. Clinical studies are in progress to assess the reliability of this technology under different clinical situations.
Keywords: cardiac output, blood volume, ultrasound dilution, pediatric, neonatal, validation
No routine method exists for repetitive measurements of cardiac output (CO) in pediatric and neonatal intensive care unit (ICU) patients. The small size of blood vessels, the amount of blood involved, and the need to use toxic indicators limit the routine use of existing methods (1, 2). Ul-trasound dilution (UD) technology, used in extracorporeal circuits (mostly in hemodialysis), uses isotonic saline as an indicator to measure hemodynamic variables (3, 4). The purpose of this study is to present the theory and examine the in vitro accuracy of a novel application for UD technology. In this application, an extracorporeal arteriovenous (AV) tubing loop is inserted between existing arterial and venous catheters to measure hemodynamic variables in ICU patients.
MATERIALS AND METHODS
Cardiac Output
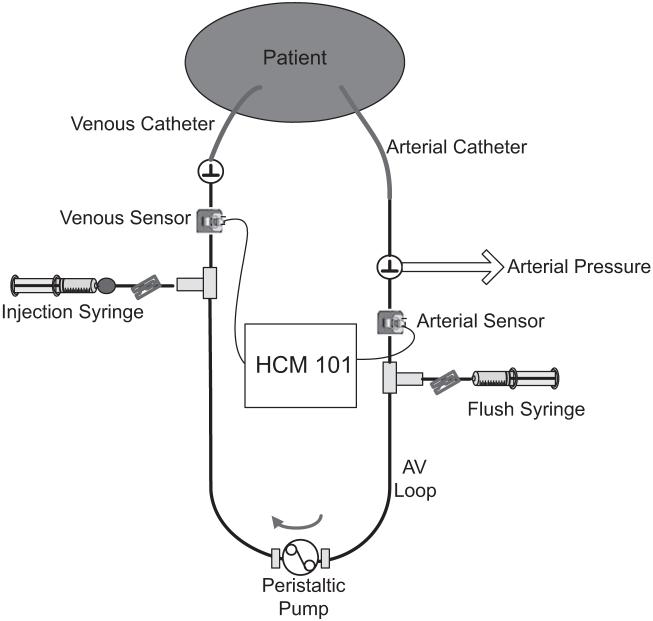
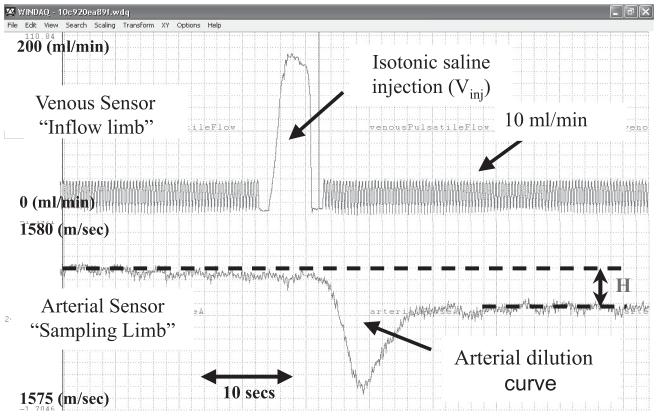
Blood ultrasound velocity (1560-1585 m/sec) is a function of total blood protein concentration (sum of proteins in plasma and in red blood cells), temperature, and average ion concentration in plasma (3, 4). Injection of body temperature isotonic saline (ultrasound velocity of saline is 1533 m/sec) into the AV loop (Fig. 1) decreases blood ultrasound velocity, producing dilution curves (Fig. 2). The CO calculation is based on the Stuart-Hamilton principle:
| [1] |
where Vinj is the volume of injected isotonic saline (mL), measured by venous sensor (Fig. 2 upper curve); UVblood - UVsaline is the difference between ultrasound velocity of blood and saline measured by venous sensor; UVa refers to changes in arterial blood ultrasound velocity measured by arterial sensor (Fig. 2 lower curve); is the area under the dilution curve of the saline concentration in arterial blood (mL [saline]/mL [blood], see scale in Fig. 3); and Ca(t) is the concentration of injected saline in arterial blood (Fig. 3), which is calculated from the changes in blood ultrasound velocity and the difference between ultrasound velocity of blood and saline measured by venous sensor, assuming that blood ultrasound velocity changes linearly by saline dilution (3, 4).
Figure 1.
Schematic of the arteriovenous (AV) loop setup to measure hemodynamic variables by ultrasound dilution technology.
Figure 2.
Raw data curves from a 5.6-kg patient. Upper curve represents the increase in the flow recorded by the venous sensor due to injection of 5 mL of isotonic saline. Lower curve represents the decrease of blood ultrasound velocity recorded by the arterial sensor during the saline bolus pass.
Figure 3.
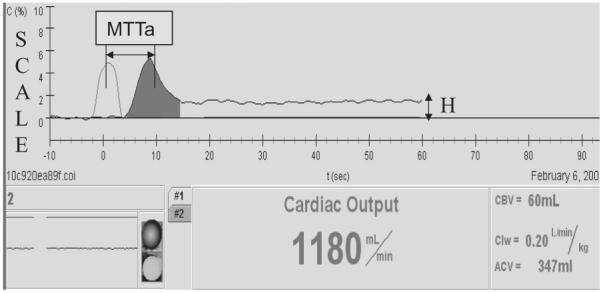
HCM 101 screen shot from a 5.6-kg patient. Scale is the percent concentration of saline in blood: mL (saline)/mL (blood). The concentration of injected isotonic saline (5 mL) becomes largely stable within 40-60 secs from the time of injection. MTTa, time during which the indicator travels from the injection site (venous sensor) to the arterial sensor; CBV, central blood volume; ACV, active circulation volume; Clw, cardiac index; cardiac output hormalized on body weight.
Central blood volume (CBV) is calculated as the volume between the injection site (central vein) and the recording site (peripheral artery) and includes the volume of blood in the heart, lungs, and large vessels (5).
| [2] |
where MTTa is the time during which the indicator travels from the injection site (venous sensor) to the arterial sensor (Fig. 3); MTTv is the mean transit time of venous injection recorded by the venous sensor; MTTt is the mean transit time during which the indicator travels in the arterial loop before reaching the sensor (MTTt = Va/Qa, where Va is the known priming volume of the tubing segment; and Qa is known blood flow in the loop).
Total end-diastolic volume (TEDV) is the sum of end-diastolic volumes of the atria and ventricles. Its calculation is based on the assumption that a major spread of the arterial curve vs. venous curve (Figs. 2 and 3) is due to the indicator traveling through the heart chambers (6).
| [3] |
where CHc = (CHart 2 - CHven 2)1/2; HR is heart rate (number of heart beats per minute); and CHven and CHart are chords (width of the curve at one-half the maximum height of the curve) of venous and arterial curves in minutes, respectively.
Active circulation volume (ACV) is defined as the volume of blood in which the indicator mixes in 1 min from the time of injection (4, 7).
| [4] |
where Vinj is the volume of injected isotonic saline in milliliters, and H is the new level of isotonic saline concentration in blood (mL [saline]/mL [blood]) at the end of the first minute after venous injection as recorded by the arterial sensor (Figs. 2 and 3).
In a clinical setting, a disposable AV loop, primed with heparinized saline, (priming volume 0.9-2.4 mL, depending on patient size) is connected between existing arterial and venous catheters (Fig. 1). Reusable paired flow/ dilution sensors that measure tubing blood flow and UD are clamped onto the respective arterial and venous limbs of the AV loop. To perform measurements, a peristaltic pump circulates blood through the AV loop from the artery to the vein for 5-6 mins at 6-12 mL/ min. Isotonic saline, heated to body temperature in a saline fluid warmer (HFW 1000, Transonic Systems), is drawn from the bag with a syringe and quickly injected, 0.5-1 mL/kg of body weight (up to 30 mL), into the venous limb of the AV loop. Depending on the resistance of the venous catheter lumen, it takes 0.5-4 secs to perform a 0.5- to 10-mL saline injection. Hemodynamic variables are automatically calculated and displayed on a HCM101 monitor (Transonic Systems). After two to three discrete measurements, the AV loop is filled with heparinized saline and left intact until the next measurement cycle.
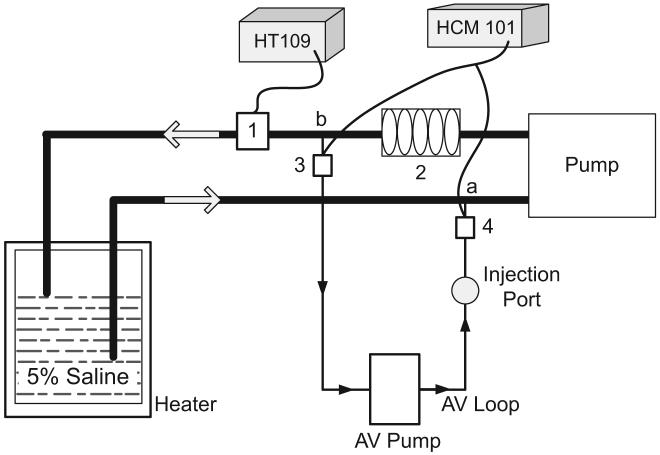
In a bench model (Fig. 4), CO, CBV, TEDV, and ACV were measured with two size modifications. The first modification was customized for a neonatal setting, with volume and flow variables approximating those of low-weight newborns of 0.5-3 kg. A 5-Fr umbilical venous catheter and a 3-Fr umbilical arterial catheter were used for this modification. The second modification was customized for a pediatric setting, with volume and flow variables approximating those of small patients weighing 2-10 kg. A 4-Fr duallumen central venous catheter and a 20-gauge arterial catheter were used. The approximate weight divisions for the modifications were based on the Food and Drug Administration’s (8) definition of low-weight newborns as weighing <2.5 kg. CO and its changes were simulated by pump flow variation. To ensure stability of the flow during the dilution measurements, a clamp-on transit-time flow sensor (HT109, Transonic Systems) was positioned on the line (Fig. 4). Flow was volumetrically calibrated after each measurement cycle. Volumetric measurements were made by direct sampling of the liquid into a volumetric flask and graduated cylinder with stopwatch time count from 30 to 60 secs for flow recording. TEDV was simulated by a mixing chamber consisting of one to five bubble traps (similar to those used in hemodialysis catheters) connected in series and the volume in the pump segment. CBV was simulated as the volume between point a (Fig. 4) and point b (Fig. 4) that included the TEDV plus the liquid in the tubing segments leading from point a (Fig. 4) to pump segment and from bubble traps to point b (Fig. 4). ACV was simulated by the volume in the entire system, which included the CBV, plus the volume in the tubing lines leading to the water tank from points a and b, plus liquid in the tank. Varying the number of bubble traps, length of the tubing lines, and the amount of liquid in the tank made it possible to vary the volumes—TEDV, CBV, and ACV.
Figure 4.
Schematic of the in vitro model. 1, transit time clamp-on flow sensor connected to HT109 measuring the total flow; 2, mixing chamber containing one to five bubble traps to simulate the total end-diastolic volume; 3 and 4, arterial and venous flow/dilution clamp-on sensors, respectively; a, venous catheter location for injection; b, arterial catheter location for withdraw. Catheters and the mixing device used in the saline jar are not shown in the figure. AV, active circulation volume.
For the simulated neonatal setting, 0.3-3 mL of saline was injected over 0.5-2 secs. For the simulated pediatric setting, 2-10 mL of saline was injected over 1-4 secs.
Hypertonic saline was circulated in the model (Fig. 4), as it has been proven to be a convenient and valid blood substitute for bench modeling of UD technology (3, 9). The equivalency of hypertonic saline to blood for UD measurements is based on blood homogeneity for ultrasound wave propagation in the range of 4.8 MHz where the HCM101 operates. This equivalency is supported by publications related to theory and experiments of ultrasound propagation in blood and saline (3, 9, 10). This equivalency was also observed during direct injections of hypertonic solutions into blood in lung water measurements in hemodialysis patients (11). The accuracy of UD methodology was investigated over a wide range of hypertonic solutions (3% to 6% NaCl) equivalent to blood with a hematocrit of 25% to 55% and over a wide range of injection temperatures (29-38°C) and injection volumes (0.3-10 mL).
Statistics
Absolute percent error was calculated for every bench measurement (without averaging) as
| [5] |
where P is the model variable measured by dilution, and Pv is a variable measured volumetrically.
RESULTS
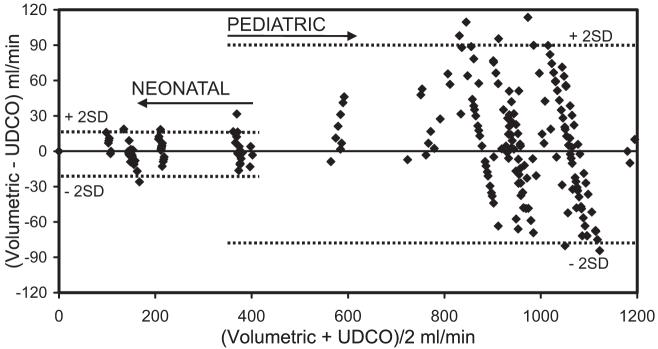
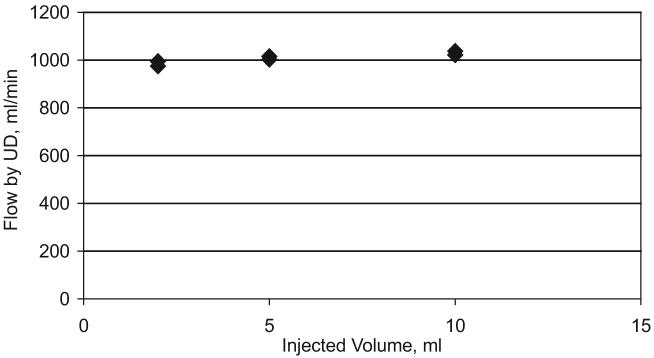
Results presented in Table 1 and in Figure 5 include all the measurements performed, without any averaging. The mean absolute error for all the measurements was in the range of 3.30% to 5.39%. For the simulated neonatal setting, the mean absolute error was approximately 0.5% larger than for the simulated pediatric setting. Practically all CO data (2 sd) were within 10% of volumetric data for the simulated pediatric setting and within 12% for the simulated neonatal setting. Bias between volumetric and UD measurement of in vitro CO was 6 mL/min for the pediatric setting and -2 mL/min for the neonatal setting (Fig. 5). CBV, TEDV, and ACV were within 10% to 12% of volumetric data for the pediatric setting and within 12% to 14% for the neonatal setting (Table 1). The injection volume change from 2 mL to 10 mL (Fig. 6) produced the variation of measured CO within 5%. This confirms the ability of the venous sensor (Fig. 1) to minimize the influence of operator errors during clinical use.
Table 1.
In vitro comparison of ultrasound dilution measurements with volumetric data for neonatal and pediatric flow and volume settings
| Parameter Range |
Accuracy: δ = Mean ± sd% |
||||
|---|---|---|---|---|---|
| Parameter | Number of Measurements | Neonate | Pediatric | Neonate | Pediatric |
| CO, mL/min | n = 245 | 106-370 | 212-1200 | 4.40 ± 4.09 | 3.97 ± 2.97 |
| CBV mL | n = 245 | 50-62 | 59-315 | 4.90 ± 3.69 | 4.59 ± 3.14 |
| aTEDV mL | n = 225 | N/A | 24-211 | N/A | 4.10 ± 3.08 |
| ACV mL | n = 44 | 104-247 | 247-645 | 5.39± 4.42 | 3.30 ± 3.07 |
Algorithm for calculation of TEDV was adjusted for bench use.
CBV, central blood volume; CO, cardiac output; ACV, active circulation volume; TEDV, total end-diastolic volume.
Figure 5.
Bland-Altman analysis comparing volumetric flow rates with in vitro ultrasound dilution cardiac output (UDCO) measurements. Bias for the pediatric setting was 6 mL/min and for the neonatal setting -2 mL/min (not shown on the graph). Every measurement was taken into account without averaging.
Figure 6.
Results of the bench flow measurements from different injection volumes. Injection volume varied from 2 mL to 10 mL (five times) while observed changes measured by dilution were within 5%. The venous sensor measures the injection volume, and the HCM 101 automatically accounts for this, making the system operator independent. UD, ultrasound dilution.
DISCUSSION
Since its introduction in 1995 (3), UD technology has become widely used in hemodialysis and in extracorporeal membrane oxygenation to measure shunt flow, vascular access recirculation, and cardiac output. More than 100 articles referencing UD have been published in peer-reviewed journals (PubMed search). The purpose of this study is to expand the application of UD technology with its benefits of high accuracy (12-15); ability to perform measurements extracorporeally, independent of patient size; and use of reusable sensors. One prior attempt to use an AV loop approach did not use a pump (14). While the methodology produced accurate data (14), it appeared unfeasible for routine use, as blood flow in the loop was periodically unstable. In this study, the concept was to 1) use existing arterial and venous catheters to create an AV tubing loop; 2) use a special pump to propel blood flow between the catheters; and 3) create a site within the same loop for intravenous injections.
Cardiac output and central blood volume measurements assume that isotonic saline remains in the vascular bed during its first pass through the lungs. Moser and Kenner (16, 17) made precise measurements of saline loss during its first pass through the lung capillary bed using a blood densitometry technique and concluded that only 0.08% of the injected volume was lost. The absence of indicator loss was also confirmed by the high accuracy of CO measurements using isotonic saline as an indicator and recording dilution curve in peripheral arteries (12-15, 17). CBV measurements, observed in the range of 10 -25 mL/kg during hemodialysis by UD (5) and in the ICU by indocyanine green (18), have confirmed its direct relation to patient volume status.
Total end-diastolic volume is equivalent to preload volume of the heart. It ranges from 5 to 15 mL/kg depending on the patient’s heart condition and volume status. The assumption that a major spread of the arterial curve vs. the venous curve (Fig. 2) is due to indicator traversing the heart chambers is considered valid (19) except in situations with lung injury. An analogous variable called global end-diastolic volume is calculated by Pulsion technology and was recently applied to patients with septic shock (20). Since the neonatal bench model could not simulate complex heart situations in neonatal ICU patients (e.g., single ventricle), TEDV was not measured in this bench setting.
Active circulation blood volume is defined as the amount of blood that immediately supports CO through quick multiple recirculation through the heart, lungs, and other low-resistance organs, such as the brain, liver, and kidneys. Although total blood volume (∼75 mL/kg) could be used to assess a patient’s volume status, it has not gained widespread clinical acceptance since it requires the use of an isotope. Hence, researchers are now paying more attention to ACV because of its clinical value (7, 18, 21, 22). ACV ranges from 30 to 70 mL/kg depending on the volume status of the patient. For example, the curve from a 5-mL isotonic saline injection into a 5.6-kg patient (Fig. 3) shows that the concentration of saline is largely stable at the level of 1.45% within 40-60 secs from the time of injection. This means that the process of saline leaving the active circulation to slowly perfused areas (legs) or to extravascular space is relatively slow. ACV can be easily calculated using Equation 4 as ACV = 5 mL/0.0145 = 344 mL or 62 mL/kg body weight. Isotonic saline (3, 7), indocyanine green (18, 21), starch (22), and other indicators have been used to calculate ACV with measurement times of 1-5 mins depending on the indicator used. Considering the high heart rate and small size of neonatal and pediatric patients, we assume that a 1-min mixing time is adequate to assess ACV in the target patient population. Future clinical studies are needed to investigate the utility of this variable in routine patient treatment.
Bench Accuracy of Ultrasound Dilution Method
The main purpose of this in vitro study was not to simulate the extremely complicated physiology of the child but to confirm the ability of this technology to accurately measure small volumes and low flows in the range of neonatal and pediatric patients.
Volumetric measurements of flows and volumes were used as a gold standard reference for validating UD results. The error of volumetric flow measurements consists of the sampling container error and the stopwatch error. For KIMAX volumetric flasks (100-500 mL), the factory error was estimated as <0.1%. Stopwatch error can be estimated in a worstcase scenario as a quarter of a second for a 30-sec sampling, which leads to an error of 0.83%. The total error of the volumetric flow measurements is thus <1%. The factory error for the KIMAX 50-mL graduated cylinder that was used for volume estimation in the neonatal model is estimated as 1%. Thus, the accuracy of volumetric measurements by far exceeds the accuracy of any dilution method, including the UD method, and hence volumetric measurement was used as a reference.
Even without averaging the data, the in vitro study showed that the differences between volumetric and UD measurement of flows and volumes were within 10% to 12% for the pediatric setting and within 12% to 14% for the neonatal setting (Table 1). A small bias of 6 mL/min for the pediatric setting (flow range 212-1200 mL/min) and -2 mL/min for the neonatal setting (flow range 106-370 mL/min) confirms that the UD technology performs equally well over the applied range (Fig. 5).
One of the major problems with using indicator methods in small patients is the practical difficulty of injecting precise amounts (from 0.3 to 10 mL) of saline. The use of a venous sensor (Figs. 1 and 2) that automatically measures injection volume makes the system operator independent and improves accuracy (Fig. 6).
Limitations
Injection Volumes
The injection volume recommended is 0.5-1 mL/kg of body weight (up to 30 mL). Two to three injections are recommended to ensure the correct representation of a patient’s CO status due to possible physiologic variations in CO caused by breathing. In patients who are clinically sensitive to volume overload, a minimum of two injections of 0.5 mL/kg should be chosen. This additional liquid will constitute a 1% to 2% total blood volume increase, equal to or less than the increase found with the saline bolus thermodilution method. Minimizing injection volume to 0.5 mL/kg will not jeopardize CO measurements but makes it difficult to measure ACV as it requires a new stable ultrasound velocity level (Fig. 2).
Indicator Loss
In patients with inadequate lung perfusion, there could be some lung segments in which indicator enters but does not leave for a long time. In this case, the indicator return may not be counted as the first pass of the dilution curve. The indicator will be lost and CO overestimated in such a scenario. CBV will also be affected. In such a situation, the error of this method will be analogous to the errors of any other dilution methods in which indicator is sampled at the artery (e.g., all dye dilution methods, the lithium dilution method, and the transpulmonary thermodilution method).
Septal Defects
The presence of septal defects is known to produce abnormalities in dilution curves (23, 24) that may influence the accuracy of CO calculation. The presence of these abnormalities will be obvious from the dilution curve displayed on the HCM101 screen. In addition, the HCM101 software will produce a related message on the screen to alert the user.
Cardiac output in animal (rats, pigs, sheep) measured using this technology vs. CO measured by the gold standard transit-time ultrasound technology with a perivascular flow probe positioned on the pulmonary artery was presented at the 19th European Society of Intensive Care Medicine Congress, 2006 (25). The study demonstrated good correlation between methods (range r2 = .82-.94) over a wide variation of CO, ranging from 49 mL/min in a 230-g rat to 8000 mL/min in a 65-kg sheep, with injection volumes ranging between 0.3 mL and 20 mL. No adverse events were observed.
Preliminary pediatric studies were presented at the 36th Critical Care Congress, 2007 (26). The authors reported that the methodology worked reliably for any arterial catheter location (radial, femoral, and foot artery) and different venous catheter locations (jugular and femoral) in patients from 3 months to 14 yrs of age. Observed CO ranged from 0.6 to 11.6 L/min in patients weighing between 2.7 and 110 kg. No adverse events were observed.
CONCLUSION
In vitro validation confirmed the ability of the UD technology to accurately measure small flows and volumes required for hemodynamic assessments in small pediatric and neonatal size patients. Additional clinical advantages of this approach include absence of blood loss, use of existing catheters, and use of an innocuous indicator. Clinical studies are in progress to assess the reliability of this technology under different clinical situations.
ACKNOWLEDGMENTS
We thank S. Shumskaya, O. Kuznetsova, and J. Primmer for assistance with bench experiments, software development, and other support.
Supported, in part, by grant NIH SBIR R44 HL061994 from the National Institutes of Health, Bethesda, MD.
Footnotes
See also p. 449.
From Transonic Systems Inc., Ithaca, NY
REFERENCES
- 1.Orme RML’E, Pigott DW, Mihm FG. Measurement of cardiac output by transpulmonary arterial thermodilution using a long radial artery catheter: A comparison with in-termittent pulmonary artery thermodilution. Anaesthesia. 2004;59:590–594. doi: 10.1111/j.1365-2044.2004.03710.x. [DOI] [PubMed] [Google Scholar]
- 2.Linton RAF, Band DM, Haire KM. A new method of measuring cardiac output in man using lithium dilution. Br J Anaesth. 1993;71:262–266. doi: 10.1093/bja/71.2.262. [DOI] [PubMed] [Google Scholar]
- 3.Krivitski NM. Novel method to measure access flow during hemodialysis by ultrasound dilution technique. ASAIO J. 1995;41:M741–M745. doi: 10.1097/00002480-199507000-00111. [DOI] [PubMed] [Google Scholar]
- 4.Krivitski NM, Starostin D, Smith TL. Extra-corporeal recording of mouse hemodynamic parameters by ultrasound velocity dilution. ASAIO J. 1999;45:32–36. doi: 10.1097/00002480-199901000-00008. [DOI] [PubMed] [Google Scholar]
- 5.Krivitski NM, Depner TA. Cardiac output and central blood volume during hemodialysis: Methodology. Adv Ren Replace Ther. 1999;6:225–232. doi: 10.1016/s1073-4449(99)70018-x. [DOI] [PubMed] [Google Scholar]
- 6.Dobson A, Kislukhin VV. Heart blood volume by dilution in patients on hemodialysis. ASAIO J. 2004;50:278–284. doi: 10.1097/01.mat.0000123636.30437.f2. [DOI] [PubMed] [Google Scholar]
- 7.Belorusov OS, Kislukhin VV, Krivitski NM, et al. Study of parameters of central hemodynamics in patients during hemodialysis. Khirurgiia (Mosk) 1989;6:21–23. [PubMed] [Google Scholar]
- 8.FDA Premarket assessment of pediatric medical devices: Draft guidance for industry and FDA staff. [Accessed March 14, 2007];FDA Guidance. 2003 1220:4. http://www.fda.gov/cdrh/mdufma/guidance/1220.html.
- 9.Krivitski NM. Theory and validation of access flow measurement by dilution technique during hemodialysis. Kidney Int. 1995;48:244–250. doi: 10.1038/ki.1995.290. [DOI] [PubMed] [Google Scholar]
- 10.Shung K, Sigelman R, Reid J. Scattering of ultrasound by blood. IEEE Trans Biomed Eng. 1976;23:460–467. doi: 10.1109/tbme.1976.324604. [DOI] [PubMed] [Google Scholar]
- 11.MacRae JM, Joseph G, Heidenheim AP, et al. Extravascular lung water and peripheral volume status in hemodialysis patients with and without a history of heart failure. ASAIO J. 2006;52:423–429. doi: 10.1097/01.mat.0000221751.98144.03. [DOI] [PubMed] [Google Scholar]
- 12.Niciforov UV, Kisluchine VV, Chaus NI. Validation of new method to measure cardiac output during extracorporeal detoxification. ASAIO J. 1996;42:M903–M905. doi: 10.1097/00002480-199609000-00124. [DOI] [PubMed] [Google Scholar]
- 13.Kisloukhine VV, Dean DA. Validation of novel ultrasound dilution method to measure cardiac output during hemodialysis. ASAIO J. 1996;42:M906–M907. doi: 10.1097/00002480-199609000-00125. [DOI] [PubMed] [Google Scholar]
- 14.Eremenko A, Balykov I, Chaus N, et al. Use of an extracorporeal arteriovenous tubing loop to measure cardiac output in intensive care unit patients by ultrasound velocity dilution. ASAIO J. 1998;44:M462–M464. doi: 10.1097/00002480-199809000-00028. [DOI] [PubMed] [Google Scholar]
- 15.Melchior R, Darling E, Terry B, et al. A novel method of measuring cardiac output in infants following extracorporeal procedures: Preliminary validation in a swine model. Perfusion. 2005;20:323–327. doi: 10.1191/0267659105pf833oa. [DOI] [PubMed] [Google Scholar]
- 16.Moser M, Kenner T. Distribution spaces of intravenously injected saline, plasma and red cell concentrate. Pflugers Arch. 1982;394S:R48. [Google Scholar]
- 17.Moser M, Kenner T. Blood flow and blood volume determinations in aorta and in coronary circulation by density dilution. Basic Res Cardiol. 1988;83:577–589. doi: 10.1007/BF01906951. [DOI] [PubMed] [Google Scholar]
- 18.Hoeft A, Schorn B, Weyland A, et al. Bedside assessment of intravascular volume status in patients undergoing coronary bypass surgery. Anesthesiology. 1994;81:76–86. doi: 10.1097/00000542-199407000-00012. [DOI] [PubMed] [Google Scholar]
- 19.Clough AV, Haworth ST, Hanger CC, et al. Transit time dispersion in the pulmonary arterial tree. J Appl Physiol. 1998;85:565–574. doi: 10.1152/jappl.1998.85.2.565. [DOI] [PubMed] [Google Scholar]
- 20.Michard F, Alaya S, Zarka V, et al. Global end-diastolic volume as an indicator of cardiac preload in patients with septic shock. Chest. 2003;124:1900–1908. doi: 10.1378/chest.124.5.1900. [DOI] [PubMed] [Google Scholar]
- 21.Kisch H, Leucht S, Lichtwark-Aschoff M, et al. Accuracy and reproducibility of the measurement of actively circulating blood volume with an integrated fiberoptic monitoring system. Crit Care Med. 1995;23:885–893. doi: 10.1097/00003246-199505000-00017. [DOI] [PubMed] [Google Scholar]
- 22.Tschaikowsky K, Neddermeyer U, Pscheidl E, et al. Changes in circulation volume after cardiac surgery measured by a novel method using hydroxyethyl starch. Crit Care Med. 2000;28:336–431. doi: 10.1097/00003246-200002000-00008. [DOI] [PubMed] [Google Scholar]
- 23.Craenen J, Moore D, Horn A, et al. Detection of small ventricular defects: Comparison of selective left ventricular cineangiography with indicator-dilution techniques. Circulation. 1967;35:442–447. doi: 10.1161/01.cir.35.3.442. [DOI] [PubMed] [Google Scholar]
- 24.Wood E. Diagnostic application of indicator dilution techniques in congenital heart disease. Circ Res. 1962;10:531–568. doi: 10.1161/01.res.10.3.531. [DOI] [PubMed] [Google Scholar]
- 25.Gleed RD, Smith T, Callahan M, et al. Validation of novel ultrasound dilution cardiac output method for pediatric and neonatal patients. Eur Soc Intensive Care Med. 2006;32:S172. [Google Scholar]
- 26.Schulenberg A, Harmon W, Rubenstein J, et al. A novel method to measure cardiac output in the pediatric ICU: Animal validation and preliminary clinical study. Crit Care Med. 2007;34:A12. [Google Scholar]


