

Abstract
A series of complexes [FeIV(O)(TMC)(X)]+ (where X = OH−, CF3CO2−, N3−, NCS−, NCO−, and CN−) were obtained by treatment of the well characterized nonheme oxoiron(IV) complex [FeIV(O)(TMC)(NCMe)]2+ (TMC = tetramethylcyclam) with the appropriate NR4X salts. Because of the topology of the TMC macrocycle, the [FeIV(O)(TMC)(X)]+ series represents an extensive collection of S = 1 oxoiron(IV) complexes that only differ with respect to the ligand trans to the oxo unit. Electronic absorption, Fe K-edge X-ray absorption, resonance Raman, and Mössbauer data collected for these complexes conclusively demonstrate that the characteristic spectroscopic features of the S = 1 FeIV=O unit, namely i) the near-IR absorption properties, ii) X-ray absorption pre-edge intensities, and iii) quadrupole splitting parameters, are strongly dependent on the identity of the trans ligand. However, on the basis of EXAFS data, most [FeIV(O)(TMC)(X)]+ species have Fe=O bond lengths similar to that of [FeIV(O)(TMC)(NCMe)]2+ (1.66 ± 0.02 Å). The mechanisms by which the trans ligands perturb the FeIV=O unit were probed using density functional theory (DFT) computations, yielding geometric and electronic structures in good agreement with our experimental data. These calculations revealed that the trans ligands modulate the energies of the Fe=O σ- and π-antibonding molecular orbitals, causing the observed spectroscopic changes. Time-dependent DFT methods were used to aid in the assignment of the intense near-UV absorption bands found for the oxoiron(IV) complexes with trans N3−, NCS−, and NCO− ligands as X−-to-FeIV=O charge transfer transitions, thereby rationalizing the resonance enhancement of the ν(Fe=O) mode upon excitation of these chromophores.
1. Introduction
Iron plays a number of fundamental roles in biological systems, but perhaps no role has attracted greater attention among chemists than that of oxygen activation.1–4 Certain classes of both heme and nonheme iron enzymes harness the oxidizing power of O2 to perform vital biological transformations, such as the hydroxylation of unactivated C–H bonds. For the heme systems it is generally accepted that the active oxidant for these reactions is the so-called Compound I intermediate, an oxoiron(IV) unit coupled to a porphyrin cation radical.4 For certain classes of O2-activating mononuclear nonheme iron systems, it has been assumed for several years that an oxoiron(IV) center is the active oxidant.1 Recent work has established the presence of such intermediates in the catalytic cycles of several nonheme iron enzymes,5 namely the α-ketoglutarate-dependent taurine:α-ketoglutarate dioxygenase (TauD),6–9 prolyl-4-hydroxylase,10 and the halogenase CytC3,11 as well as the tetrahydropterin-dependent tyrosine hydroxylase.12 These oxoiron(IV) species all have S = 2 ground states, and the Fe=O bond lengths of the TauD and CytC3 intermediates were determined to be 1.61–1.62 Å by analysis of extended X-ray absorption fine structure (EXAFS) data.8,13 The observation of oxoiron(IV) intermediates in four different nonheme iron enzymes greatly strengthens the notion that the FeIV=O unit is a common oxidant.
Because of its occurrence in the catalytic cycles of nonheme iron enzymes, as well as the possible utility of analogous biomimetic oxidants in hydroxylation and O-atom transfer reactions,14,15,16 the oxoiron(IV) unit has long been a target of the modeling community. Within the last several years, synthetic efforts have yielded a variety of mononuclear nonheme oxoiron(IV) complexes,16–23 most of which have been found to have S = 1 ground states.24 Two X-ray crystal structures featuring mononuclear FeIV=O units have been reported,18,21 with a representation based on that of [FeIV(O)(TMC)(NCMe)]2+ (where TMC = 1,4,8,11-tetramethyl-1,4,8,11-tetraazacyclotetradecane) shown in Figure 1A. These structures have unequivocally established the metrical parameters of the oxoiron(IV) center, the hallmark of which is a short Fe=O distance of ~1.64 – 1.65 Å. Additionally, the spectroscopic properties of these complexes have been characterized in detail, revealing a number of signatures of the S = 1 oxoiron(IV) unit, including i) near-infrared (NIR) absorption bands with low intensities (ε ≤ 400 M−1cm−1), ii) Fe K-edge pre-edge transitions with large areas (~20 – 30 units relative to the edge jump), and iii) low Mössbauer isomer shift values (δ = −0.04 – 0.19 mm/s).16
Figure 1.

Representations of the molecular structures of [FeIV(O)(TMC)(NCMe)]2+ (A) and [FeIV(O)(TPA)(NCMe)]2+ (B) based on X-ray crystallographic data18 and density functional theory computations,25 respectively.
One of the advantages of studying synthetic oxoiron(IV) complexes is that, in principle, the coordination sphere around the Fe=O unit can be systematically modulated to determine how the local coordination geometry governs electronic structure and reactivity. This can be most easily done for the oxoiron(IV) complexes supported by the TMC and tris(pyridylmethyl)amine (TPA) ligands, as these tetradentate ligands provide labile coordination sites trans and cis, respectively, to the oxo group (Figure 1). A systematic study of a series of [FeIV(O)(TPA)(X)]2+/+ complexes (where X = MeCN, CF3CO2−, Cl−, and Br−) revealed that cis substitutions have only a minor effect on i) the Fe=O bond length, which in all cases was determined by EXAFS analyses to be ~1.65 Å, ii) the quadrupole splitting (ΔEQ = 0.93 ± 0.02 mm/s for all complexes), and iii) the X-ray absorption pre-edge area (25±2 units).25 Thus, other than causing a shift in the NIR absorption band,25 it would appear that cis substitutions do not markedly affect the signature features of the S = 1 Fe=O unit.
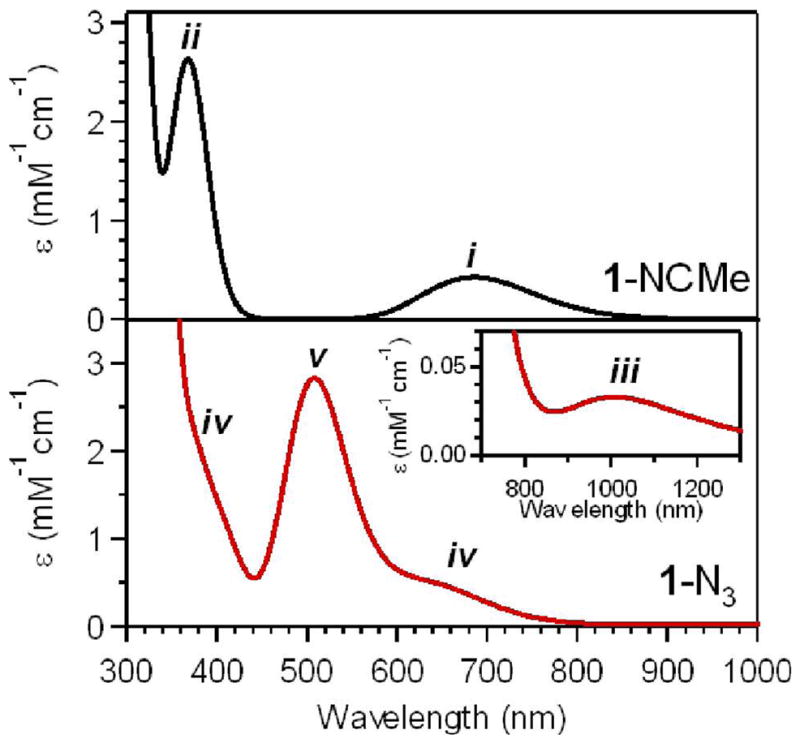
In contrast, [FeIV(O)(TMC)(X)]2+/+ (1-X, where X = MeCN, CF3CO2−, N3−, and NCS−)18,26–28 and the closely related complex [FeIV(O)(TMCS)]+ (1′-SR),29 which has a tethered thiolate ligand that can bind trans to the oxo group, exhibit a remarkable range of properties. For instance, whereas the parent complex 1-NCMe displays only modest absorption features in the near-infrared (NIR) spectral region, the 1-N3 and 1-NCS complexes show intense charge-transfer features at ~400 nm.28 These chromophores permitted the use of resonance Raman spectroscopy to determine the frequency of the Fe=O stretching mode of these complexes.28 In terms of structural variation, EXAFS data revealed that the presence of a trans thiolate group gives rise to a longer Fe=O distance of 1.70 Å, an elongation of 0.05 Å compared to 1-NCMe.30 A recent study has also shown that the reactivity pattern of the oxoiron(IV) unit is highly dependent on the trans ligand.27 For example, 1-NCMe is a more reactive oxygen-atom transfer agent to triphenylphosphine than 1′-SR by roughly 300-fold, whereas 1′-SR is a more potent H-atom abstraction agent over 1-NCMe by a factor of ~50, when dihydroanthracene is used as substrate.27 Thus, the chemical nature of the trans ligand governs whether the oxoiron(IV) unit is a more effective two-electron (oxygen-atom transfer) or one-electron (H-atom abstraction) oxidant.
In this paper we describe the spectroscopic and structural properties of seven oxoiron(IV) complexes that differ only with respect to the ligand trans to the oxo group. By using electronic absorption, X-ray absorption, Mössbauer, and resonance Raman spectroscopies we have more thoroughly characterized 1-NCMe, 1-O2CCF3, 1-N3, and 1-NCS, as well as three new oxoiron(IV) complexes: [FeIV(O)(TMC)(NCO)]+, [FeIV(O)(TMC)(CN)]+, and [FeIV(O)(TMC)(OH)]+. These data show that the nature of the trans ligand profoundly affects i) NIR absorption features, ii) XAS pre-edge areas, iii) Fe=O stretching frequencies and iv) Mössbauer properties, unlike what was observed for the cis substituted series, [FeIV(O)(TPA)(X)]2+/+.25 These spectroscopic studies are complemented by density functional theory (DFT) computations that allow spectroscopic changes to be correlated with differences in electronic structure. Our combined experimental and theoretical investigation reveals how the donor properties of the trans ligand modulate spectroscopic properties of the oxoiron(IV) unit and offers insights into differences in reactivity among these complexes.
2. Experimental Section
2.1 Materials and General Procedures
All reagents and solvents were purchased from commercial sources and used as received, unless otherwise noted. Solvents were dried according to published procedures31 and distilled under argon prior to use. [FeII(TMC)(OTf)](OTf) and [57FeII(TMC)(OTf)](OTf) were synthesized in a nitrogen atmosphere glovebox, as previously described.18 Iodosobenzene (PhIO) was generated according to published procedures.32
Ligand substitution reactions were carried out by addition of the appropriate salt to 2–16 mM solutions of [FeIV(O)(TMC)(NCMe)]2+ (1-NCMe) in MeCN. Typically 2 mL of a MeCN solution of the iron(II) precursor [FeII(TMC)(OTf)](OTf) was transferred to a cuvet that was then placed in a cryostat maintained at a desired temperature. One equivalent of PhIO (solubilized in MeOH) was subsequently added, resulting in the quantitative formation of 1-NCMe. Upon full formation of 1-NCMe, the appropriate NR4X salt (where R = Et or Bu and X is the added anion) was added. In all cases, addition of 1–2 equivalents of NR4X yielded the corresponding [FeIV(O)(TMC)(X)]+ (1-X) species in high yields (≥80%), as judged by Mössbauer data collected with 57Fe-enriched samples (vide infra). Extinction coefficients were determined on the basis of the percent composition of 1-X determined by Mössbauer spectroscopy. Samples used for tandem Mössbauer and XAS experiments were prepared by transferring an aliquot of solution (~500 μL) containing 1-X to a pre-cooled cup designed specifically for Mössbauer/XAS experiments. Iron concentrations in these samples were typically 10 – 16 mM in Fe; in order to carry out the Mössbauer analysis, the Fe was enriched with 57Fe to achieve a final 57Fe concentration of ca. 2 mM in the samples.
2.2 Physical Methods
A. Electronic Absorption, Resonance Raman, and Mössbauer Spectroscopies
Electronic absorption spectra were collected on an HP 8453A diode-array spectrometer. Samples were maintained at a constant temperature using a Unisoku Scientific Instruments (Osaka, Japan) cryostat. Electrospray ionization mass spectra (ESI-MS) were collected on a Thermo Finnigan (San Jose, CA) LCQ™ Advantage MAX quadrupole ion trap instrument, by infusing samples directly into the source at 20 μL/min using a syringe pump. The spray voltage was set at 4 kV and the capillary temperature at 70 °C. Resonance Raman spectra were obtained using a liquid nitrogen cooled CCD detector (model LN/CCD-1340 × 400PB, Princeton Instruments) attached to a 1-m single polychrometer (model MC-100DG, Ritsu Oyo Kogaku). Excitation wavelengths were provided by Kr+ and Ar+ lasers (Spectra Physics BeamLok 2060-RM) with ~4 mW power at the samples. All measurements were carried out with a spinning cell (1000 rpm) at ~ −20 °C. Raman shifts were calibrated with indene, and the accuracy of the peak positions of the Raman bands was ±1 cm−1. Mössbauer spectra were recorded with two spectrometers, using Janis Research (Wilmington, MA) SuperVaritemp dewars. Isomer shifts are quoted relative to Fe metal at 298 K. All Mössbauer samples contained varying amounts of iron(II) and iron(III) contaminants (vide infra), but these contaminants did not significantly hamper the data analysis, as their spectral features could be evaluated (see Figure S1) or were at Doppler velocities outside the spectral range of interest.
B. X-ray Absorption Spectroscopy
Data Collection
X-ray absorption spectroscopic (XAS) data were collected at beamline 9-3 at the Stanford Synchrotron Radiation Laboratory (SSRL) of the Stanford Linear Accelerator Center and beamline X9B at the National Synchrotron Light Source (NSLS) of Brookhaven National Laboratory. Fe K-edge XAS data were collected for frozen solutions maintained at ~10 K over the energy range 6.9 – 8.0 keV, as previously described.33–35 An iron foil spectrum was measured simultaneously for internal energy calibration using the first inflection point of the K-edge energy (7112.0 eV). Data were obtained as fluorescence excitation spectra using a solid-state germanium detector (Canberra).
Data Analysis
Data reduction, averaging, and normalization were performed using the program EXAFSPAK.36 Background corrections were also performed using EXAFSPAK, as previously described.37 The intensity and energy of pre-edge features for the 1-X complexes were determined according to a pre-edge fitting protocol using the program SSEXAFS,33,38 that we have previously used for high-valent species.25,35,37,39 The edge was modeled as an integral of a 75% Gaussian and 25% Lorentzian peak; the pre-edge peak was modeled as a Gaussian function whose height, position, and width (at half height) were refined. Pre-edge peak areas are reported in % of the Fe K-edge jump. EXAFS refinement was carried out on k3χ(k) data (see Figure S2 for raw data), using phase and amplitude functions obtained from FEFF version 6. EXAFS data fittings were performed by initial refinement using the back-transformation ranges indicated in Tables S1 and S2. For each fit, the parameters, r and σ2 were optimized, while n was kept fixed. n was systematically varied in integer steps. Unfiltered data were subsequently fit. The goodness of fit was assessed by F, where F = Σ (χcalc −χexp)2/N, and N is the number of data points. The threshold energy, E0, in eV (k = 0 point) was maintained at a common, variable value for all shells of a given fit. More technical details of our fitting procedures are described in Supporting Information.
2.3 Computations
A. DFT Geometry Optimizations
The structure of [FeIV(O)(TMC)(NCMe)]2+ determined by X-ray crystallography18 was used as starting point for all DFT energy minimizations. Models of [FeIV(O)(TMC)(X)]+ were derived by replacing the NCMe ligand with the appropriate X ligand (where X = OH−, N3−, NCS−, NCO−, CN−, and CF3CO2−) and then energy minimized using the Amsterdam Density Functional (ADF) 2004.01 software package.40–42 A model of [FeIV(O)(TMCS)]+ was likewise generated using the previously optimized geometry30 as a starting point for DFT energy minimization. These computations were carried out on a cluster consisting of Intel Xeon processors (Ace Computers) using uncontracted triple-ζ Slater-type orbitals including a single set of polarization functions as a basis set (ADF basis set IV), an integration constant of 4.0, and the local density approximation of Vosko, Wilk, and Nusair43 with the nonlocal gradient corrections of Becke44 and Perdew.45 Core orbitals were frozen through 1s (O, N, C) and 2p (Fe and S). Calculations were converged to the S = 1 spin state. The coordinates of all DFT energy minimized models presented in this study are included as Supporting Information (Tables S4 – S11).
B. Calculation of Excited State Properties
Electronic transition energies were computed using both the ADF 2004.01 and ORCA 2.5 software packages, the latter of which was developed by Dr. Frank Neese (University of Bonn, Germany).46 Using the ADF program, electronic transition energies were computed by the so-called ΔSCF method2,47–49 where an electron is excited from the donor to the acceptor MO and the change in total energy at convergence is taken as the electronic transition energy. Excited state geometry optimizations were performed using the excited state density as a starting point for energy minimization of the nuclear coordinates. Molecular orbital (MO) compositions were inspected before and after these computations to determine if the ΔSCF procedure had maintained the electronic structure of the excited state and not reverted back to the ground state. In all cases, the excited state MO compositions were virtually identical (changes in contribution of ~2% were observed) before and after energy minimization of the nuclear coordinates.
The ORCA program was used to compute electronic excitation energies and intensities for 1-NCMe, 1-N3, 1-NCS, and 1-NCO using the TD-DFT50–52 method within the Tamm-Dancoff approximation.53,54 To determine which functional yields computed absorption spectra in closest agreement with our experimental data, we computed absorption spectra for 1-NCMe using the BP86,44,45 B3LYP,55–57 and PBE058 functionals. For these computations, the SV(P) (Ahlrichs polarized split valence) basis59 was used for all H atoms and the C atoms of the TMC macrocycle, whereas the TZVP (Ahlrichs polarized triple-ζ valence) basis59 was used for Fe, O, N, and S, as well as the C atoms of the axial ligands. The size of the integration grid used for all calculations was 3 (Lebedev 194 points). In each case, 40 excited states were calculated by including all one-electron excitations within an energy window of ± 3 hartrees with respect to the HOMO/LUMO energies. Isosurface plots of MOs were generated with the gOpenMol program developed by Laaksonen60,61 using the isodensity values of 0.05 b−3, respectively.
3. Results and Discussion
3.1 Ligand Substitution Reactions of [FeIV(O)(TMC)(NCMe)]2+
The oxoiron(IV) complex [FeIV(O)(TMC)(NCMe)]2+ (1-NCMe) can be generated quantitatively by the addition of an equivalent of iodosobenzene to a solution of [FeII(TMC)(OTf)]+ in MeCN, as previously reported.18 This complex exhibits a characteristic electronic absorption feature at 824 nm (ε = 400 M−1cm−1; Figure 2B) that arises from ligand-field (LF) transitions of the S = 1 FeIV=O unit (see Figure 2A for the d orbital splitting pattern).62,63 The addition of a variety of tetralkylammonium salts (NR4X; where X = OH− and the pseudohalides N3−, NCS−, NCO−, and CN−) to 1-NCMe (eq. 1) causes a loss of near-infrared (NIR)
Figure 2.

Near-IR regions of the electronic absorption spectra of [FeIV(O)(TMC)(X)]2+/+ complexes in MeCN at −40 °C. A) General FeIV 3d orbital splitting diagram for nonheme oxoiron(IV) complexes, with the three near-IR d-d transitions identified through MCD studies (ref. 62) indicated with dashed arrows. B) Near-IR spectrum of 4 mM [FeIV(O)(TMC)(NCMe)]2+ (1-NCMe) and spectral changes following the addition of 10 equivalents of NBu4NCO. C) Spectra of 4 mM [FeIV(O)(TMC)(CN)]+ (1-CN), [FeIV(O)(TMC)(NCS)]+ (1-NCS), [FeIV(O)(TMC)(NCO)]+ (1-NCO), and [FeIV(O)(TMC)(N3)]+ (1-N3). D) Spectra of 2 mM [FeIV(O)(TMC)(O2CCF3)]+ (1-O2CCF3) and 8 mM [FeIV(O)(TMC)(OH)]+ (1-OH).
| (1) |
intensity and a shift of the NIR λmax (Figure 2 and Table 1). In all cases isosbestic behavior is observed (see Figure 2B for X = NCO−), indicating a one-step transition from 1-NCMe to a second species we designate as 1-X, where X is the added anion. These spectral changes are reminiscent of those observed when NBu4O2CCF3 was added to 1-NCMe.26 In that case, 19F-NMR data supported the conclusion that the CF3CO2− anion displaced the MeCN ligand to generate [FeIV(O)(TMC)(O2CCF3)]+ (1-O2CCF3). Electrospray ionization – mass spectrometric (ESI-MS) data obtained for solutions of 1-X (Figure S4) likewise allow us to formulate these species as [FeIV(O)(TMC)(X)]+ (X = OH−, N3−, NCS−, NCO−, and CN−), where the X anion has replaced the MeCN ligand. We previously showed that the complexes 1-N3 and 1-NCS could be generated via the addition of iodosobenzene to MeCN solutions of [FeII(TMC)(N3)]+ and [FeII(TMC)(NCS)]+,28 so these current findings demonstrate that there are two general routes to these oxoiron(IV) complexes, identical to that observed for 1-O2CCF3.26
Table 1.
Physical Properties of [FeIV(O)(TMC)(X)]2+/+ (1-X) Complexes.a
| λmax (nm) (ε (M−1cm−1)) | t1/2 at 25 °Cb | νFeO (cm−1) | δ (mm/s) | ΔEQ(mm/s) | η | D (cm−1)c | Ax/gnβn (T)d | Ay/gnβn (T)d | Az/gnβn (T)d | |
|---|---|---|---|---|---|---|---|---|---|---|
| 1-NCMe | 282 (10 000) | 10 he | 839 (804) | 0.17f | 1.23f | 0.5f | 29f | −23f | −18f | −3f |
| 824 (400) | ||||||||||
| 1-O2CCF3 | 836 (250) | 1 he | 854 (817) | 0.20 | 1.39 | 0 | 31 | −24 | −22 | −3 |
| 1-NCO | 350 (3100) | 30 min | 822 (792) | 0.16 | 0.42 | 0.1 | 31 | −23 | −23 | −5 |
| 845 (150) | ||||||||||
| 1010 (130) | ||||||||||
| 1-NCS | 387 (3500) | 30 min | 820 (786) | 0.18 | 0.55 | 0.2 | 30 | −24 | −20 | −4 |
| 850 (200) | ||||||||||
| 1010 (170) | ||||||||||
| 1-N3 | 407 (3600) | 15 min | 814 (780) | 0.17 | 0.70 | 0.1 | 29 | −24 | −20 | −5 |
| 850 (130) | ||||||||||
| 1050 (110) | ||||||||||
| 1′-SR | 460 (1300) | 5 min | NDg | 0.19h | −0.22h | 0h | 35h | −23h | −22h | −5h |
| 570 (1100) | ||||||||||
| 860 (230) | ||||||||||
| 1-CN | 858 (250) | 1.5 h | 823 (789) | 0.15 | 0.25 | 0.9 | 31 | −21 | −20 | −5 |
| 1-OH | 830 (100) | ~seconds | NDg | 0.15 | 0.16 | −3.0 | 31 | −22 | −22 | −2 |
| 1060 (110) |
Estimated uncertainties for Mössbauer parameters are as follows: δ: ±0.01 mm/s, ΔEQ: ±0.05 mm/s, D: 2 cm−1, Ai/gnβn: 2.5 T.
Half-lives were determined by monitoring the decay of 4 mM [FeIV(O)(TMC)(X)]+ using UV-visible spectroscopy at 25 °C.
The Mössbauer spectra of the 1-X complexes are sensitive to the internal magnetic field at the 57Fe nucleus, Bint = −〈S〉th·A/gnβn, where 〈S〉th is the thermal expectation value of the electronic spin. The value of 〈S〉th depends on D, E, B, and the temperature. In our simulations, we found no need to use E/D ≠ 0. Simulations with E/D > 0 would require larger Ax and smaller Ay values, keeping the magnetic hyperfine field axial around z.
The D-values of all 1-X complexes are very large and consequently the components of the magnetic hyperfine field are essentially proportional to giAi (i = x, y, z). Thus, any increase of the gi-values above the assumed values of gi = 2.0 would yield a decrease in the component Ai.
Ref. 26.
Ref. 18.
Not determined. Despite several attempts, to date, we have not observed νFeO for 1′-SR and 1-OH.
Ref. 30.
The parent oxoiron(IV) complex 1-NCMe is remarkably stable, with a half-life of 10 hours at room temperature.26 The substitution of MeCN with an anion in the reactions reported here all greatly diminish the thermal stability of the oxoiron(IV) center (Table 1). The series of 1-X complexes themselves exhibit a range of thermal stabilities; at room temperature the lifetimes can be placed in decreasing order as follows: 1-CN > 1-O2CCF3 > 1-NCS ≈ 1-NCO > 1-N3 > 1-OH. Thus, for the TMC system, negatively charged ligands do not stabilize the high-valent FeIV oxidation state and, in fact, appear to promote its decay. This is an emerging theme for nonheme oxoiron(IV) complexes, as the thermal decay of the related [FeIV(O)(TPA)(NCMe)]2+ complex (Figure 1B) is also hastened by replacing the MeCN ligand with the anions CF3CO2−, Cl−, and Br−.25 The MeCN ligand would therefore appear to stabilize the FeIV=O unit.
3.2 Spectroscopic Data
A. Near-infrared Absorption Data
Relative to 1-NCMe, the NIR λmax values of the 1-X complexes red-shift from 824 nm to ~830 – 850 nm and exhibit a more than two-fold loss of absorption intensity (Figure 2 and Table 1). On the basis of detailed magnetic circular dichroism (MCD) studies of 1-NCMe and 1-O2CCF3,62,63 these spectral perturbations are attributed to π-interactions between the FeIV dxz/yz and X px/y orbitals, which modulate the energies and intensities of the dxy → dxz/yz, and dxz/yz → dx2−y2 transitions (Figure 2A). Because the FeIV dxz/yz orbitals are Fe=O π-antibonding,63,64 these NIR spectral changes thus mark perturbations in Fe=O π-interactions caused by the trans ligand.
It is notable that several of the 1-X complexes (i.e., those with X = NCS−, NCO−, and CN−) exhibit sharper features on top of their broader absorption envelopes. For example, 1-NCS displays λmax values at 850, 892, 953, and 1010 nm. In principle, these sharp features could be due to spin-forbidden FeIV d → d transitions that are expected to be much sharper than their spin-allowed counterparts. However, given that the low-temperature MCD spectra of 1-NCMe and 1-O2CCF3 displayed fine structure that was assigned as vibronic in origin,62,63 we likewise attribute the fine structure observed in the absorption spectra of certain 1-X complexes to a vibronic progression that is better resolved for these complexes. In fact, because MCD studies have shown that the dxy → dxz/yz transitions of 1-NCMe exhibit well resolved vibronic structures, this band must gain significant absorption intensity in some of the 1-X complexes, further reflecting electronic perturbations due to the trans ligand.
B. Visible and Near-UV Absorption Data
In addition to the NIR spectral changes, the 1-N3, 1-NCS, and 1-NCO complexes also exhibit clear absorption bands in the visible/near-UV spectral region (Figure 3 and Table 1), the intensities of which (ε ≈ 3000 M−1cm−1) are consistent with charge-transfer (CT) transitions. This is in contrast to the corresponding spectrum collected for 1-NCMe that only shows the onset of absorption intensity at ~350 nm (Figure 3) and an absorption maximum at 282 nm.28 The 1-N3, 1-NCS, and 1-NCO complexes likewise show additional intense features further into the UV region, though the onset of these features is blue-shifted relative to 1-NCMe for 1-NCS and 1-NCO (Figure 3). The visible absorption bands of 1-N3 and 1-NCS were previously reported and tentatively assigned as O2− → FeIV CT transitions, because resonance Raman experiments using a 407 nm excitation wavelength permitted the observation of the Fe=O stretching vibration (νFeO), whereas no pseudohalide-related vibrations were observed.28 Because 1-NCMe does not display significant absorption intensity at wavelengths greater than ~350 nm, this assignment requires that the binding of the N3− and NCS− ligands causes a red-shift in the energy of the O2− → FeIV CT transitions. This in turn suggests a large modulation of the Fe=O bonding interactions in these complexes. To date, the only other examples of oxoiron(IV) complexes that exhibit relatively low energy charge-transfer transitions are 1-NCO (Figure 3) and 1′-SR.30 The absorption spectrum for 1′-SR displays two prominent absorption features in the visible region at 460 and 570 nm (Table 1).30 This complex also displays a longer Fe=O bond length of 1.70 Å, demonstrating the large effect of the thiolate ligand on the geometric properties of the Fe=O unit. Consequently, the geometric structures, particularly the Fe=O distances of the 1-X complexes, are of significant interest. But efforts to crystallize the other 1-X complexes have thus far been unsuccessful, so we turned to X-ray absorption spectroscopy to obtain metric parameters for these relatively unstable complexes.
Figure 3.
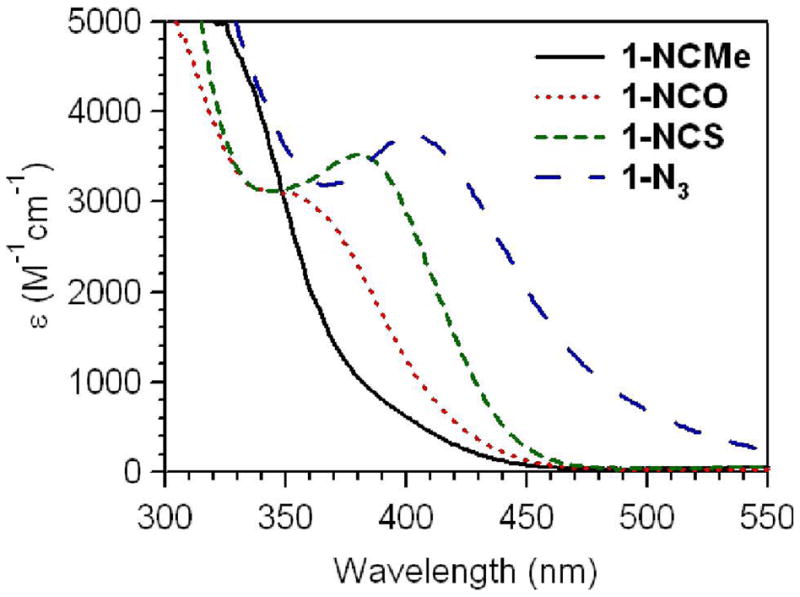
Expanded view of the visible/near-UV region of the electronic absorption spectra of [FeIV(O)(TMC)(NCMe)]2+ (1-NCMe), [FeIV(O)(TMC)(NCO)]+ (1-NCO), [FeIV(O)(TMC)(NCS)]+ (1-NCS), and [FeIV(O)(TMC)(N3)]+ (1-N3) obtained at −40 °C in MeCN.
C. X-ray Absorption Data. X-ray Absorption Near-Edge Structures
X-ray absorption spectroscopic (XAS) data at the Fe K-edge were measured for 1-NCMe and several 1-X complexes (X = CF3CO2−, N3−, NCS−, NCO−, CN−, and OH−). The X -ray absorption near edge structures (XANES) of the 1-X complexes are shown in Figures 4 and S4 and summarized in Table 2. The Fe K-edge energies of all complexes are at ~7125 eV, consistent with values previously reported for oxoiron(IV) species25,30,35 and similar to that recently reported for a nonheme oxoiron(V) complex of a tetraamido macrocyclic ligand (7125.3 eV).65 The range of edge energies observed for this present series of complexes could be due to different degrees of electron donation to the FeIV center by the different X ligands. Alternatively, differing amounts of unreacted FeII starting material and FeIII/FeII decay products present in the samples, as detected by Mössbauer experiments, could also lead to slight downshifts in the edge energies. These contaminants are also listed in Table 2.
Figure 4.
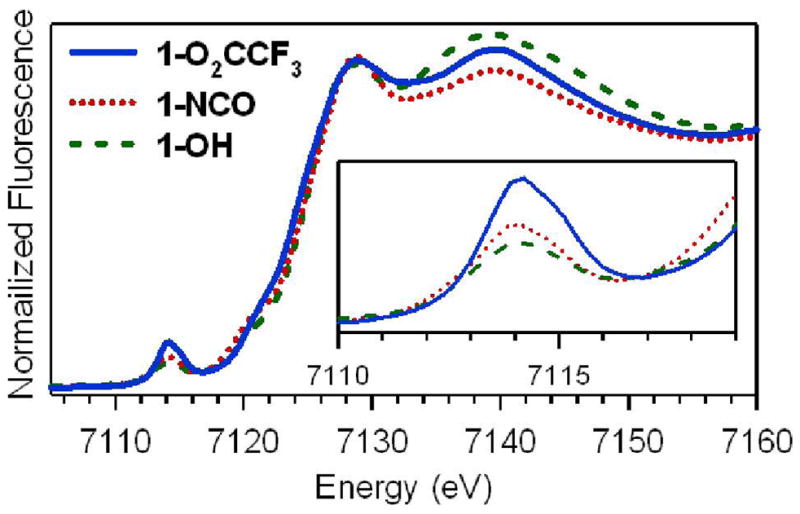
Fe K-edge X-ray absorption near-edge structures of [FeIV(O)(TMC)(O2CCF3)]+ (1-O2CCF3), [FeIV(O)(TMC)(NCO)]+ (1-NCO), and [FeIV(O)(TMC)(OH)]+ (1-OH) obtained at 10 K.
Table 2.
Fe K-edge XAS Near-edge Properties of [FeIV(O)(TMC)(X)]2+/+ (1-X) Complexes.
| Eo (eV) | Epre-edge (eV) | area | weighted areaa | %FeIVb | Contaminantsc | |
|---|---|---|---|---|---|---|
| 1-NCMe | 7124.5 | 7114.1 | 26.2 | 32.8 | 80 | 20% FeII |
| 1-O2CCF3 | 7124.0 | 7114.2 | 30.9 | 38.6 | 80 | 20% FeIII |
| 1-NCO | 7125.3 | 7114.7 | 25.9 | 30.5 | 85 | 11% FeII |
| 1-NCS | 7125.4 | 7114.3 | 23.9 | 29.1 | 82 | 18% FeIII |
| 1-N3 | 7125.3 | 7114.4 | 24.3 | 29.6 | 82 | 18% FeIII |
| 1′-SRd | 7125.1 | 7114.3 | 18.0 | 20.0 | 90 | 8% FeII |
| 1-CN | 7124.8 | 7114.1 | 21.0 | 26.2 | 80 | 10% FeII + 12% FeIII |
| 1-OH | 7125.4 | 7115.1 | 19.5 | 21.7 | 90 | 10% FeII |
Area weighted by percentage FeIV in the samples. The presence of contaminant s introduces a maximum error in pre-edge areas of ±2 units.
Percentage FeIV determined by Mössbauer or absorption (italics) spectroscopy.
All contaminants are high-spin FeII or FeIII as determined by Mössbauer spectroscopy.
From ref. 30.
All complexes exhibit one prominent pre-edge transition at ~7114.5 ± 0.6 eV, the area of which is strongly dependent on the identity of the X ligand (Figure 4 and Table 2). In this study, 1-O2CCF3 and 1-OH represent the extremes, having pre-edge areas of ~39 and ~22 units, respectively (Table 2). These pre-edge features arise from parity-forbidden Fe 1s → 3d transitions that gain intensity through Fe 4p and 3d mixing allowed by low symmetry distortions.66 Oxoiron(IV) complexes have severe axial distortions due to their short Fe=O bond lengths of ~1.65 Å18,21,25,30,35 and thus generally exhibit large pre-edge areas of ~25 units.25,35 We note that the basicity of the trans ligand, likely marking its donor strength, appears to correlate with the pre-edge area, as complexes with more basic trans ligands (i.e., OH− and RS−) have the lowest pre-edge areas (~20 – 22), while the 1-O2CCF3 complex with the least basic CF3CO2− ligand exhibits the highest pre-edge area of ~39 units (Table 2). The latter value is comparable to those observed for oxoiron(IV) porphyrin and TAML (TAML = tetraamido macrocyclic ligand) complexes (~35 – 41 units).67,68
X-ray Absorption Fine Structure (EXAFS) Data and Fitting Results for 1-NCMe
The Fourier transform (R′ space) of the Fe K-edge EXAFS data of 1-NCMe in frozen MeCN solution exhibits several prominent peaks that can be best accounted for by three shells at 1.64 (1 O scatterer), 2.08 (5 N scatterers), and 2.97 Å (4 C scatterers), as shown in Figure 5A and Table 3. The distances of the inner shells of O and N scatterers are in good agreement with the Fe–O and average Fe–N distances of 1.646 and 2.084 Å observed in the X-ray structure of 1-NCMe.18 The X-ray structure also reveals 10 C atoms ~2.8 – 3.1 Å from the Fe center, which likely contribute to the R′ space peaks at 2.4 and 2.7 Å. The relatively large discrepancy in number of C scatterers required to fit these peaks (4 C scatterers) is attributed to the distribution of Fe–C distances, leading to some destructive interference among the various contributions. Overall, the EXAFS fitting results are in excellent agreement with the crystallographic data, especially in terms of the iron–ligand distances. Thus, the EXAFS technique is well suited to determine if there is any large structural variation within the 1-X series of complexes that could account for differences in spectroscopic properties and/or thermal stabilities.
Figure 5.

Fourier transforms of Fe K-edge EXAFS data [k3χ(k)] and Fourier-filtered EXAFS spectra (insets), experimental data (––) and fits (···) for A) [FeIV(O)(TMC)(NCMe)]2+ (1-NCMe), B) [FeIV(O)(TMC)(NCO)]+ (1-NCO), C) FeIV(O)(TMC)(NCS)]+ (1-NCS), and D) [FeIV(O)(TMC)(OH)]+ (1-OH). Details regarding the EXAFS fits are given in Tables 3, S1, and S2.
Table 3.
EXAFS fitting results for [FeIV(O)(TMC)(X)] 2+/+ (1-X) complexes.
| Fe–Oa |
Fe–Na |
Fe···C
|
Fe–X
|
|||||||||
|---|---|---|---|---|---|---|---|---|---|---|---|---|
| n | r(Å) | σ2 × 10³ (Å2) | n | r(Å) | σ2 × 10³ (Å2) | n | r(Å) | σ2 × 10³ (Å2) | n | r(Å) | σ2 × 10³ (Å2) | |
| 1-NCMe | 1 | 1.64 | 3.8 | 5 | 2.08 | 5.7 | 4 | 2.97 | 6.5 | |||
| 1-O2CCF3 | 1 | 1.64 | 1.7 | 4 | 2.08 | 2.1 | 4 | 2.94 | 5.0 | |||
| 1-NCO | 1 | 1.67 | 1.7 | 5 | 2.07 | 7.1 | 5 | 2.94 | 8.1 | |||
| 1-NCS | 1 | 1.65 | 2.6 | 5 | 2.07 | 4.3 | 4 | 2.95 | 4.2 | 4b | 4.78c | 5.4 |
| 1-N3 | 1 | 1.66 | 2.0 | 5 | 2.08 | 6.4 | 6 | 2.99 | 11.6 | |||
| 1′-SRe | 1 | 1.70 | 1.0 | 3 | 2.09 | 2.0 | 4 | 2.95 | 6.3 | 1 | 2.33c | 0.6 |
| 1-CN | 1 | 1.66 | 1.3 | 4 | 2.08 | 3.1 | 4 | 2.95 | 4.4 | |||
| 1-OH | 1 | 1.68 | 1.2 | 4 | 2.10 | 2.6 | 6 | 3.03 | 5.9 | 1 | 1.94d | 2.0 |
Typical uncertainties in Fe-O and Fe-N distances determined by EXAFS analysis are ± 0.02 Å.
The fit includes the four most prominent multiple scattering pathways, each of which involves two of the three atoms of the NCS− ligand.
X = S.
X = O.
From ref. 30.
EXAFS Data and Fitting Results for 1-X Complexes
The R′ space spectra for the 1-X complexes are quite similar to that of 1-NCMe (Figures 5 and S6). There is a moderate degree of variation in the peak centered at ~1.6 Å that arises from the first-coordination sphere, whereas the peaks from ~2 – 3 Å are nearly invariant of ligand substitution. Consequently, similar iron-scatterer distances were obtained from fitting these data sets, as summarized in Table 3. Two special cases are 1-OH and 1-NCS.
For 1-OH, the FT peak from the inner-shell is quite distinct from that of 1-NCMe (cf. Figure 5, A and D). Accordingly, the EXAFS data for 1-OH are best fit with a longer Fe–O distance of 1.68 Å and an additional Fe–O shell at 1.94 Å, the latter of which we attribute to the O atom of the hydroxo ligand. This distance is significantly longer than the FeIV–OH distances observed for Compound II of chloroperoxidase69 and [FeIV(BPMCN)(OH)(OOtBu)]2+ (where BPMCN is N,N′-bis(2-pyridylmethyl)-N,N′-dimethyl-trans-1,2-diaminocyclohexane),70 which are both 1.82 Å. It is also slightly longer than the FeIV–OH distance of 1.86 Å computed for a model of the oxoiron(IV) intermediate of the His99Ala variant of TauD, where the H99A substitution opens up a coordination site for OH− that is cis to the oxo ligand.71 On the basis of these observations, we attribute the longer FeIV–OH distance of 1-OH to the distinct influences of the trans oxo ligand that modulates the binding affinity of the iron(IV) center for the hydroxide ligand. This is consistent with computations by Berry et al. that predicted an elongation of an Fe–O(acetate) distance by 0.15 Å upon going from a trans fluoro to an oxo ligand.72
For 1-NCS, the R′ space spectrum from ~1 – 2.8 Å appears virtually the same as that of 1-NCMe, indicating that the NCS− ligand is not S-bound, as that would lead to relatively large spectral changes in this region. In contrast, the FT spectrum of 1-NCS displays a peak at R′ = 4.2 Å that is almost as intense as the peak attributed to the C shell at ~2.5 Å (Figure 5C). An intense peak at such a relatively long distance from the Fe center is anticipated only for a heavy-atom scatterer, the S atom of the NCS ligand being the obvious candidate. In support, the inclusion of four prominent multiple-scattering paths associated with a linear Fe–NCS unit led to quite reasonable fits (Table 3). Thus, these EXAFS data provide strong evidence that the NCS ligand coordinates through the N atom in a linear fashion, in agreement with the linear, N-bound NCS ion observed in the crystal structure of [FeII(TMC)(NCS)]+.28
Intriguingly, the FT EXAFS data for 1-NCMe and 1-NCO also display peaks at ~4.2 Å, albeit ones less intense than that observed for 1-NCS (cf. Figure 5, A, B, and C). We suggest that these peaks also have their origin in multiple-scattering effects that are amplified due to linear binding of the NCO− and NCMe ligands. In contrast, the absence of such a peak for 1-N3 (Figure S6) implies that the N3− anion binds to the FeIV center with a bent orientation (i.e., the O–Fe–N(N2) angle is <180°), consistent with a bent FeIII–N3 unit observed in the crystal structure of the related complex [FeIII(N3)(Me3cylam–acetate)]+ (where Me3cyclam-acetate is 4,8,11-trimethyl-1,4,8,11-tetraazacyclotetradecane-1-acetate).73
Overall, our EXAFS analysis reveals that, except for 1′-SR and 1-OH, all Fe–O distances are 1.65 ± 0.02 Å, which is the standard error associated with absorber-scatterer distances obtained by this method.74 Thus, despite the differences in spectroscopic properties (Figures 3 and 4), thermal stabilities (Table 1), and reactivities,27 the majority of the 1-X complexes have very similar Fe–O distances. We next turned to a spectroscopic technique that can, in principle, be an exquisitely sensitive reporter of bond length, resonance Raman spectroscopy.
D. Resonance Raman Data
Resonance Raman (RR) spectra were collected for 1-NCMe and members of the 1-X series of complexes using an excitation wavelength of 407 nm and a spinning sample maintained at a temperature between −20 and −40 °C. The RR spectrum obtained for 1-NCMe displays a vibration at 839 cm−1 that shifts to 804 cm−1 upon the introduction of 18O (Figure 6). This downshift is close to the calculated value for a diatomic Fe–O vibration (−34 cm−1), and allows us to assign the 839 cm−1 feature to the Fe=O stretching vibration, νFeO. The corresponding vibration in the solid state was previously observed at 834 cm−1 using IR spectroscopy.18 RR spectra collected for members of the 1-X family revealed features in the range of 814 – 854 cm−1 (Table 1) that shifted to lower energy by ~33 – 37 cm−1 when either PhI18O was used to prepare the samples or the samples were incubated with H218O. The νFeO energies for the 1-X complexes decrease in the order CF3CO2− ≫ MeCN > CN− ≈ NCO− ≈ NCS− > N3−, with lower νFeO values observed for complexes with stronger trans donor ligands. Unfortunately, attempts to obtain the νFeO of complexes with even more basic ligands like axial-thiolate-ligated [FeIV(O)(TMCS)]+ and 1-OH were stymied by problems with fluorescence and photoreduction, so the frequencies observed span only a relative small range of 40 cm−1. With the use of a Badger’s rule correlation described by Green75 for nonheme iron centers (see Supporting Information), bond length changes of only 0.02 Å are predicted when the extreme νFeO frequencies from 1-O2CCF3 and 1-N3 are considered, consistent with our EXAFS analysis. Nonetheless, to date, this effort represents the only collection of νFeO frequencies for a series of nonheme oxoiron(IV) complexes.
Figure 6.
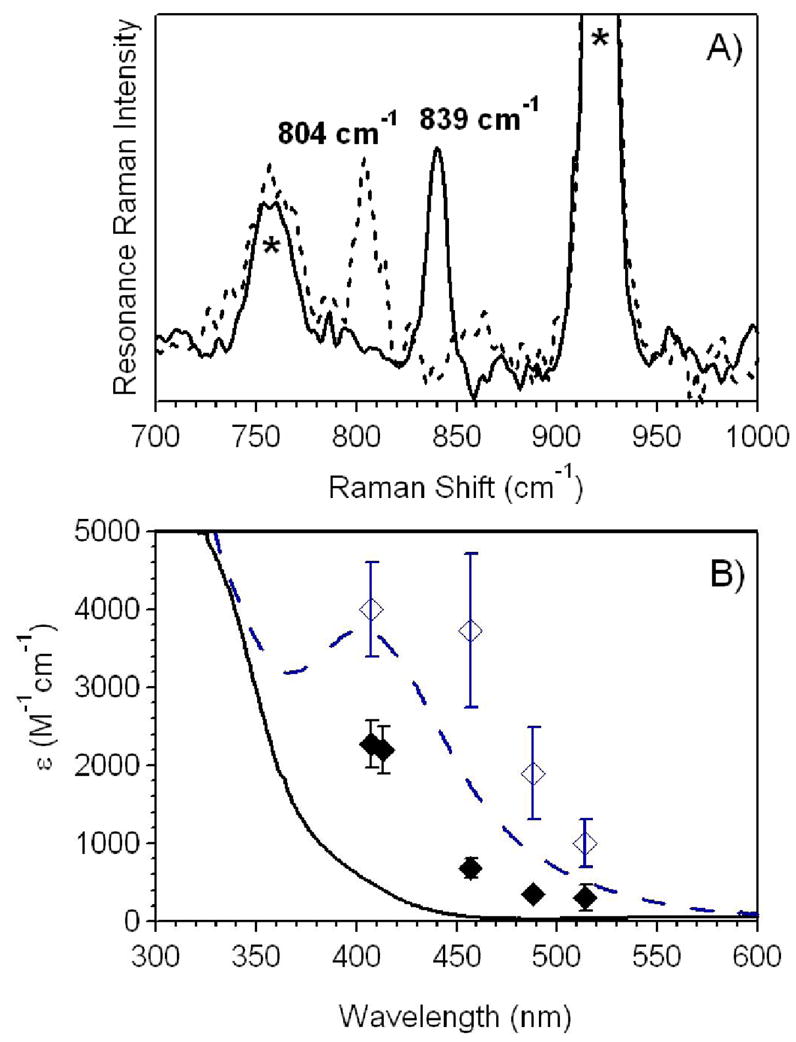
A) Resonance Raman spectra of 4 mM [FeIV(O)(TMC)(NCMe)]2+ in MeCN prepared with PhIO (––) and with added H218O (---) using an excitation wavelength of 407 nm. The sample was spinning during data collection and maintained at a temperature of −20 °C. Raman peaks associated with solvent vibrations are marked with an asterisk. B) Superposition of the electronic absorption spectra and resonance Raman excitation profiles of the νFeO vibrations for [FeIV(O)(TMC)(NCMe)]2+ (solid black line, ◆) and [FeIV(O)(TMC)(N3)]+ (blue dashed line, ◇). Error bars indicated two standard deviations from three experiments. All data was obtained at −40 °C in MeCN solution.
In general, the RR data support the notion that increased basicity of the trans ligand weakens the Fe=O bond, consistent with our EXAFS data that revealed the longest Fe=O bond lengths for 1-OH and 1′-SR (Table 3). A similar trend has been observed for the axial ligand effect on oxoiron(IV) porphyrin complexes. For example, in a resonance Raman study of five [Fe(O)(TMP•)(X)]+ complexes (TMP• = one-electron oxidized derivative of tetramesitylporphin dianion; X = Cl−, F−, m-chlorobenzoate, OTf−, and ClO4−),76 Kincaid and co-workers found the νFeO frequencies to fall into two narrow ranges, 801 – 806 cm−1 for the first three complexes and 834 – 835 cm−1 for complexes of the much weaker triflate and perchlorate ligands. Similarly, Gold et al. showed that the νFeO frequencies of [FeIV(O)(Cl8TPP)(L)] (Cl8TPP = tetrakis(2,6-dichlorophenyl)porphin dianion; L = THF, DMF, 1-methylimidazole) decreased from 841 to 818 cm−1 as the axial ligand became more electron donating.77
The use of RR spectroscopy to observe νFeO was previously reported for 1-N3 and 1-NCS, for which 16O/18O-sensitive Raman bands were detected at 812 and 820 cm−1, respectively.28 These complexes, however, display prominent absorption bands that have maxima near the 407 nm excitation wavelength used in the RR experiment (λmax = 407 and 387 for 1-N3 and 1-NCS, respectively; see Figure 3). This led us to assign those bands as O2− → FeIV CT transitions.28 The fact that similar experiments using the same excitation wavelength also allow us to observe νFeO for 1-NCMe and other members of the 1-X series (Table 1), most of which do not display significant absorption intensity at ~407 nm, suggests that excitation in near resonance with an O2− → FeIV CT transition that occurs with a λmax < 400 nm permits the observation of νFeO as well. Support for this notion comes from an excitation profile performed for 1-NCMe. For these experiments the intensity of the Raman band at 839 cm−1 was monitored as a function of the excitation wavelength. As shown in Figure 6B, the Raman band becomes more intense as the excitation wavelength approaches the onset of absorption intensity at ~350 nm, suggesting that this absorption feature has some contribution from an O2− → FeIV CT transition. In contrast, the corresponding excitation profile for 1-N3 (Figure 6B) illustrates that the relative intensity of νFeO is increased when the excitation wavelength is in resonance with the near-UV band at 407 nm.
E. Mössbauer Data
Zero-field Mössbauer spectra were obtained for all members of the 1-X series and key parameters obtained from these data sets are shown in Table 1. Corresponding parameters for 1-NCMe, 1-N3, 1-NCS, and 1′-SR had previously been reported18,28,30 and are shown for comparison. As can be seen from inspection of Table 1, there is a very minor variation in the isomer shift value (δ), but a rather large change in the quadrupole splitting (ΔEQ) among the 1-X series. The isomer shift largely marks the electron density at the Fe center and is indicative of the iron oxidation state and spin state. As such, the relatively small range of isomer shift values shown in Table 1 is consistent with the formulation of all 1-X complexes as S = 1 FeIV compounds. In contrast, the quadrupole splittings span a range of nearly 1.7 mm/s, the values decreasing with increasing basicity of the axial ligand.
Additional Mössbauer data for the 1-X complexes were collected over the temperature range from 4.2 to 120 K in parallel applied magnetic fields up to 8.0 T. These data were fit using the spin Hamiltonian of eq. 2, where D and E are the axial and rhombic zero-field splitting (ZFS) parameters, respectively,
| (2a) |
| (2b) |
and A is the magnetic hyperfine tensor. The quadrupole interactions (ℋQ) depend on the principal components of the electric field gradient (EFG) tensor (V) and are described by Vzz and the asymmetry parameter of the EFG η = (Vxx − Vyy)/Vzz. For all fits, we have assumed that the ZFS-, EFG-, and A-tensors are collinear and that S = 1 and g = 2.0. Although the g-values of S = 1 FeIV complexes may deviate from 2.0, these deviations are difficult to determine by Mössbauer spectroscopy because of the large D-values of these complexes. All spectra were simulated in the fast relaxation limit of the electron spin.
Mössbauer data collected for 1-N3 at different temperatures and magnetic field strengths, along with spectral simulations using eq. 2 and the parameters listed in Table 1, are shown in Figure 7. Fits to data obtained for the other 1-X complexes are of similar quality and yielded the corresponding parameters collected in Table 1. For all complexes, the axial ZFS parameter D is quite large (~30 cm−1), reflecting the presence of low-lying S = 0 and S = 2 excited states that mix with the S = 1 ground state via spin-orbit coupling.
Figure 7.

Mössbauer spectra of [FeIV(O)(TMC)(N3)]+ recorded at temperatures and applied parallel fields as indicated. Solid lines are spectral simulations based on eq. 2 using the parameters listed in Table 1. The sample contained a 20% high-spin ferric contaminant. Its 4.2 K spectral features were simulated (Figure S1) and removed from the data.
3.3 Computations
When considered together, the spectroscopic data collected for the 1-X series support two conclusions: i) the Fe=O bond length is only slightly perturbed by the nature of the trans ligand (Table 3), with the hydroxide and thiolate ligands of 1-OH and 1′-SR, respectively, providing notable exceptions, and ii) the electronic structure of the oxoiron(IV) unit is nonetheless modulated by the donor properties of the trans ligand, as evidenced by the dependence of the XAS pre-edge area and quadrupole splitting parameter on the basicity of X−, and the altered electronic absorption spectra of the 1-X complexes (Figures 2 and 3). To gain further insight into the possible origins of these experimental observations, we have performed density functional theory (DFT) computations for 1-NCMe and all 1-X complexes.78
A. DFT-Optimized Geometries
Key metric parameters of our DFT-optimized models of 1-NCMe and all 1-X complexes are collected in Table 4; the corresponding iron–ligand distances obtained by EXAFS analyses are shown for comparison in parentheses. The structure of 1-NCMe is in good agreement with that determined experimentally by X-ray crystallography, except the Fe–NTMC distance (where Fe–NTMC is the average distance from the iron center to the N atoms of the TMC macrocycle) is slightly overestimated (average computed and crystallographic distances are 2.123 and 2.090 Å, respectively),18 as was observed in previous studies by Neese and co-workers.79,80 The computed Fe–NTMC distance appears, to some extent, to be a function of the size of X (Table 4). For instance, 1-OH has computed Fe–NTMC distances of ~2.11 Å, whereas 1-O2CCF3 and 1′-SR, which contain bulkier X groups, display corresponding values of >2.14 Å. For all other 1-X complexes, the predicted distances are ~2.12 Å. This observation appears to be in contrast with the results of our EXAFS analysis that showed a nearly invariant Fe–NTMC distance of ~2.08 Å (Table 3). A comparison of the predicted Fe–X distances with those obtained experimentally is somewhat problematic, as, in most cases, our EXAFS data did not require splitting the shell consisting of five nitrogen scatterers. Thus, in those cases, the Fe–X distance is either very close to the average experimental Fe–NTMC distance of ~2.08 Å, or the X scatterer is effectively masked by the more intense shell. However, for 1-OH and 1′-SR, the Fe–OH and Fe–S distances were discernible via EXAFS analysis and are in relatively good agreement with our computed values (Table 4). Most importantly, the Fe=O bond length is the key structural parameter of interest, and this is in reasonably good agreement with our EXAFS data (Table 4).
Table 4.
Iron-ligand Bond Lengths (Å) for [FeIV(O)(TMC)(X)]2+/+ (1-X) Complexes Based on DFT Computations.a
| Fe–O (Å) | Fe–NTMC (Å) | Fe–X (Å) | |
|---|---|---|---|
| 1-NCMe | 1.646 (1.64) | 2.123 (2.08) | 2.087 (2.08) |
| 1-O2CCF3 | 1.661 (1.64) | 2.144 (2.08) | 2.004 (2.08) |
| 1-NCO | 1.674 (1.67) | 2.125 (2.07) | 1.940 (2.07) |
| 1-NCS | 1.677 (1.65) | 2.123 (2.07) | 1.932 (2.07) |
| 1-N3 | 1.676 (1.66) | 2.126 (2.08) | 1.930 (2.08) |
| 1′-SRb | 1.697 (1.70) | 2.148 (2.09) | 2.342 (2.33) |
| 1-CN | 1.684 (1.66) | 2.127 (2.08) | 2.012 (2.08) |
| 1-OH | 1.692 (1.68) | 2.108 (2.10) | 1.895 (1.94) |
The corresponding Fe–L distances obtained by analyses of Fe K-edge EXAFS data are shown for comparison in parentheses.
Iron–ligand distances obtained through EXAFS analysis in ref. 30.
B. Bonding Descriptions for Oxoiron(IV) Complexes
The bonding descriptions of 1-NCMe and related species have been discussed in detail elsewhere,30,62,63,79,81–83 and will be summarized here to provide a framework by which to understand perturbations due to trans substitutions. The 1-NCMe complex has an S = 1 (dxy)2(dxz)1(dyz)1 electron configuration, with an Fe d orbital splitting pattern best described as a deviation from octahedral splitting due to the large covalency of the oxo unit (Figure 8). The dxz/yz and dz2 MOs are Fe=O π- and σ-antibonding, respectively, whereas the dx2−y2 MO is Fe–NTMC σ-antibonding. The dxy MO is effectively nonbonding. The splitting of the dxy and dx2−y2 MOs is related to the energy difference between the triplet (S = 1) ground state and quintet (S = 2) excited state, as the lowest-energy quintet state has a (dxy)1(dxz)1(dyz)1(dx2−y2)1 configuration.
Figure 8.
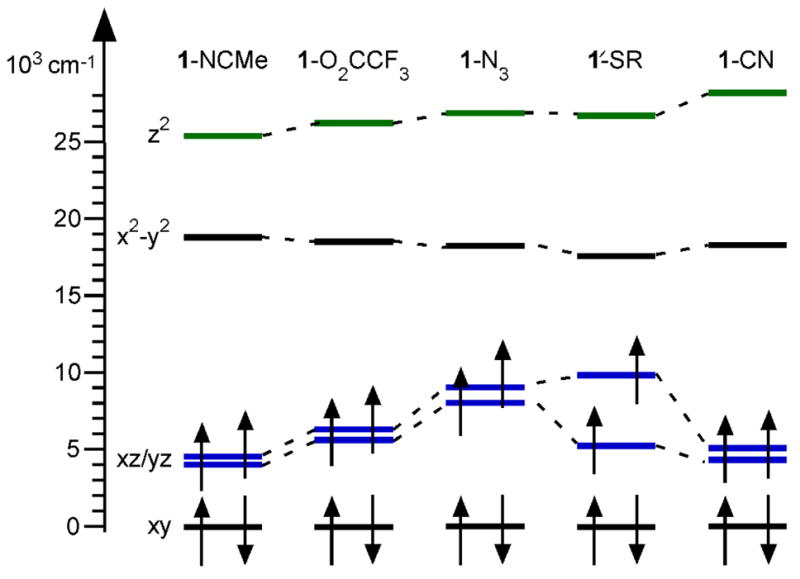
Molecular orbital splitting diagram for [FeIV(O)(TMC)(X)]2+/+ (1-X) complexes based on DFT computations using the PBE0 hybrid functional. For comparison, the orbital energies are all plotted relative to the spin-up dxy MO of each complex. MOs involved in FeIV=O π- and σ-antibonding interactions are highlighted in blue and green, respectively.
The Fe d orbital splittings of select 1-X complexes are shown in Figure 8, and the compositions of the Fe d-based MOs involved in Fe=O bonding are collected in Table 5.84 (For this discussion, 1-N3 is taken as a representative example of the pseudohalide complexes, except for 1-CN, which is unique because of its σ-basicity and π-acidity. In addition, the bonding picture for 1-OH is not discussed, because it has a d-orbital splitting pattern similar to that of 1′-SR, as shown in Table S12) Substitution of the NCMe ligand with an anion leads in all cases to destabilization of the dz2 MO (Figure 8), which is greatest with the rather basic CN− ligand. This reduces the covalency of the Fe=O σ-bond, as marked by decreased oxo pz character in the dz2 MOs for the complexes with anionic ligands. This loss is compensated by increased X− pz character only in the cases of 1-N3, and 1′-SR, as shown in Table 5. The energies of the dx2−y2 orbitals relative to the dxy orbitals decrease in the order 1-NCMe > 1-O2CCF3 > 1-CN ~ 1-N3 > 1′-SR, which follows the triplet-quintet splitting computed for these complexes (excluding 1-CN) in a separate study.29
Table 5.
Mulliken Spin Densities and Compositions of Spin-Down Molecular Orbitals (%) Involved in Fe=O Bonding Based on PBE0 DFT Computations for Select [FeIV(O)(TMC)(X)]2+/+ (1-X) Complexes.
| Spin density | Fe dxz MO (β) | Fe dyz MO (β) | Fe dz2 MO (β) | ||||||||
|---|---|---|---|---|---|---|---|---|---|---|---|
| Fe | O | Fe 3d | O 2p | X 2p | Fe 3d | O 2p | X 2p | Fe 3d | O 2p | X 2p | |
| 1-NCMe | 1.36 | 0.81 | 51 | 36 | 0.9 | 53 | 34 | 1.1 | 59 | 19 | 1.1 |
| 1-O2CCF3 | 1.48 | 0.71 | 59 | 32 | 1.9 | 62 | 32 | 1.3 | 59 | 18 | 1.9 |
| 1-N3 | 1.43 | 0.72 | 55 | 33 | 3.1 | 61 | 28 | 7.5 | 55 | 16 | 8.9 |
| 1′-SR | 1.42 | 0.75 | 53 | 37 | 0.9 | 62 | 27 | 5.5 | 56 | 15 | 8.6 |
| 1-CN | 1.37 | 0.82 | 53 | 36 | 3.9 | 55 | 35 | 4.1 | 57 | 15 | 2.6 |
While the dz2 and dx2−y2 orbitals are only modestly perturbed by trans substitution, the energies and compositions of the dxz/yz MOs are strongly dependent on the nature of X (Figure 8 and Table 5). For 1-O2CCF3 the dxz/yz MOs lie slightly higher in energy than those of 1-NCMe, likely reflecting the loss of a weak FeIV–X back-bonding interaction30 upon going from NCMe to CF3CO2−. Consequently, the spin density is more polarized towards the Fe center for 1-O2CCF3 (Table 5). Substitution of NCMe by the pseudohalide N3−, in contrast, leads to a pronounced destabilization (~3000 – 4000 cm−1) of the dxz/yz MOs and a reduction of oxo character in the higher-energy dyz MO. These changes mark a weaker Fe=O π-bond for 1-N3 relative to 1-NCMe and 1-O2CCF3, consistent with the lower νFeO observed for 1-N3. The weaker Fe=O π-bond for 1-N3 also leads to a shift of spin density towards the Fe center, though to a lesser extent than 1-O2CCF3, as some spin density is delocalized onto the pseudohalide ligand. For 1′-SR, the orientation of the thiolate ligand is such that it has a significantly stronger π-interaction with the dyz than the dxz orbital (Table 5). Consequently, these MOs are split by ~4500 cm−1 (Figure 8), with the dyz MO at higher energy. Substitution of NCMe with the π-acidic CN− ligand maintains the Fe–X back-bonding interaction, leaving the relative energies and compositions of the dxz/yz MOs of 1-CN, along with the Fe and O spin densities, virtually identical to those of 1-NCMe (Figure 8 and Table 5). Thus, 1-CN presents a unique case, as the π-acidic nature of the CN− ligand supports an Fe=O π-bond similar to that of 1-NCMe, whereas its σ-donor properties lead to the least covalent Fe=O σ-bond among the 1-X series. This interplay between π-acidity and σ-basicity explains why the νFeO of 1-CN is similar to that of the other pseudohalides, even though the basicity of CN− would be more consistent with a lower energy Fe=O vibration.
C. Assignment of LMCT Transitions
The observation of νFeO’s for 1-NCMe, 1-O2CCF3, and 1-CN, none of which exhibit CT features in the visible region, can be attributed to excitation in near-resonance with an O2− → FeIV CT transition in the UV spectral region, and this conclusion is supported by the excitation profile obtained for 1-NCMe (Figure 6B). This finding calls into question our previous assignment of the visible bands of 1-N3 and 1-NCS as O2− → FeIV CT transitions.28 This earlier interpretation, while consistent with our previous data, is counterintuitive, as replacement of MeCN with more electron donating ligands, such as N3− and NCS−, should lower the Lewis acidity of the FeIV center, shifting the O2− → FeIV CT transitions to higher energies. It is thus possible that the observation of νFeO for 1-N3 and 1-NCS is the result of a near-resonance excitation of an O2− → FeIV CT transition in the UV spectral region and not of the electronic transition(s) in the visible region. If that were the case, the visible absorption bands could be assigned as N3−/NCS− → FeIV CT transitions. That assignment would be consistent with observation of low energy CT transitions at ~540 nm, likely N3− → FeIV in nature, for a related complex with an FeIV–N3 unit but with no oxo ligand, [FeIV(N3)(Me3cyclam–acetate)]+.72,73 Under that assumption, however, one might expect to observe pseudohalide-related vibrations upon 407 nm excitation, and that is not the case.28 Because the resonance Raman data do not allow us to unambiguously assign the UV/visible LMCT features of 1-N3 and 1-NCS, as well as that of 1-NCO, which displays a λmax at ~350 nm (Figure 3), we turned to DFT computations to gain further insight into the nature of these absorption bands.
TD-DFT and ΔSCF Computations
Because the time-dependent (TD) DFT method has been previously used to determine excited state energies for oxoiron(IV) complexes,25,64 we used this procedure to predict electronic absorption spectra for 1-N3, 1-NCS, 1-NCO, and 1-NCMe. Using the experimental transition energies reported for 1-NCMe as a benchmark,62 we evaluated the performance of several different functionals for our model of 1-NCMe (see Supporting Information) and determined that the PBE0 hybrid functional afforded transition energies and intensities in best agreement with the experimental data. The computed absorption spectrum of 1-NCMe displays a low-energy band (band i, see Figures 9) of moderate intensity that corresponds to the prominent NIR band observed in the experimental spectrum at 824 nm (Figure 2). Consistent with the experimental band assignments,62,64 the intensity of the computed band i largely derives from the dxz/yz → dx2−y2 transition,85 with the dxy → dx2−y2 and dxy → dxz/yz transitions contributing to the lower-energy shoulder (Table 6).
Figure 9.
Electronic absorption spectra for 1-NCMe (top) and 1-N3 (bottom) obtained by TD-DFT computations.
Table 6.
TD-DFT Calculated Energies (cm−1), Percent Contributions from Dominant One-electron Excitations, and Oscillator Strengths for the Major Electronic Transitions of [FeIV(O)(TMC)(NCMe)]2+ (1-NCMe) and [FeIV(O)(TMC)(N3)]+ (1-N3) Using the PBE0 Functional.
| band | state | energy (cm−1)a | fosc | Transitiona | % | donor MO | acceptor MO | comments |
|---|---|---|---|---|---|---|---|---|
|
1-NCMe
| ||||||||
| 1 | 9 700 | <0.00001 | 95β → 100β | 58 | Fe dxy | Fe dx2−y2 | FeIV d → d | |
| 95α → 100α | 32 | Fe dxy | Fe dx2−y2 | FeIV d → d | ||||
| 2 | 12 700 | 0.00001 | 95β → 99β | 82 | Fe dxy | Fe dxz | FeIV d → d | |
| 3 | 12 700 | 0.00001 | 95β → 98β | 81 | Fe dxy | Fe dyz | FeIV d → d | |
| i | 4 | 16 200 | 0.00251 | 99α → 100α | 42 | Fe dxz | Fe dx2−y2 | FeIV d → d |
| 5 | 16 500 | 0.00325 | 98α → 100α | 45 | Fe dyz | Fe dx2−y2 | FeIV d → d | |
| 97α → 100α | 20 | NTMC px/y | Fe dx2−y2 | FeIV d → d | ||||
| ii | 13 | 26 700 | 0.01625 | 97β → 99β | 28 | O px | Fe dxz | O2− → FeIV CT |
| 96β → 98β | 26 | O py | Fe dyz | O2− → FeIV CT | ||||
| 96α → 100α | 19 | NTMC px/y | Fe dx2−y2 | NTMC → FeIV CT | ||||
| 14 | 28 900 | 0.00676 | 96β → 100β | 38 | O py | Fe dx2−y2 | O2− → FeIV CT | |
| 97β → 101β | 26 | O px | Fe dz2 | O2− → FeIV CT | ||||
| 98α → 100α | 15 | Fe dyz | Fe dx2−y2 | FeIV d → d | ||||
|
| ||||||||
|
1-N3
| ||||||||
| iii | 1 | 7 800 | 0.00001 | 93β → 100α | 56 | Fe dxy | Fe dx2−y2 | FeIV d → d |
| 93α → 100β | 34 | Fe dxy | Fe dx2−y2 | FeIV d → d | ||||
| 2 | 10 600 | 0.00018 | 99α → 100α | 46 | N3 px | Fe dx2−y2 | N3− → FeIV CT | |
| 97α → 100α | 28 | Fe dxz | Fe dx2−y2 | FeIV d → d | ||||
| 3 | 11 800 | 0.00029 | 96α → 100α | 32 | Fe dyz | Fe dx2−y2 | FeIV d → d | |
| 98α → 100α | 25 | N3 py/z | Fe dx2−y2 | N3− → FeIV CT | ||||
| 93β → 99β | 22 | Fe dxy | Fe dxz | FeIV d → d | ||||
| 4 | 14 000 | 0.00030 | 93β → 99β | 65 | Fe dxy | Fe dxz | FeIV d → d | |
| 5 | 14 300 | 0.00018 | 93β → 98β | 75 | Fe dxy | Fe dyz | FeIV d → d | |
| iv | 11 | 19 600 | 0.00180 | 96α → 101α | 30 | Fe dyz | Fe dz2 | FeIV d → d |
| 98α → 101α | 22 | N3 py/z | Fe dz2 | N3− → FeIV CT | ||||
| 12 | 20 100 | 0.00422 | 98α → 100α | 52 | N3 py/z | Fe dx2−y2 | N3− → FeIV CT | |
| 96α → 100α | 28 | Fe dyz | Fe dx2−y2 | FeIV d → d | ||||
| 14 | 20 600 | 0.00466 | 97α → 100α | 32 | Fe dxz | Fe dx2−y2 | FeIV d → d | |
| 99α → 100α | 22 | N3 px | Fe dx2−y2 | N3− → FeIV CT | ||||
| v | 15 | 22 800 | 0.01080 | 96β → 98β | 54 | N3 py/z | Fe dyz | N3− → FeIV CT |
| 95β → 98β | 13 | O py | Fe dyz | O → FeIV CT | ||||
| 17 | 23 300 | 0.02010 | 97β → 99β | 53 | N3 px | Fe dxz | N3− → FeIV CT | |
| 95β → 98β | 13 | O py | Fe dyz | O2− → FeIV CT | ||||
The α and β designations correspond to spin-up and spin-down MOs, respectively. For compositions of the MOs referred to in this Table, see Tables S16 and S20.
The higher energy absorption band computed for 1-NCMe (band ii; see Figure 9) arises predominantly from O px/y → FeIV dxz/yz CT transitions that are mixed with an NTMC px/y → Fe dx2−y2 CT transition (state 13, Table 6). The high absorption intensities derive from the large percentage of oxo character in the donor and acceptor MOs (Table 5). The experimental O px/y → FeIV dxz/yz CT transition energies have not been unambiguously established owing to the overlap of several intense electronic transitions in the UV spectral region. However, a lower limit of 385 nm (>26 000 cm−1) has been determined,62,64 so our TD-DFT computations underestimate the O px/y → FeIV dxz/yz CT transition energies to some extent. Nevertheless, as we are most concerned with how these energies are affected upon substitution of the NCMe ligand with a pseudohalide, an absolute agreement between experimental and predicted transition energies is not essential for our analysis.
Because the TD-DFT method reasonably approximated the dominant absorption features for 1-NCMe, we performed similar computations for 1-N3, 1-NCS, and 1-NCO to determine the energies of the O2− → FeIV and X− → FeIV CT transitions for these complexes. The TD-DFT computed absorption spectrum of 1-N3, upon which we will focus our discussion, is shown in Figure 9 (bottom), whereas the corresponding spectra for 1-NCS and 1-NCO are shown in Figure S8. The LF transitions of 1-N3 are perturbed relative to those of 1-NCMe (cf. Figure 9 top and bottom), with the FeIV dxz/yz → dx2−y2 and dxy →dx2−y2 transitions of 1-N3 being red-shifted (by ~5000 and 2000 cm−1, respectively) and carrying less intensity (Table 6). These calculated spectra are in reasonably good agreement with our experimental observations, as 1-N3 displays NIR absorption maxima at 850 and 1050 nm (Table 1), red-shifted relative to that of 1-NCMe (λmax = 824 nm). Furthermore, the NIR features of 1-N3 are significantly less intense than those of 1-NCMe (ε= 130 and 400 M−1cm−1, respectively). The perturbations of these d → d transition energies can be understood on the basis of the destabilization of the dxz/yz MOs upon replacement of the NCMe ligand with the N3− ligand, as shown in Figure 8. The destabilization lowers the energy gap between the dxz/yz and dx2−y2 MOs and red-shifts the corresponding d → d transition energies.
The TD-DFT computed absorption spectrum of 1-N3 also differs from that of 1-NCMe in that a prominent absorption band is predicted at ~500 nm (~20 000 cm−1) for the former species (band v). This absorption band contains contributions from two electronic transitions (states 15 and 17, Table 6), both of which can be assigned as N3− → FeIV CT in nature but also contain a minor O2− → FeIV CT component (Table 6). Notably, all O2− → FeIV CT transitions are blue-shifted relative to those of 1-NCMe, occurring at ~30 000 cm−1 for 1-N3 (Table S17), consistent with the higher-lying FeIV dxz/yz MOs of 1-N3 relative to 1-NCMe (Figure 8). Additionally, both the TD-DFT computed absorption spectra of 1-NCS and 1-NCO display absorption maxima due to NCO− and NCS− to FeIV CT transitions at 415 and 525 nm, respectively, with O2− → FeIV CT transitions being at higher energies (Figure S8). On the basis of these TD-DFT calculations, the visible absorption features of 1-N3, 1-NCS, and 1-NCO would seem best assigned as X− → FeIV CT transitions. This assignment, however, is challenged by our resonance Raman data that reveal iron-oxo but no pseudohalide-related vibrations.
To reconcile these observations and gain further insights into excited-state distortions associated with these CT excited states, we turned to the ΔSCF method for treating excited states, as this procedure allows us to energy-minimize nuclear coordinates of select excited states.48,86 The energies of the X− → FeIV CT and O2− → FeIV CT transitions obtained by this procedure are in good agreement with both those determined experimentally and those computed using the TD-DFT method, predicting X− → FeIV CT transitions in the visible region for the pseuodhalide complexes (Table 7). Energy minimization of the O2− py → FeIV dyz CT state for 1-NCMe led to a markedly elongated Fe–O distance of 1.88 Å (cf. the equilibrium distance of 1.646 Å), whereas all other structural parameters were essentially unchanged. As illustrated by the MO contour plots in Figure 10, this transition formally transfers an electron from an Fe–O π-bonding MO to the corresponding antibonding MO, so the elongation of the Fe–O bond is expected. We next performed a similar computation to determine the dominant structural distortions associated with the N3− py/z → FeIV dyz CT transition. Surprisingly, the excited-state geometry displayed an Fe–O distance of 1.85 Å, significantly longer than the ground-state equilibrium distance of 1.68 Å. Furthermore, the Fe–N(N2) and intra-azide distances were within ±0.02 Å of their ground-state equilibrium values. Thus, these computations demonstrate that the predominant geometric distortion associated with an N3− → FeIV CT transition actually occurs within the Fe–O unit.
Table 7.
DFT-computed X− → FeIV and O2− → FeIV CT Transition Energies for [FeIV(O)(TMC)(X)]2+/+ Complexes, where X = NCMe, NCO−, NCS−, and N3−
| X = | 1-NCMe | 1-NCO | 1-NCS | 1-N3 |
|---|---|---|---|---|
| Near-UV λmax (cm−1) | >26 000 | 28 600 | 25 800 | 24 600 |
| X− 2py → FeIV 3dyz (cm−1) | 21 900 | 19 600 | 19 000 | |
| X− 2px → FeIV3dxz (cm−1) | 22 400 | 20 000 | 19 600 | |
| O2− 2py → FeIV 3dyz (cm−1) | 24 900 | 27 900 | 25 600 | 27 000 |
| O2− 2px → FeIV3dxz (cm−1) | 25 200 | 29 400 | 25 800 | 27 100 |
Figure 10.

Schematic frontier molecular orbital splitting diagram for [FeIV(O)(TMC)(NCMe)]2+ (1-NCMe) and [FeIV(O)(TMC)(N3)]+ (1-N3) and contour plots of molecular orbitals involved in LMCT transitions.
This counter-intuitive prediction may be rationalized by inspection of the donor and acceptor MOs for the N3− py/z → FeIV dyz CT transition shown in Figure 10. The N3− py/z MO is localized predominantly on the N3− ligand (74% N3− character); thus, this MO is essentially nonbonding with respect to the Fe–N3 unit. In contrast, the acceptor MO is an Fe=O π-antibonding MO (Figure 10) with almost equal iron and oxo character, and a small percentage of N3− character (~10%; see Table 5). Thus, an N3− py/z → FeIV dyz CT transition hardly affects the Fe–N3 bond but, because this excitation places an electron in an Fe=O π-antibonding MO, weakens the Fe=O bond. Consequently, it may be more accurate to describe the N3− → FeIV CT transition as an N3− → FeIV=O CT transition, as the latter description better reflects the high covalency of the Fe=O unit.
4. Summary and Perspectives
This study presents the spectroscopic characterization of a set of oxoiron(IV) complexes that differ only with respect to the ligand trans to the oxo unit, the most extensive series investigated to date. EXAFS analysis shows that the Fe=O bond length changes little, ranging from 1.64 to 1.68 Å (Table 3). Our DFT calculations (Table 4) support the experimental observations and, like previous calculations on oxoiron(IV) complexes,63,64,79,80 highlight the covalency of the Fe=O bond. The Fe=O bond is so covalent that axial-ligand-to-metal CT bands observed near 400 nm in [FeIV(O)(TMC)X]+ complexes (X = N3, NCO, or NCS) are better described as X− → FeIV=O CT in character, rather than simply X− → FeIV. Thus the acceptor MO in this CT transition is mainly Fe=O π-antibonding in nature, leading to the observed enhancement of only the Fe=O vibration upon excitation of the charge-transfer band. This is fully consistent with the observed Fe=O vibronic structure in d-d transitions of oxoiron(IV) adducts using MCD spectroscopy.63
Despite the relative invariance of the Fe=O bond length across the [FeIV(O)(TMC)X]+ series, there is a perceptible trend, albeit small, of the Fe=O bond length increasing as the axial ligand becomes more basic, particularly when the 1.70 -Å Fe=O bond of 1′-SR is also included. Our calculations show that the σ- and π-donor properties of the trans ligand perturb the relative energies and compositions of the Fe=O σ- and π-antibonding MOs (the FeIV dz2 and dxz/yz MOs, respectively), with strong donor ligands (i.e., basic ligands) weakening the Fe=O bond (Figure 8). These differences, though not large enough to change the Fe=O bond length significantly, become magnified through the lenses of the spectroscopic methods used in this study because of the sensitivity of these probes to Fe=O bonding. Indeed it is clear that the donor properties of the trans ligand can exert a considerable influence over all characteristic spectroscopic properties of the oxoiron(IV) unit, including i) FeIV d → d transition energies (Figure 2), ii) XAS pre-edge areas (Table 2), iii) Mössbauer quadrupole splittings (Table 1), and iv) the Fe=O stretching frequencies (Table 1). This is in stark contrast to cis ligand effects that have a smaller influence on the spectroscopic properties of the Fe=O unit.25 For example, the large variation in pre-edge areas observed for the 1-X series (Table 2) is in contrast to the much smaller range of 25 – 27 units found for [FeIV(O)(TPA)(X)]n+ (X = MeCN, CF3CO2−, Cl−, and Br−), where substitutions occur cis to the oxo ligand.25 Taken together, the different consequences of trans versus cis ligand effects in these model studies are consistent with the observations that FeIV=O adducts found in nonheme iron enzymes are able to tolerate cis-perturbations because the cis position exerts a smaller effect on Fe=O bonding. For example, the halogenase CytC3 employs a chloro ligand cis to the FeIV=O unit instead of a carboxylate ligand,11 and a variant of TauD lacking a cis histidine ligand is still able to support an FeIV=O adduct.67
Figure 11 shows the Fe K-edge pre-edge areas plotted against corresponding Mössbauer quadrupole splittings (filled circles), and the line represents the reasonably good correlation between these two sets of parameters. This is the first extensive data set for which it has been possible to establish such a trend. The observed correlation should not be surprising, however, as the magnitude of the observable for both techniques depends on the extent of distortion of the electron distribution from spherical symmetry. The oxo ligand dominates the metal coordination environment and severely distorts it from spherical symmetry, giving rise to pre-edge areas and quadrupole splittings that are fairly large. The axial ligand can mitigate or enhance the extent of this distortion depending on its σ- and π-donating properties, and this effect accounts for the range of observed pre-edge areas and quadrupole splittings.
Figure 11.

Plot of Fe K-edge pre-edge peak areas (filled circles) and ν(Fe=O) (filled triangles) as a function of Mössbauer quadrupole splitting parameters (ΔEQ) for the [FeIV(O)(TMC)(X)]+ complexes.
There also appears to be some correlation between Fe=O stretching frequencies of the various [FeIV(O)(TMC)(X)]+ complexes and the Mösssbauer quadrupole splittings (Figure 11, triangles), although there are fewer points available (due to our failure to identify the νFeO’s of 1-OH and 1′-SR) and more scatter. In general, the data support the notion that increased basicity of the trans ligand weakens the Fe=O bond.
Our spectroscopic investigations can also be viewed in light of a recent study examining the reactivities of a subset of these complexes, namely 1-NCMe, 1-O2CCF3, 1-N3, and 1′-SR.27 These four complexes were compared with respect to their ability to effect oxo transfer to PPh3 and H-atom abstraction from 2,4-di-t-butylphenol and dihydroanthracene. Interestingly, while oxo-transfer ability increased as expected with greater electrophilicity of the Fe=O unit, i.e. 1-NCMe > 1-O2CCF3 > 1-N3 > 1′-SR, the trend for H-atom abstraction was exactly the opposite, i.e. 1-NCMe < 1-O2CCF3 < 1-N3 < 1′-SR. In associated DFT calculations, it was proposed that the counter-intuitive and apparently anti-electrophilic trend observed for H-atom abstraction could be rationalized by considering how the various axial ligands affect access to the more reactive S = 2 excited state of the FeIV=O unit.82,87–89 The gap between the S = 1 ground state and the S = 2 excited state decreases as the extent of charge donation from the trans ligand to the Fe=O unit increases (Figure 8). In principle, this gap should be reflected in the D values of these complexes (Table 1), the magnitude of which depends on the extent of spin-orbit coupling between the S = 1 ground state and the S = 2 excited state. However, the uncertainty of the D values determined by Mössbauer spectroscopy (±2 cm−1) allows us to conclude only that the thiolate-ligated complex 1′-SR has a larger D value and thus a smaller triplet-quintet splitting. The use of alternative methods to more accurately define D for nonheme oxoiron(IV) complexes is currently being investigated.
Intriguingly, the observed H-atom abstraction reactivity trend is not reflected in the νFeO values, where the ordering is 1-O2CCF3 > 1-NCMe > 1-N3. In addition, there is no obvious spectroscopic or computational trend that follows the observed reactivity ordering, which could be a consequence of the relatively small number of complexes used in the reactivity study. Alternatively, the lack of a clear correlation between spectroscopic and reactivity properties could reflect the fact that the spectroscopic parameters are most affected by Fe=O bonding, whereas the triplet-quintet gap involves the dxy and dx2−y2 orbitals, which do not contribute to the Fe=O bonding interactions. Further studies are clearly warranted to test these alternatives and better define the factors influencing the reactivity of the FeIV=O unit.
Supplementary Material
Mössbauer spectra for 1-N3 (Figure S1), Fe K-edge EXAFS data and fitting analyses for 1-X complexes (Figures S2, S3, S5 and S6; Tables S1 – S3), ESI-MS data for 1-X complexes (Figure S4), Cartesian coordinates and d-based MO compositions for all DFT energy-minimized 1-X models (Tables S4 – 12), details of TD-DFT computations and plots of predicted absorption spectra for 1-NCMe, 1-N3, 1-NCO, and 1-NCS (Figures S7 and S8; Tables S13 – 20). This material is available free of charge via the Internet at http://pubs.acs.org.
Acknowledgments
This research was supported by the US National Institutes of Health (GM-33162 to L.Q., EB-001475 to E.M. and GM-075700 to T.A.J.), the Creative Research Initiative Program of MOST/KOSEF (W.N.). XAS data were collected on beamline 9-3 at the Stanford Synchrotron Radiation Laboratory (SSRL) and beamline X9B at the National Synchrotron Light Source (NSLS). The SSRL Structural Molecular Biology Program is supported by the Department of Energy, Office of Biological and Environmental Research, and by the National Institutes of Health, National Center for Research Resources, Biomedical Technology Program. NSLS is supported by the U.S. Department of Energy, Office of Science, Office of Basic Energy Sciences, under Contract No. DE-AC02-98CH10886. We thank Dr. Matthew J. Latimer at SSRL and Dr. Nebojsa S. Marinkovic at NSLS for their excellent technical support of our synchrotron experiments, Professor Thomas Brunold of the University of Wisconsin-Madison for graciously providing access to his computer cluster, and Dr. Adam T. Fiedler for valuable comments on this manuscript.
References
- 1.Costas M, Mehn MP, Jensen MP, Que LJ. Chem Rev. 2004;104:939–986. doi: 10.1021/cr020628n. [DOI] [PubMed] [Google Scholar]
- 2.Solomon EI, Brunold TC, Davis MI, Kemsley JN, Lee SK, Lehnert N, Neese F, Skulan AJ, Yang YS, Zhou J. Chem Rev. 2000;100:235–349. doi: 10.1021/cr9900275. [DOI] [PubMed] [Google Scholar]
- 3.Wallar BJ, Lipscomb JD. Chem Rev. 1996;96:2625–2658. doi: 10.1021/cr9500489. [DOI] [PubMed] [Google Scholar]
- 4.Sono M, Roach MP, Coulter ED, Dawson JH. Chem Rev. 1996;96:2841–2887. doi: 10.1021/cr9500500. [DOI] [PubMed] [Google Scholar]
- 5.Krebs C, Galonic Fujimori D, Walsh CT, Bollinger JMJ. Acc Chem Res. 2007;40:484–492. doi: 10.1021/ar700066p. [DOI] [PMC free article] [PubMed] [Google Scholar]
- 6.Price JC, Barr EW, Tirupati B, Bollinger JM, Jr, Krebs C. Biochemistry. 2003;42:7497–7508. doi: 10.1021/bi030011f. [DOI] [PubMed] [Google Scholar]
- 7.Price JC, Barr EW, Glass TE, Krebs C, Bollinger JM., Jr J Am Chem Soc. 2003;125:13008–13009. doi: 10.1021/ja037400h. [DOI] [PubMed] [Google Scholar]
- 8.Riggs-Gelasco PJ, Price JC, Guyer RG, Brehm JH, Barr EW, Bollinger JM, Jr, Krebs C. J Am Chem Soc. 2004;126:8108–8109. doi: 10.1021/ja048255q. [DOI] [PubMed] [Google Scholar]
- 9.Proshlyakov DA, Henshaw TF, Monterosso GR, Ryle MJ, Hausinger RP. J Am Chem Soc. 2004;126:1022–1023. doi: 10.1021/ja039113j. [DOI] [PubMed] [Google Scholar]
- 10.Hoffart LM, Barr EW, Guyer RG, Bollinger JM, Jr, Krebs C. Proc Natl Acad Sci USA. 2006;103:14738–14743. doi: 10.1073/pnas.0604005103. [DOI] [PMC free article] [PubMed] [Google Scholar]
- 11.Galonic DO, Barr EW, Walsh CT, Bollinger JM, Jr, Krebs C. Nature Chemical Biology. 2007;3:113–116. doi: 10.1038/nchembio856. [DOI] [PubMed] [Google Scholar]
- 12.Eser BE, Barr EW, Frantom PA, Saleh L, Bollinger JM, Jr, Krebs C, Fitzpatrick PF. J Am Chem Soc. 2007;40:11334–11335. doi: 10.1021/ja074446s. [DOI] [PMC free article] [PubMed] [Google Scholar]
- 13.Galonic Fujimori D, Barr EW, Matthews ML, Koch GM, Yonce JR, Walsh CT, Bollinger JMJ, Krebs C, Riggs-Gelasco PJ. J Am Chem Soc. 2007;129:13408–13409. doi: 10.1021/ja076454e. [DOI] [PubMed] [Google Scholar]
- 14.Nam W. Acc Chem Res. 2007;40:522–531. doi: 10.1021/ar700027f. [DOI] [PubMed] [Google Scholar]
- 15.Kaizer J, Klinker EJ, Oh NY, Rohde JU, Song WJ, Stubna A, Kim J, Münck E, Nam W, Que L., Jr J Am Chem Soc. 2004;126:472–473. doi: 10.1021/ja037288n. [DOI] [PubMed] [Google Scholar]
- 16.Shan X, Que L., Jr J Inorg Biochem. 2006;100:421–433. doi: 10.1016/j.jinorgbio.2006.01.014. [DOI] [PubMed] [Google Scholar]
- 17.Que L., Jr Acc Chem Res. 2007;40:493–500. doi: 10.1021/ar700024g. [DOI] [PubMed] [Google Scholar]
- 18.Rohde JU, In JH, Lim MH, Brennessel WW, Bukowski MR, Stubna A, Münck E, Nam W, Que L., Jr Science. 2003;299:1037–1039. doi: 10.1126/science.299.5609.1037. [DOI] [PubMed] [Google Scholar]
- 19.Lim MH, Rohde JU, Stubna A, Bukowski MR, Costas M, Ho RYN, Munck E, Nam W, Que L., Jr Proc Natl Acad Sci U S A. 2003;100:3665–3670. doi: 10.1073/pnas.0636830100. [DOI] [PMC free article] [PubMed] [Google Scholar]
- 20.Balland V, Charlot MF, Banse F, Girerd JJ, Mattioli TA, Bill E, Bartoli JF, Battioni P, Mansuy D. Eur J Inorg Chem. 2004:301–308. [Google Scholar]
- 21.Klinker EJ, Kaizer J, Brennessel WW, Woodrum NL, Cramer CJ, Que L., Jr Angew Chem Int Ed. 2005;44:3690–3694. doi: 10.1002/anie.200500485. [DOI] [PubMed] [Google Scholar]
- 22.Grapperhaus CA, Mienert B, Bill E, Weyhermuller T, Wieghardt K. Inorg Chem. 2000;39:5306–5317. doi: 10.1021/ic0005238. [DOI] [PubMed] [Google Scholar]
- 23.Martinho M, Banse F, Bartoli JF, Mattioli TA, Battioni P, Horner O, Bourcier S, Girerd JJ. Inorg Chem. 2005;44:9592–9596. doi: 10.1021/ic051213y. [DOI] [PubMed] [Google Scholar]
- 24.An exception is the aqueous oxoiron(IV) complex obtained by Bakac and co-workers that has an S = 2 spin ground state. See Pestovsky O, Stoian S, Bominaar EL, Shan X, Munck E, Que L, Jr, Bakac A. Angew Chem Int Ed. 2005;44:6871–6874. doi: 10.1002/anie.200502686.
- 25.Rohde JU, Stubna A, Bominaar EL, Münck E, Nam W, Que L., Jr Inorg Chem. 2006;45:6435–6445. doi: 10.1021/ic060740u. [DOI] [PubMed] [Google Scholar]
- 26.Rohde JU, Que L., Jr Angew Chem Int Ed. 2005;44:2255–2258. doi: 10.1002/anie.200462631. [DOI] [PubMed] [Google Scholar]
- 27.Sastri CV, Lee J, Oh K, Lee YJ, Lee J, Jackson TA, Hirao H, Que L, Jr, Shaik S, Nam W. Proc Natl Acad Sci USA. 2007;104:19181–19186. doi: 10.1073/pnas.0709471104. [DOI] [PMC free article] [PubMed] [Google Scholar]
- 28.Sastri CV, Park MJ, Ohta T, Jackson TA, Stubna A, Seo MS, Lee J, Kim J, Kitagawa T, Münck E, Que L, Jr, Nam W. J Am Chem Soc. 2005;127:12494–12495. doi: 10.1021/ja0540573. [DOI] [PubMed] [Google Scholar]
- 29.TMCS is the monoanion of 1-mercaptoethyl-4,8,11-trimethyl-1,4,8,11-tetraazacyclotetradecane
- 30.Bukowski MR, Koehntop KD, Stubna A, Bominaar EL, Halfen JA, Münck E, Nam W, Que L., Jr Science. 2005;310:1000–1002. doi: 10.1126/science.1119092. [DOI] [PubMed] [Google Scholar]
- 31.Armarego WLF, Perrin DD. Purification of Laboratory Chemicals. Butterworth-Heinemann; Oxford, U.K.: 1997. [Google Scholar]
- 32.Saltzman H, Sharefkin JG. Organic Syntheses. Wiley; New York: 1973. [Google Scholar]
- 33.Scarrow RC, Maroney MJ, Palmer SM, Roe AL, Que L, Jr, Salowe SP, Stubbe J. J Am Chem Soc. 1987;109:7857–7864. [Google Scholar]
- 34.Shu L, Chiou YM, Orville AM, Miller MA, Lipscomb JD, Que L., Jr Biochemistry. 1995;34:6649–6659. doi: 10.1021/bi00020a010. [DOI] [PubMed] [Google Scholar]
- 35.Rohde JU, Torelli S, Shan X, Lim MH, Klinker EJ, Kaizer J, Chen K, Nam W, Que L., Jr J Am Chem Soc. 2004;126:16750–16761. doi: 10.1021/ja047667w. [DOI] [PubMed] [Google Scholar]
- 36.George GN. EXAFSPAK, Stanford Synchrotron Radiation Laboratory. Stanford Linear Accelerator Center; 1990. [Google Scholar]
- 37.Klinker EJ, Jackson TA, Jensen MP, Juhasz G, Münck E, Que L., Jr Angew Chem Int Ed. 2006;45:7394–7397. doi: 10.1002/anie.200602799. [DOI] [PubMed] [Google Scholar]
- 38.Scarrow RC, Trimitsis MG, Buck CP, Grove GN, Cowling RA, Nelson MJ. Biochemistry. 1994;33:15023–15035. doi: 10.1021/bi00254a011. [DOI] [PubMed] [Google Scholar]
- 39.Pestovsky O, Stoian S, Bominaar EL, Shan X, Münck E, Que L, Jr, Bakac A. Angew Chem Int Ed. 2005;44:6871–6874. doi: 10.1002/anie.200502686. [DOI] [PubMed] [Google Scholar]
- 40.te Velde G, Baerends EJ. J Comput Phys. 1992;99:84–98. [Google Scholar]
- 41.Guerra CF, Snijders JG, te Velde G, Baerends EJ. Theor Chem Acc. 1998;99:391–403. [Google Scholar]
- 42.ADF2004.01. SCM, Theoretical Chemistry, Vrije Universiteit; Amsterdam, The Netherlands: http://www.scm.com. [Google Scholar]
- 43.Vosko SH, Wilk L, Nusair M. Can J Phys. 1980;58:1200. [Google Scholar]
- 44.Becke AD. J Chem Phys. 1986;84:4524–4529. [Google Scholar]
- 45.Perdew JP. Phys Rev B. 1986;33:8822–8824. doi: 10.1103/physrevb.33.8822. [DOI] [PubMed] [Google Scholar]
- 46.Neese F. ORCA - an ab initio, Density Functional and Semiempirical Program Package, Version 25. University of Bonn; 2006. [Google Scholar]
- 47.Brunold T, Herren M, Oetliker U, Güdel HU, Kesper U, Albrecht C, Reinen D. J Lumines. 1994;60-1:138–141. [Google Scholar]
- 48.Brunold TC, Tamura N, Kitajima N, Moro-oka Y, Solomon EI. J Am Chem Soc. 1998;120:5674–5690. [Google Scholar]
- 49.Brunold TC, Gamelin DR, Stemmler TL, Mandal SK, Armstrong WH, Penner-Hahn JE, Solomon EI. J Am Chem Soc. 1998;120:8724–8738. [Google Scholar]
- 50.Bauernschmitt R, Ahlrichs R. Chem Phys Lett. 1996;256:454–464. [Google Scholar]
- 51.Casida EM, Jamorski C, Casida KC, Salahub DR. J Chem Phys. 1998;108:4439–4449. [Google Scholar]
- 52.Stratman RE, Scuseria GE, Frisch MJ. J Chem Phys. 1998;109:8218–8224. [Google Scholar]
- 53.Hirata S, Head-Gordon M. Chem Phys Lett. 1999;302:375–382. [Google Scholar]
- 54.Hirata S, Head-Gordon M. Chem Phys Lett. 1999;314:291–299. [Google Scholar]
- 55.Becke AD. J Chem Phys. 1993;98:5648–5652. [Google Scholar]
- 56.Becke AD. J Chem Phys. 1993;98:1372–1377. [Google Scholar]
- 57.Lee C, Yang W, Parr RG. Phys Rev B. 1988;37:785–789. doi: 10.1103/physrevb.37.785. [DOI] [PubMed] [Google Scholar]
- 58.Perdew JP, Burke K, Ernzerhof M. Phys Rev Lett. 1996;77:3865–3868. doi: 10.1103/PhysRevLett.77.3865. [DOI] [PubMed] [Google Scholar]
- 59.Schäfer A, Horn H, Ahlrichs R. J Chem Phys. 1992;97:2571–2577. [Google Scholar]
- 60.Laaksonen L. J Mol Graphics. 1992;10:33–34. doi: 10.1016/0263-7855(92)80007-z. [DOI] [PubMed] [Google Scholar]
- 61.Bergman DL, Laaksonen L, Laaksonen A. J Mol Graphics & Modelling. 1997;15:301–306. doi: 10.1016/s1093-3263(98)00003-5. [DOI] [PubMed] [Google Scholar]
- 62.Decker A, Rohde J-U, Que L, Jr, Solomon EI. J Am Chem Soc. 2004;126:5378–5379. doi: 10.1021/ja0498033. [DOI] [PubMed] [Google Scholar]
- 63.Decker A, Rohde J-U, Klinker EJ, Wong SD, Que L, Jr, Solomon EI. J Am Chem Soc. 2007;129:15983–15996. doi: 10.1021/ja074900s. [DOI] [PMC free article] [PubMed] [Google Scholar]
- 64.Decker A, Clay MD, Solomon EI. J Inorg Biochem. 2006;100:697–706. doi: 10.1016/j.jinorgbio.2006.01.013. [DOI] [PubMed] [Google Scholar]
- 65.Tiago de Oliveira F, Chanda A, Banerjee D, Shan X, Mondal S, Que L, Jr, Bominaar EL, Münck E, Collins TJ. Science. 2007;315:835–838. doi: 10.1126/science.1133417. [DOI] [PubMed] [Google Scholar]
- 66.Westre TE, Kennepohl P, DeWitt JG, Hedman B, Hodgson KO, Solomon EI. J Am Chem Soc. 1997;119:6297–6314. [Google Scholar]
- 67.Nam W, Choi SK, Lim MH, Rohde J-U, Kim I, Kim J, Kim C, Que L., Jr Angew Chem Int Ed. 2003;42:109–111. doi: 10.1002/anie.200390036. [DOI] [PubMed] [Google Scholar]; Wolter T, Meyer-Klaucke W, Müther M, Mandon D, Winkler H, Trautwein AX, Weiss R. J Inorg Biochem. 2000;78:117–122. doi: 10.1016/s0162-0134(99)00217-2. [DOI] [PubMed] [Google Scholar]
- 68.Chanda A, Shan X, Chakrabarti M, Ellis WC, Popescu DL, Tiago de Oliveira F, Wang D, Que L, Jr, Collins TJ, Münck E, Bominaar EL. Inorg Chem. 2008;47:3669–3678. doi: 10.1021/ic7022902. [DOI] [PMC free article] [PubMed] [Google Scholar]
- 69.Green MT, Dawson JH, Gray HB. Science. 2004;304:1653–1656. doi: 10.1126/science.1096897. [DOI] [PubMed] [Google Scholar]
- 70.Jensen MP, Costas M, Ho RYN, Kaizer J, Mairata i Payeras A, Münck E, Que L, Jr, Rohde J-U, Stubna A. J Am Chem Soc. 2005;127:10512–10525. doi: 10.1021/ja0438765. [DOI] [PubMed] [Google Scholar]
- 71.Sinnecker S, Svensen N, Barr EW, Ye S, Bollinger JM, Jr, Neese F, Krebs C. J Am Chem Soc. 2007;129:6168–6179. doi: 10.1021/ja067899q. [DOI] [PubMed] [Google Scholar]
- 72.Berry JF, Bill E, Bothe E, Neese F, Wieghardt K. J Am Chem Soc. 2006;128:13515–13528. doi: 10.1021/ja063590v. [DOI] [PubMed] [Google Scholar]
- 73.Berry JF, Bill E, Bothe E, Weyhermüller T, Wieghardt K. J Am Chem Soc. 2005;127:11550–11551. doi: 10.1021/ja052673t. [DOI] [PubMed] [Google Scholar]
- 74.Scott RA. In: Physical Methods in Bioinorganic Chemistry: Spectroscopy and Magnetism. Que L Jr, editor. University Science Books; Sausalito, CA: 2000. pp. 465–503. [Google Scholar]
- 75.Green MT. J Am Chem Soc. 2006;128:1902–1906. doi: 10.1021/ja054074s. [DOI] [PubMed] [Google Scholar]
- 76.Czarnecki K, Nimri S, Gross Z, Proniewicz LM, Kincaid JR. J Am Chem Soc. 1996;118:2929–2935. [Google Scholar]
- 77.Gold A, Jayaraj K, Doppelt P, Weiss R, Chottard G, Bill E, Ding X, Trautwein AX. J Am Chem Soc. 1988;110:5756–5761. [Google Scholar]
- 78.DFT calculations to compute Mössbauer parameters of the 1-X complexes were also undertaken. Our initial success in closely matching the calculated Mössbauer parameters for the parent 1-NCMe complex with those obtained by experiment (ref 18), as well as the success of others (refs 79 and 80), led us to anticipate that the corresponding parameters of the 1-X series could be also correctly predicted. For reasons not currently well understood, this expectation has not been borne out for 1-X complexes independent of the basis sets or functionals used for the calculations. Since DFT calculated ΔEQ values typically have an error of 0.5 mm/s and most of the complexes listed in Table 1 have small ΔEQ values, the DFT calculations yield ΔEQ and η values that are in poor agreement with the experimental values.
- 79.Neese F. J Inorg Biochem. 2006;100:716–726. doi: 10.1016/j.jinorgbio.2006.01.020. [DOI] [PubMed] [Google Scholar]
- 80.Schöneboom JC, Neese F, Thiel W. J Am Chem Soc. 2005;127:5840–5853. doi: 10.1021/ja0424732. [DOI] [PubMed] [Google Scholar]
- 81.Decker A, Solomon EI. Angew Chem Int Ed. 2005;44:2252–2255. doi: 10.1002/anie.200462182. [DOI] [PubMed] [Google Scholar]
- 82.Shaik S, Hirao H, Kumar D. Acc Chem Res. 2007;40:532–542. doi: 10.1021/ar600042c. [DOI] [PubMed] [Google Scholar]
- 83.Yamamoto S, Teraoka J, Kashiwagi H. J Chem Phys. 1988;88:303–312. [Google Scholar]
- 84.We performed similar computations using the pure BP86 functional and the results are collected in Table S12. The major trends are virtually identical to those discussed for computations using the PBE0 functional, with the exception that the MO compositions are more covalent when the BP86 functional is used.
- 85.Because the 1-NCMe complex does not have strict C4v symmetry, the FeIV dxz and dyz MOs are nondegenerate. However, for most 1-X complexes, these orbitals have very similar energies and thus will be referred to together unless otherwise noted.
- 86.Jackson TA, Yikilmaz E, Miller AF, Brunold TC. J Am Chem Soc. 2003;125:8348–8363. doi: 10.1021/ja029523s. [DOI] [PubMed] [Google Scholar]
- 87.Hirao H, Kumar D, Que L, Jr, Shaik S. J Am Chem Soc. 2006;128:8590–8606. doi: 10.1021/ja061609o. [DOI] [PubMed] [Google Scholar]
- 88.Bernasconi L, Louwerse MJ, Baerends EJ. Eur J Inorg Chem. 2007:3023–3033. [Google Scholar]
- 89.Hirao H, Que L, Jr, Nam W, Shaik S. Chem Eur J. 2008;14:1740–1756. doi: 10.1002/chem.200701739. [DOI] [PubMed] [Google Scholar]
Associated Data
This section collects any data citations, data availability statements, or supplementary materials included in this article.
Supplementary Materials
Mössbauer spectra for 1-N3 (Figure S1), Fe K-edge EXAFS data and fitting analyses for 1-X complexes (Figures S2, S3, S5 and S6; Tables S1 – S3), ESI-MS data for 1-X complexes (Figure S4), Cartesian coordinates and d-based MO compositions for all DFT energy-minimized 1-X models (Tables S4 – 12), details of TD-DFT computations and plots of predicted absorption spectra for 1-NCMe, 1-N3, 1-NCO, and 1-NCS (Figures S7 and S8; Tables S13 – 20). This material is available free of charge via the Internet at http://pubs.acs.org.