

Abstract
Because of their prominent roles in regulation of gene expression, it is important to understand how levels of Krüpple-like transcription factors SP1 and SP3 change in germ cells during spermatogenesis. Using immunological techniques we found that both factors decreased sharply during meiosis. SP3 declined during the leptotene to pachytene transition while SP1 fell somewhat later, as spermatocytes progressed beyond early pachytene. SP3 reappeared for a period in round spermatids. For Sp1 it is known that the transition to pachytene is accompanied by loss of the normal 8.2 kb mRNA and appearance of a prevalent 8.8 kb variant, which has not been well characterized. We have now shown that this pachytene-specific transcript contains a long, unspliced sequence from the first intron and that this sequence inhibits expression of a reporter, probably due to its many short open reading frames. A second testis-specific Sp1 transcript in spermatids of 2.4 kb has also been reported previously. Like the 8.8 kb variant, it is also translationally compromised. We have confirmed by Northern blotting that the 8.8, 8.2 and 2.4 kb variants account for the major testis Sp1 transcripts. Thus the unexpected decline of SP1 protein in the face of continuing Sp1 transcription is explained in large part by poor translation of both novel testis transcripts. As part of this work we also identified five additional minor Sp1 cap sites by 5′ RACE, including a trans-spliced RNA originating from the Glcci1 gene.
Keywords: SP1, SP3, spermatogenesis, transcription factor, alternative splicing, alternative promoter, meiosis, mouse, testis
INTRODUCTION
SP1 was isolated based on in vitro stimulation of transcription from the simian virus 40 early promoter, which contains 6 tandem variants of its binding site, often termed a GC box [1]. Over the intervening years SP1 became the founding member of a family of 9 related mammalian proteins that share well conserved versions of a carboxyl terminal zinc finger DNA binding domain. The mammalian genome contains at least 16 additional genes with similar zinc-finger domains that are named Krüpple-like factors (KLF) [2]. SP3 is a widely expressed relative of SP1 that binds to the same DNA motif [3]. Regulatory roles for GC boxes and SP1 or SP3 have been identified in the promoter regions of hundreds of genes. Several recent reviews serve as an introduction to this literature [3-8]. Once considered an ubiquitous transcriptional activator, SP1 is now known to be functionally modified by phosphorylation and glycosylation [9, 10] and to effect repression as well as activation, depending on the promoter environment and presence of specific coregulators. SP3 also has activating or repressing effects, depending on the context and the number of binding sites in a particular promoter [3, 6].
Spermatogenesis encompasses a series of developmental changes. Proliferating spermatogonia become spermatocytes, which undergo meiosis to produce haploid spermatids. These undergo dramatic morphological and biochemical changes to become spermatozoa [11]. In view of the common presence of GC boxes in mammalian promoters, it is important to know if SP1 and alternative factors such as SP3 are available throughout spermatogenesis. The literature is somewhat confusing on this point although the most recent studies support a marked decrease in SP1 as spermatogenesis progresses. In an early study Saffer et al. [12] reported that the large 8-9 kb Sp1 mRNA, typical of somatic tissues, declined sharply in the testis of adult mice, while a novel 2.4 kb mRNA appeared about 25 days of age and became the most prominent Northern blot band obtained from adult testis. At the same time, they reported an increase in the immunohistochemical signal for SP1 in haploid cells. Subsequently, Persengiev et al [13] reported that SP1 protein was actually rather low in testis germ cell nuclear extracts when detected by Western blotting. They confirmed loss of the standard 8.2 kb Sp1 mRNA beginning in the pachytene stage of meiosis as well as the appearance of the 2.4 kb band in late meiotic and early haploid cells. This group also made the first identification of a larger 8.8 kb Sp1 transcript during the pachytene stage of meiosis I. The 2.4 kb mRNA was shown to begin at codon 5 of the reading frame, potentially allowing in frame translational initiation at the methionine specified by the 8th codon, and to end with an extremely truncated 3′ UTR. While this extremely short transcript defines a nearly full length and functional protein, it was not associated with polysomes indicating that it was not an efficient source of SP1 protein. Recently Thomas et al. [14] reported isolation of several variant Sp1 cDNA clones of 3 to 4 kb from a pachytene cDNA library. All have truncated 3′ UTRs, and one is identical to a minor splice variant identified by Persengiev et al. [15] that lacks a transactivation domain. By immunohistochemistry they showed that SP1 reactivity was lost during meiosis.
Our interest in SP1 derives partly from study of the variant linker histone HIST1H1T, also known as H1T, which is expressed uniquely in mid pachytene spermatocytes. Like promoters of the 5 standard H1 variants, the Hist1h1t promoter has a prominent GC box that is a good binding site for SP1 and SP3 [16-20]. In view of this, we are intrigued by the possibility that SP1 is down-regulated at the point at which H1T is expressed in mid-late pachytene spermatocytes. We were therefore stimulated to make an additional study of SP1 expression during spermatogenesis, hoping to clarify the protein levels of SP1 in spermatocytes as well as the function of the spermatocyte-specific 8.8 kb Sp1 mRNA.
In work to be described, we confirmed that SP1 protein is markedly down regulated beginning in mid-pachytene and that it remains at low levels throughout the remainder of spermatogenesis. We have used 5′ RACE and RNase protection assays to identify multiple new Sp1 transcriptional start sites. Most of these are not quantitatively important. However, as cells progress through pachytene, the 5′ ends of the majority of transcripts map to a cluster of start sites lying within the first intron. Most of these transcripts connect to exon 2 without splicing and generate a long 5′ leader region that contains multiple initiation and termination codons. The result is a translationally inefficient mRNA that we have identified as the 8.8 kb variant described by Persengiev et al. [13]. We also investigated the expression of SP3 during spermatogenesis by immunohistochemistry and Western blotting. Like SP1, SP3 was found at high levels in spermatogonia. Unlike SP1, it declined immediately upon their entry into meiosis. However, unlike SP1, it emerged again at a lower level for a period during the development of round spermatids.
MATERIALS AND METHODS
Mice
C57BL/6 mice were obtained from Harlan Sprague Dawley or from a colony maintained locally. Hsd:ICR outbred mice were from Harlan Sprague-Dawley (Indianapolis, IN). The use and care of animals were approved by the University of South Carolina Animal Care and Use Committee.
Immunohistochemistry
Mouse testes were fixed in either Bouin’s fixative or 4% paraformaldehyde in phosphate buffered saline for 16 to 24 hr. Routine paraffin sections were mounted on Superfrost plus slides (Fisher, Pittsburgh, PA), rehydrated, subject to antigen retrieval, and processed as described previously [21]. Sections were blocked with 10% normal goat serum in PBS for 1 hr at room temp, and then with the primary antiserum in 5% normal goat serum, 0.1% Triton X100 (Sigma, St Louis, MO) PBS, overnight at 4°C. Rabbit polyclonal antibodies were from Santa Cruz (Santa Cruz, CA; SP1: PEP 2, sc-59x; H225, sc-14027; SP3: D-20, sc-644) used at a dilution of 1 μg/ml. Immune complexes were detected as described using Invitrogen-Zymed (Carlsbad, CA) HRP-conjugated goat anti-rabbit IgG (Cat. 81:6120, 1:300) and diaminobenzidine (Zymed, Cat. 00-2020). Some sections were counterstained with Mayer’s hematoxylin (Sigma, St Louis, MO). Images were obtained with an Olympus DP11 or DP71 digital camera mounted on an Olympus microscope.
Preparation of purified germ cells
Purified populations of late spermatocytes and round spermatids were prepared from four adult mice according to the protocol described by Heyting and Dietrich [22] with elutriation conditions modified for mouse cells [23]. Cells from elutriation were further purified by overlaying cells in 16% Percol on preformed gradients of Percol (GE Healthcare Bio-Science, Piscataway, NJ; 40 ml, 25 - 40%) and centrifugation in a JS13.1 rotor (Beckman-Coulter, Irvine, CA) at 10,000 rpm for 15 min at 20°C. Purity was estimated to be approximately 95% based on nuclear morphology after fixation with cold acetic acid:methanol (1:3) and staining with Giemsa. A mixture of type A and B spermatogonia was prepared from testes of 20 8-day-old mice. Tubules were incubated in 2 ml of DMEM/F12 medium (Invitrogen) at 32°C with 0.5 mg/ml Collagenase (Sigma) for 20 min. Tubule fragments were allowed to settle three times from 5 ml of medium, exposed to trypsin (0.5 mg/ml, Sigma) for 15 min, followed by addition of soybean trypsin inhibitor (Sigma) to make 0.5 mg/ml, and a cell suspension was generated by repeated pipeting. Cells were washed twice by centrifugation, filtered through a 50 micron nylon mesh, diluted to 10 ml in DMEM/F12 with 5% fetal bovine serum (Invitrogen-Gibco), and plated in a single 10-cm dish. Following incubation (5% CO2, 32°C) for 4 hrs, the nonadherent germ cells were removed, washed twice in PBS, and cell pellets kept at -70°C. Spermatogonia purity was estimated to be about 80% based on multiple discrete heterochromatin clumps following Giemsa staining.
RNA isolation
RNA was isolated from tissues or purified spermatogenic cells using RNeasy kits as described by the manufacturer (Qiagen, Valencia, CA), and the intact state of 18 and 28S rRNA verified prior to use of the RNA in other procedures.
5′-Rapid amplification of cDNA ends (5′-RACE)
5′-RACE was carried out using mouse testis RACE-ready cDNA from Swiss-Webster mice (Cat 3206, Ambion, Austin, TX) following the protocols supplied. Forward primers are supplied to match the adapter ligated to the 5′ end of the decapped mRNA. Reverse primers were designed for Sp1 based on the mouse genome sequence (www.ensembl.org, ENSMUSG00000001280). The outer reverse RACE primer was 5′-TGGGTGACTCAATTCTGCTG, and the nested inner primer, located within exon 3, was 5′-GCATAAGCTTAAAGGAGATGGCTGGGATTC. PCR products were purified using a QIAquick PCR purification kit (Qiagen), digested with BamHI and HindIII, and ligated to pBluescript (Stratagene). Sequencing of inserts was carried out by the USC Institute for Biological Research and Technology.
RNase protection assays and Northern Blots
RNase protection assays were carried essentially as described previously [24] using the MAXIscript kit (Ambion) to prepare probe fragments and the RPA III kit (Ambion) to carry out hybridizations and digestions. Riboprobe A was prepared from the RACE clone for exon 1S (Fig. 4) and gives a 293-bp protected fragments with transcripts that contain Sp1 exon 1S to 3 but a 181-bp protected fragment from transcripts with variant first exons. To prepare a riboprobe for the spliced and unspliced variants containing exon 1P, a 259 bp fragment was amplified from mouse genomic DNA with upstream primer 5′-GCATGGATCCCTGAGACACTGAAATTCCAAATTCCCTT and downstream primer 5′-GCATAAGCTTTGGGATGCCAAAGCCATAGACACA, followed by ligation to the BamHI and HindIII sites of pBluescript. An Actb (β-actin) probe was synthesized using the template provided by the MAXIscript kit. A typical reaction consisted of 10 μg of total RNA, 80,000 cpm of Sp1 probe, 40,000 cpm of Actb probe, and was incubated overnight at 42°C. Following RNase A and T1 digestion, protected products were resolved on a 5% polyacrylamide-8M urea gel. The gel was then dried and exposed to Kodak Bio-Max film overnight. Northern blots were done as previously described [24] using salmon sperm DNA in the blocking mixture and probes labeled by random priming.
FIG. 4.

Sp1 transcriptional start sites. At the top the exon complement of the standard Sp1 transcript is diagrammed. Solid rectangles indicate standard exons, with the thicker regions indicating protein-coding sequences. Novel 1st exons are empty rectangles. Exons are approximately to scale, but introns (thin line) are not. The binding regions of the three commercial antibodies used are indicated at the very top. The zinc finger (ZF) domain in exons 5 and 6 is indicated. Transcriptional start sites at or upstream of exon 2 are indicated below on an expanded scale. Nucleotide numbering is based on the mouse Feb 2006 genome assembly and relative to the first nt of exon 2, which is assigned +1. Diagonal numbers above the sequence diagrams indicate distances relative to exon 2. Numbers next to arrowheads below the diagrams designate PCR primers (Supplement Table 1). Asterisks mark transcriptional starts identified in this work. Transcriptional starts are organized into two groups according to their expression level (Major and Minor). The size of each of the major transcripts is indicated as detected by Northern blots. Exon 1S is the classic first exon. Sequences for sequences identified here have been submitted to GeneBank with the following Accession numbers: 1A - EF200003, 1B - EF200004, - EF200005, 1D - EF200006, 2ext (extended) - EF200009. Exon 1C is from database EST clone BY738990 derived from a 17 days pregnant mouse amnion. Exon 1P constitutes a family of initiation sites extending over about 230 nt and is derived from experimental results described here rather than from a RACE clone. Exon 2int (internal) designates the 2.4 kb spermatid transcript described in Persengiev et al [13]. The trans-spliced clone (Glcci1-Sp1, Accession in progress) includes the first two exons of the Glcci1 gene from chromosome 6 fused through a standard splice junction to exon 2 of Sp1 on chromosome 15.
Reverse transcriptase PCR and Real-Time PCR
Total RNA, 1 μg, was primed with either random hexamers or oligo(dT) and reverse transcribed using Superscript III First-Strand Synthesis kit (Invitrogen), following the manufacturer’s directions. cDNA was diluted 1:10, and 1 μl was used in each 50 μl conventional PCR reaction or 0.5 μl in 25 μl real-time PCR reactions. Primers used for real time PCR are listed in Supplemental Table 1. Primers were designed using the Primer3 program (http://frodo.wi.mit.edu/cgi-bin/primer3/primer3_www.cgi or a program at the supplier’s web site, and synthesized by Integrated DNA Technologies (Coralville, IA). Real time PCR was performed in an iCycler (Bio-Rad, Hercules, CA) with 43 thermal cycles of 30 s Denaturation at 95°C, 30 s annealing at 60°C and 30 s elongation at 72°C. The reactions were set up in final volumes of 25 μl containing 0.5 μl of 1:10 diluted cDNA, 5 pmol of each primer, 12.5 μl of SYBR Green real time master mix (Bio-Rad) and dist water to volume. In practice master reaction mixes were set up for each cDNA source so that cDNA concentration did not vary among tubes. Amplifications were repeated in triplicate on separate occasions. In each experiment particular mRNAs were chosen as references as indicted in the Figures, and their threshold cycle values (Ct) are indicated. The amounts of other mRNAs were calculated relative to these references from the differences in Ct [25].
Western blotting
Tissues or cell pellets were homogenized in 4 vol 50 mM sodium phosphate, pH 7.8 containing a protease inhibitor mixture (P-8340, Sigma) and immediately diluted with an equal volume of hot SDS sample buffer (50 mM sodium phosphate, pH 7.8, 200 mM 2-mercaptoethanol, 4% SDS, 20% glycerol) and heated in a boiling water bath for 3 min. Upon cooling, viscosity was eliminated by brief sonication. Protein was estimated using the Pierce (Rockford, IL) BCA reagent. Samples were resolved on a 10% polyacrylamide gel run as described [21]. The primary antibody was PEP2 used at a final dilution of 0.5 μg/ml. In some blots the primary antibody was Bethyl BL939 (Bethyl Laboratories, Montgomery, TX).
Mutagenesis and transient transfection analysis
Exon 1S and both the spliced and unspliced variants of exons1P to 2 were fused in frame to the luciferase gene in pGL3 (Promega, Madison, WI) using standard cloning techniques. The 5′ end of the 1P exon was 146 bp upstream of the 1P splice donor site. A version of the unspliced variant was made in which an EcoRI site was introduced to disrupt the splice donor site using overlap PCR mutagenesis. All constructs were verified by sequencing. Transient transfection of NIH3T3 cells and luciferase assays were carried out as described previously using Renilla luciferase as transfection efficiency control and the Promega dual luciferase assay kit [26].
RESULTS
SP1 immunoreactivity is lost as mouse spermatogenic cells progress through the pachytene stage of meiosis
We used immunohistochemistry to determine SP1 expression with the PEP2 antibody, which recognizes an epitope at the downstream end of exon 3 (Fig. 4), and should identify functional proteins encoded by known splice variants [13, 15]. Identical results were obtained with the H-225 antibody, which is directed to an epitope located at a different location within exon 3 (Fig. 4) (results not shown).
Within seminiferous tubules strong nuclear staining of germ cells was obtained over only the cells lying along the outer rim, although many somatic cells found outside the tubules were also stained (Fig. 1, A). The outermost layer of cells within tubules of the adult testis has the greatest diversity. Depending on the stage of the cycle, it may contain the relatively scarce stem cell spermatogonia, several generations of spermatogonia committed to differentiation, cells in the leptotene to early pachytene phase of meiosis, and also nuclei of the non-germinal Sertoli cells [27, 28]. All of these nuclei stained positively for SP1 (Fig. 1).
FIG. 1.

Immunohistochemical location of SP1 in mouse testis cross-sections. A) low power view without counterstain shows general reactivity over outermost ring of cells within tubules. Bar = 100 μm. B) Stage I-II. The outer layer of germ cells is composed of prevalent early pachytene spermatocytes (^) and less frequent type A spermatogonia (arrowhead). Sertoli cell nuclei (*) are immuno-positive here and in subsequent sections. Bar = 25 μm for this and remaining panels. C) Stage IV-VI. Most pachytene spermatocytes (arrow) have moved inward from the basal membrane and are approaching background immunoreactivity. Intermediate or Type B spermatogonia (arrowhead) are immunopositive. A peritubular cell nucleus is immuno-positive (*). (The light immuno stain over round spermatids was not found with a subsequent lot of this same antibody or with the H-225 antibody). D) Stage VII-VIII. Leptotene spermatocyte nuclei (^) stain darkly; Sertoli cell nuclei (*) have pronounced staining. Large pachytene nuclei are negative (arrow). E) Stage IX. Leptotene cells stain darkly (^) while late pachytene spermatocytes are negative (arrow). F) Stage XII. This stage is identified by immuno negative spermatocytes undergoing the first meiotic division (arrow). Early pachytene spermatocytes remain strongly positive (^). Peritubular nuclei are strongly positive (•). As in all other tubule stages, Sertoli cell nuclei are positively stained (*). Control sections incubated without the anti-SP1 had no positive diaminobenzidine reaction.
Tracing expression through the stages, spermatogonia and early pachytene spermatocytes as well as Sertoli cell nuclei were immuno-positive for SP1 in a Stage I-II tubule (Fig. 1, B). In a stage IV-V tubule, spermatogonia and Sertoli nuclei were stained, but the maturing pachytene nuclei were stained much more weakly or not at all (Fig 1, C). (The weak, uniform immuno reactivity seen throughout the nuclei and cytoplasm of early round spermatids in these tubules was not reproduced by a subsequent lot of the same antisera nor by the H-225 antibody and is taken to be non-specific.) At stage VII-VIII (Fig. 1, D) the outermost layer of germ cells is composed largely of leptotene spermatocytes, which stained strongly. At stage IX the peripheral leptotene spermatocytes stained strongly while the adjacent large, late pachytene nuclei were negative (Fig. 1, E). At stage XII, identified by immuno-negative, dividing meiotic cells (Fig. 1, F), spermatogonia and late zygotene/early pachytene cells were all stained, as were Sertoli cell nuclei. Wherever they are seen, the elongated nuclei of peritubular cells were also strongly stained, regardless of the stage of the cycle, (Fig. 1, F). Many nuclei of somatic cells lying outside the tubules were also immuno-positive.
We were curious to see if a similar loss of SP1 occurred in other cases where stem cells give rise to a differentiating, non-mitotic epithelium. When identical immunohistochemical procedures were applied to cross-sections of mouse colon or small intestine [29], there was no striking loss of SP1 as occurred in the germinal epithelium of the testis (results not shown).
Western blotting confirms the pattern of SP1 expression observed histochemically
To confirm that loss of SP1 by IHC was not due to some manner of changing chromatin environment, we carried out a set of Western blots. During sexual development in the mouse the first group of spermatogenic cells differentiates as a nearly synchronous wave that has been well characterized [30, 31]. In extracts taken from developing mice, SP1 immuno reactivity was strongest from the youngest animals, in which only somatic cells and spermatogonia were present (Fig. 2, A). With increasing age, a steady decline in SP1 reactivity occurred, with the lowest level seen for the adult testis, in which advanced spermatocytes and spermatids make up the largest fraction of germ cells. We also prepared substantially enriched populations of mixed spermatogonia, late pachytene spermatocytes, and round spermatids. Extracts from these cell populations were compared to whole tissue extracts of adult testis and kidney (Fig. 2, B). The spermatogonia were most enriched for SP1, whereas this protein was very greatly reduced in the extract from spermatocytes, and almost undetectable at the exposure shown with round spermatids. Since late pachytene spermatocytes are slightly contaminated with earlier spermatocytes and a few somatic cells, the SP1 detected may be contributed partly from those sources. A strong band was obtained from the kidney extract, as expected. The loss of SP1 with testis development seen in Fig 2, A was confirmed with a second antibody raised to a determinant just C-terminal to the zinc finger domain (Fig. 4, Bethyl Laboratories 939), making it unlikely that loss of reactivity was due to a covalent modification to the PEP2 antigenic determinant (results not shown).
FIG. 2.

Variations in SP1 analyzed by Western blots. A) whole-testis extracts prepared from mice of different ages. Actin served as a loading control. B) Extracts from purified testis germ cell populations consisting largely of mixed A and B spermatogonia, late pachytene spermatocytes, or round spermatids, flanked by extracts from whole adult testis or kidney. In this gel the whole testis extract was twice the protein (100 μg) of the other lanes (50 μg).
RNase protection assays suggest that loss of SP1 protein is accompanied by appearance of novel splice variants
We next used RNase protection assays to assess prevalence of classic Sp1 mRNA. A 293 nt protected fragment generated from exons 1, 2 and the upstream end of exon 3 was obtained with RNA from testis as well as a variety of somatic organs (Fig. 3, A). However, testis RNA alone generated a prominent 181 nt protected fragment (Fig. 3, A) that would result from probe hybridization to an mRNA lacking the normal exon 1. Applying the same assay to RNA isolated from testes at different stages of development and from late pachytene spermatocytes and round spermatids, we observed that the 293 nt band was enriched in immature testes but was much less abundant in spermatocytes and spermatids (Fig. 3, B). The 181 nt protected band generated by exons 2-3 showed the opposite expression pattern. Seen at low levels in the 11-day testis, it rose with development, and was also prominent in late spermatocytes, but missing or very faint in brain (Fig. 3, B). These results indicate that the standard Sp1 mRNA declined more or less in concert with the disappearance of immunologically detected SP1 protein. At the same time, a new Sp1 mRNA appeared in which classic exon 1 was missing. This mRNA could derive from a transcript with a novel first exon, from a splice variant that retained part of intron 1, or from the 2.4 kb testis-specific mRNA that initiates just inside of exon 2.
FIG. 3.

RNase protection assays for Sp1 mRNA. The Sp1 probe A fragment is diagrammed above, indicating the regions of exons 1, 2 and 3 (293 nt in all) that are protected by the classic 5′ end of Sp1 mRNA. A shorter fragment of 181 nt is protected by just the exon 2-3 mRNA segment. A) RNA from a selection of organs. The undigested Sp1 probe is shown at the far left (<) and the undigested actin probe at the far right (>). (In this experiment RNase digestion conditions were not quite adequate to destroy completely the Actb probe, traces of which are seen just above the 293-nt Sp1 protected band [arrow].) The 181-nt band produced when exon 1 is not joined to exon 2 is seen only in the testis sample (asterisk). B) RNA from developing testes and from purified late pachytene spermatocytes and round spermatids. Undigested probes are in the outside flanking lanes as for A), except that in this case a somewhat longer actin probe was synthesized, which is completely digested in the assay lanes. The 181-nt band generated by exon 2 in the absence of exon 1 is prominent in 19-day and adult testis and in both purified cell populations. A longer exposure of the gel in the region of the 293 nt band is shown at the top.
Identification of novel transcriptional start sites and first exons by 5′ RACE
We next screened for novel transcriptional start sites using 5′ RACE. Electrophoretic analysis of the RACE products produced a series of bands in the 200 to 500 nt size range with a fainter smear at larger lengths (not shown). Bands were cloned and sequenced. We identified 4 additional cap sites for Sp1 mRNA as well as an example of trans-splicing. These and other transcriptional start sites to be discussed are diagrammed in Fig. 4. For clarity these are grouped according to prevalence.
Real time RT-PCR (using primer pairs indicated in Fig. 4) indicated that the only novel cap sites of quantitative significance were 1D and 2ext. However, the major product amplified for exon 1D was larger than expected, and its sequence identified an unspliced transcript containing the entire intron between exons 1D and 2. This unspliced RNA would also provide a template for primers intended to be specific to cap site 2ext (Fig. 4). In fact, as discussed below, it appears likely that most mid-late pachytene transcripts originate upstream of 1D in the region designated 1P (Fig. 4) and retain the remaining part of intron 1.
The majority of pachytene transcripts contain the intron region between exons 1C and 1D, and these account for the testis-specific 8.8 kb Sp1 transcript
Since no RACE clone was obtained for an unspliced transcript beginning at exon 1D, we considered the possibility that most transcripts originated yet farther upstream, perhaps generating the faint smear of longer RACE products observed. To investigate this possibility we carried out RT-PCR using forward primers that moved upstream through the intron in approximately 100 bp steps until reaching exon 1C (Fig. 5, A). Each forward primer between the 3′ end of exons 1D and 1C gave rise to two bands, one generated from unspliced transcripts and one from use of the exon 1D splice donor site. When the upstream primer was moved upstream of the 1C splice donor site, the only product reflected use of an alternate 1C splice donor site (as found in human testis cDNA clone BC043224). Thus, both spliced and unspliced transcripts were identified across virtually the entire intron region between exons 1C and 1D.
FIG. 5.

The 8.8 kb pachytene transcript results from initiation in the first intron and retention of intron sequences. A) Demonstration of Sp1 transcripts initiated between exons 1C and 1D by reverse transcriptase-dependent PCR. Forward primers were paired with a reverse primer located within exon 2 as indicated by the diagram at the top. All forward primers located between the splice donor sites of exons 1C and 1D produced fragments corresponding to both spliced and unspliced transcripts. Transcripts originating upstream of the 1C splice donor site are completely spliced. PCR reactions were run for 40 cycles. B) RNase protection assay for the spliced and unspliced variants including exon 1D. The probe and the regions protected by both the spliced (133 nt) and the unspliced (259 nt) transcript are diagrammed at the top. The undigested probe is in the lane at the far left (<). Expected locations of the 259 nt and 133 nt protected bands are indicated. C) Northern blot analysis of Sp1 transcripts in total RNA from Testis and Kidney. Probe locations are diagrammed at the top. The exon 3 probe was designed to react with transcripts for standard Sp1 as well as the minor splice variant that lacks the upstream part of exon 3 and has been detected only in certain somatic tissues [15]. A single gel was run and blotted to a nylon membrane. The membrane was cut into three sections, each of which was hybridized separately to one of the three probes. After washing, the three sections were aligned and exposed to X-ray film together for 2 days. Following the initial exposure, the membrane was rehybridized to an Actb probe, which identifies the novel testis 1.5 kb band (71) in addition to the usual 2.1 kb transcript. D) Real-time PCR analysis of the prevalence of transcripts beginning with exon 1S and 1P in purified germ cell fractions. Top panel: relative levels of Sp1 transcripts beginning with exon 1S and 1P are shown. Each is expressed relative to the threshold (Ct) of a fragment amplified from the zinc finger domain of Sp1 in the spermatocyte sample (100 = Ct 25.1 ± 0.7, n=4). Middle panel: Controls to confirm the substantial purity of the cell fractions. Sox3, Hist1h1t, and Tnp1 transcripts are greatly enhanced or unique to early spermatogonia, pachytene spermatocytes, or round spermatids, respectively. The threshold cycle for each in its dominant cell fraction was defined as 100, and levels in other fractions are expressed relative to that Ct. The Ct in the dominant fraction is given for each transcript. Bottom panel: The maximum Ct for Atp5a1 in the spermatocyte sample was defined as 100, and expression in other cell fractions is given relative to that Ct. Error bars: +/- SEM.
The results presented above suggested that most novel transcripts originated somewhere downstream of exon 1C. However, application of RNase protection or primer extension assays failed to locate a single major start site in this region. Instead both procedures produced a range of fragments compatible with a distribution of cap sites downstream of 1C, with most at least 200 bp upstream of 1D (results not shown). In the absence of a RACE clone it is possible that the actual cap site occurs at an unknown location upstream, with splicing to a site downstream of 1C. However, since the only good splice acceptor appears to lie at the start of exon 2, we conclude that most transcripts originate downstream of exon 1C in the region designated 1P (Fig. 4).
The band intensities from RT-PCR (Fig. 5, A) suggest that spliced transcripts from 1P are readily detected. However, endpoint PCR may favor accumulation of shorter products. To better estimate the prevalence of spliced products, we carried out RNase protection with a probe that overlaps the 1P splice donor region and adjacent intron sequences (Fig. 5, B). With total testis RNA, the only prominent band (259 nt) corresponds to an unspliced 1P transcript. The 133 nt band expected for spliced variants was detected faintly if at all. As expected, liver RNA did not lead to protection of any bands for this probe. We conclude that the exon 1P/1D splice donor site is rarely used.
We next tested the possibility that unspliced transcripts from 1P generate the 8.8 kb mRNA identified in pachytene cells by Persengiev et al [13]. We performed a Northern blot of testis and kidney RNA, using probes for exon 3 (to detect all major transcripts), as well as two different regions of intron 1 (Fig. 5, C). The exon 3 probe reacted with comparable intensity to the known 8.8, 8.2, and 2.4 kb transcripts in testis, but identified only the classic 8.2 kb transcript in kidney. Both intron 1 probes reacted strongly with the 8.8 kb band in testis confirming that intron 1 sequences do account for the greater length of this variant. Neither intron probe hybridized to the 8.2 or 2.4 kb bands. This Northern blot also shows that the 8.8, 8.2, and 2.4 kb bands are the only major transcripts in mouse testis, confirming the results of Persengiev et al [13].
Estimation of the relative contribution of the 1S and 1P start sites in purified cell populations
We used real-time PCR to confirm the relative levels of transcripts from the 1S and 1P start sites in purified spermatogonia, pachytene spermatocytes and round spermatids. Transcripts expressed predominantly in each cell population served as controls for cell purity (Fig. 5, D, middle panel). Thus, Sox3 [34] was expressed maximally in spermatogonia, with the low levels found in spermatocytes and spermatids likely due to slight spermatogonial contamination. Hist1h1t mRNA [35, 36] was present in spermatocytes, but only in trace amounts in spermatogonia or spermatids. Finally, Tnp1 mRNA [37] was present in round spermatids but virtually undetectable in the other germ cells. Expression of mRNA for mitochondrial ATPase subunit 5α is reported to be relatively constant during testis development with a slight decrease in spermatids [38-40]. Atp5a1 levels were indeed comparable in spermatogonia and spermatocytes, but were reduced in round spermatids (Fig. 5, D, bottom panel). Results for these four transcripts confirm that these procedures yield quantitatively useful estimates of RNA expression.
In this case of Sp1 variants (Fig. 5, D, top panel), mRNA levels were normalized to the threshold obtained in spermatocytes for a primer pair lying in the zinc finger domain of the Sp1 mRNA. In full agreement with earlier results, transcript 1S was most prevalent in spermatogonia, dropped to 1/5 this level in spermatocytes, and to one tenth in spermatids. In contrast, 1P transcripts were present at only trace levels in spermatogonia, but were the dominant transcripts in spermatocytes, then decreasing to about 1/5 that level in spermatids. In light of the detection of Sox3 transcripts in the round spermatid fraction, it may be that some of the 1S transcripts detected derived from spermatogonial contamination.
Accordingly real time measurements confirm that there is dramatic switch in the use of transcriptional start sites as cells differentiate from spermatogonia to late spermatocytes.
Why is SP1 protein produced inefficiently from transcripts originating at exon 1P?
We have shown that the prominent testis-specific 8.8 kb transcript of mid to late pachytene spermatocytes contains intron 1 sequences and probably originates from the 1P transcriptional start region. Why does appearance of this transcript correlate with loss of immunoreactive SP1? A likely explanation is that the retained intron results in poor translation. By the usual scanning model for initiation, ribosomes would have to traverse between five and nine short upstream reading frames (Fig. 6, A) to arrive at the start of the Sp1 reading frame in exon 2. For transcripts that initiate in the upstream half of 1P, at least three short open reading frames will be present even in spliced transcripts. We tested this hypothesis by fusing various Sp1 5′ UTRs via possible Sp1 start codons to a luciferase reporter. For exon 1S the fusion was at the normal start codon within 1S. For 1P the fusion site lay at the first in frame methionine of exon 2. Preliminary experiments indicated that mouse NIH3T3 fibroblasts effectively excise the exon 1P/D - 2 intron (results not shown). We therefore made a second construct in which we mutated the 1P/1D donor site by converting it to an EcoRI restriction site. When this construct was tested by transient transfection, luciferase activity was reduced approximately 10 fold (Fig. 6, B, C), while the spliced version was about half as active as exon 1S. Note that these constructs had rather short segments of the 1P exon and so lacked any of the 4 open reading frames upstream of the splice donor site (Fig. 6 A). Most 1P transcripts would have even more upstream open reading frames.
FIG. 6.

The 5′ UTR region of the 8.8 kb mRNA contains multiple short open reading frames, and inhibits expression of a luciferase reporter. A) Diagram of the initiation and stop codons found in all three reading frames upstream of exon 2 in the unspliced transcripts initiated in the 1P region. Start codons are indicated as triangles and stop codons as hexagons. For clarity, not all stop codons are indicated. Reading frame 1 leads to expression of the correct codons in exon 2, beginning at the second methionine of the standard somatic variant of Sp1. An asterisk above reading frame 1 indicates the 5′ ends of the 1P UTR regions fused to the luciferase reporter. C) Effect of different Sp1 5′ UTR regions on luciferase activity following transient transfection of plasmids in NIH3T3 cells. The constructs are diagrammed above (B). Activity is expressed as the Luciferase to Renilla luciferase ratio. Error bars: +/- SD.
SP3 also declines as spermatogenesis proceeds, though with slightly different kinetics
SP3 is a widely expressed member of the SP family that may act positively or negatively at GC promoter elements depending on context [3]. Immunohistochemical investigation again showed the most prominently labeled cells to be located around tubule edges. Closer examination revealed significant differences between the reactivity of SP1 and SP3 (Fig. 7). The brown immuno reaction product was found prominently over spermatogonia at all tubule stages. However, unlike SP1, the immunoreaction was lost as cells passed the leptotene phase of meiosis (compare stage VII, Fig. 7, C and stage X, Fig. 7, D). SP3 was not seen in zygotene and early pachytene spermatocytes, although SP1 was readily detected (compare Fig. 7, A & E with Fig. 1, B & F). Interestingly, weaker nuclear immunoreactivity for SP3 developed again in round spermatids, peaking approximately in the round spermatids of a stage IV-V tubule (Fig. 7, B). However, by stage VII, reactivity in round spermatids was greatly reduced or lost (Fig. 7, C). As with SP1, peritubular and Sertoli cells were positively stained, the intensity in the later perhaps varying with the stage of the tubule. As with SP1, many somatic cells located outside the tubules were stained positively for SP3.
FIG. 7.
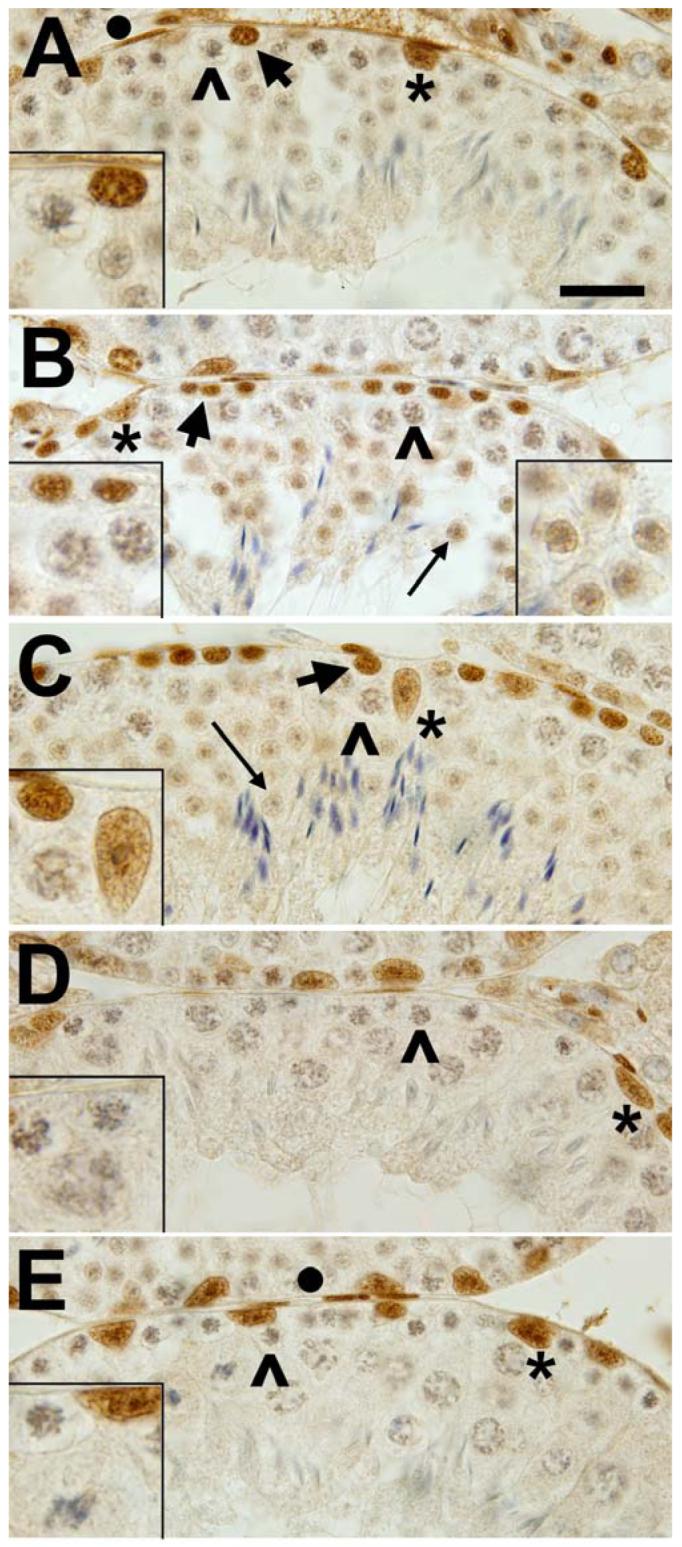
Immunohistochemical location of SP3 in mouse testis cross-sections. A) Stage I-II. Type A spermatogonia (arrow) and Sertoli cell nuclei (*) are are immuno-positive while early pachytene spermatocytes (^) are negative. Bar equals 20 microns with remaining panels at same magnification. Insert, early pachytene spermatocyte, type A spermatogonium and round spermatid. B) Stage IV-V. Type B spermatogonia (thick arrow) are positive while pachytene spermatocytes (^) are negative. Round spermatids (thin arrow) are weakly immuno-positive. Left insert, spermatogonia and pachytene spermatocytes. Right insert, round spermatids. C) Stage VII. Resting spermatocytes are immuno-positive (thick arrow). Pachytene spermatocytes (^) are negative. Round spermatids (thin arrow) are barely above background staining level. Sertoli cell nuclei are positive (*). Insert, resting spermatocytes, Sertoli cell, pachytene spermatocyte. D) Stage X. Late leptotene or early zygotene spermatocytes are immuno-negative (^). Sertoli nuclei are positive (*). Insert, early zygotene spermatocytes, late pachytene spermatocyte. E) stage XII. Early pachytene nuclei are negative (^) as are the large nuclei of diplotene spermatocytes. Sertoli nuclei are darkly stained (*). Insert, early pachytene spermatocytes, Sertoli cell, dividing primary spermatocyte. Control sections incubated without the anti-SP3 had no positive diaminobenzidine reaction.
We then used Western blotting to confirm the SP3 expression pattern. SP3 gives rise to a complex series of Western blot bands due to a combination of multiple translational initiation sites as well as the presence of SUMOylated derivatives [41]. Using purified populations of cells as described earlier, spermatogonia gave the most intense SP3 bands (Fig. 8). The SP3 bands were greatly reduced in spermatocytes and in round spermatids. Thus while total testis extracts had levels of SP3 bands comparable to liver and kidney, the presence of the protein was very unevenly distributed among purified cell populations. The results of the Western blots were in good agreement with the immunohistochemistry, although it is possible that slight contamination of the purified cell populations with somatic cells may have exaggerated the concentration of SP3 in the spermatocyte extract.
FIG. 8.

SP3 Western blot of whole organ or isolated spermatogenic cell extracts. The complex pattern of SP3-reactive bands result form the 4 translational initiation sites found on the major SP3 transcript and are identified as described by Sapetschnig et al. [41]. SP3l: long translation product, SP3s: short translation product, SUMO: sumoylated variants of the long translation products. Equal amounts of protein were loaded in each lane.
To emphasize differences in the immunohistochemical detection of SP1 and SP3 in spermatocytes and spermatids, we have plotted an approximate comparison of the changes of these two transcription factors during spermatogenesis (Fig. 9).
FIG. 9.

A diagram of the approximate levels of SP1 and SP3 in germ cells during the process of spermatogenesis in the mouse based on immunohistochemistry. The intent is to emphasize differences in the temporal expression of SP1 and SP3 proteins as detected from immunohistochemistry. Failure to detect either factor in this way does not necessarily imply that the cells are completely devoid of functional protein.
DISCUSSION
In the current study we have compared the levels of transcription factors SP1 and SP3 in germs cells throughout spermatogenesis. In the case of SP1, to understand how its declining levels correlate to the various testis-specific transcripts known, we undertook a detailed investigation of the transcriptional origins of testis transcripts, with particular reference to the incompletely characterized 8.8 kb transcript of pachytene spermatocytes.
Both of these GC box-binding factors were present at high levels in spermatogonia and early (leptotene) spermatocytes. SP3 declined sharply by zygotene but reappeared at lower levels midway in the development of round spermatids. SP1 did not show decline until the mid-pachytene phase of meiosis, and did not reappear in spermatids. Persengiev et al. [13] earlier showed that two major changes occurred in Sp1 mRNA during spermatogenesis. The normal Sp1 transcript of 8.2 kb, notable for its extremely long 3′ UTR of about 5.4 kb, was replaced during pachytene by an even longer transcript of 8.8 kb. Late in meiosis a much smaller 2.4 kb variant appeared, which was the only significant transcript present in round spermatids. RACE analysis showed that the 2.4 kb variant was pared down to essentially just the coding sequence at both ends. This short transcript was non-polysomal and apparently not a significant source of SP1 synthesis, perhaps because of its very short 5′ UTR [42]. The transcriptional origin and functional character of the 8.8 kb transcript were not investigated.
Our initial approach to characterize the origin of testis Sp1 transcripts was to carry out a 5′ RACE analysis. This study identified 4 new cap sites as well as an example of trans-splicing between exon 2 of the Glcci1 gene on chromosome 6 and Sp1 exon 2 (transcribed from chromosome 15). However, based on real time PCR analysis, the only prevalent member of these new variants appeared to originate within intron 1 at exon 1D (Fig. 4). Subsequent analysis showed that exon 1D was usually just a part of longer transcripts that originated farther upstream (in the 1P region, Fig. 4) and that joined to exon2 without splicing. In particular, Northern blot analysis showed unambiguously that the 8.8 kb transcript alone contained intron sequences between the 1P region and exon 2. Primer extension and RNase protection failed to identify a single start site within the 1P region and suggested that multiple initiation points exit between 650 and 900 bp upstream of exon 2. However, since no RACE clones were obtained for these start sites, it remains formally possible that initiation occurs even farther upstream. The retained intron sequence in the 8.8 kb mRNA introduces multiple upstream open reading frames that must be negotiated to reach the correct Sp1 codons beginning in exon 2. Transfection studies showed that this long leader sequence severely suppressed expression of a fused luciferase reporter, but only when the exon 1D splice donor site in the intron was mutated. The simplest interpretation of this result is that the long 5′ UTR of the 8.8 kb pachytene transcript is translationally inhibitory due to the presence of multiple upstream reading frames [43], although it is possible that specific translational regulation [44, 45] is also involved. This inhibitory UTR thus resolves the apparent conflict between the appearance of the prevalent 8.8 kb transcript in pachytene and the loss of SP1 protein.
Many genes are expressed specifically during meiosis, and in spermatocytes in particular (reviewed in 46). From the down regulation of SP1 and SP3 that occurs between zygotene and mid-pachytene one might expect that classic GC boxes would be missing from promoters expressed prominently in pachytene. In fact GC boxes are regular features of the proximal promoters of genes such as Hist1h1t (17, 47, 48), Hspa2 (49), Pgk2 (50), Pdha2 (51), Ldhc (52), and Gtf2a1l (53). In general these are upregulated in early pachytene, though HIST1H1T is readily detected only by mid to late pachytene (35, 36). However, trace amounts of mRNA for most of these genes have been identified in immature mice prior to the first appearance of pachytene cells (54-58). Thus initial rounds of transcription occur at stages when SP1 and perhaps SP3 are present at high levels. An obvious question is how continued transcription of these genes is maintained after levels of SP1 and SP3 show marked decline. Perhaps these factors are more important in the initial recruitment of the transcription apparatus than in the maintenance of active expression. Alternatively, once active promoter complexes and chromatin modifications are established, these complexes might have much higher affinity for SP1/SP3 and so retain the relevant protein despite its declining concentration. Finally, new pachytene-induced factors might substitute for the SP proteins, or the various changes that occur to the basal transcription machinery during meiosis (59) might reduce their importance. The in vivo presence of factors on promoters can be studied by chromatin immunoprecipitation assays. In a recent publication, Yoshioka et al. [60] reported that SP3, but not SP1, was associated with the Pgk2 GC box in vivo throughout Pgk2 expression in spermatocytes and spermatids. While the increase in Pgk2 expression that occurs in round spermatids correlates favorably with the slight increase of SP3 that occurs during this period (Fig. 7, B), retention of SP3 on the promoter throughout pachytene supports selective retention on an active gene. Confirming the importance of the GC box in the Ldhc promoter, Tang et al. (61) reported recently that a mutation to this element in an 88-bp promoter fragment reduced expression of a reporter significantly in transgenic mice and also following in vivo testis electroporation.
Gene expression in the male germ line is well-known for use of alternative promoters and alternative splicing patterns [32]. In this regard the Dnmt1 and Dnmt3l genes (for DNA methyltransferses 1 and 3L) are interesting comparisons for Sp1. In both cases transcription shifts during pachytene to downstream, testis-specific start sites that give rise to translationally compromised mRNAs [62, 63]. Other examples in which novel promoters are used in late meiosis or in haploid cells to produce new transcripts that are translationally ineffective include Sod1 (super oxide dismutase 1) [64], Cycs (cytochrome c) [65] and Penk1 (preproenkephalin 1) [66]
An interesting question is whether some functional linkage exists between the down-regulation of the Sp1 1S cap site and the up-regulation of the 1P (for the 8.8 kb) or 2int (for the 2.4 kb mRNA) cap sites. For example, would activation of the downstream promoter automatically tend to suppress upstream initiation? Recent studies of gene expression in cultured cells suggest that almost a third of genes identified with focal reinitiating complexes have two such sites [67]. It appears that an active downstream promoter does not necessarily compromise an upstream counterpart.
While the role of SP1 in regulation of promoters has received much attention, the transcriptional regulation of Sp1 itself has received rather little. Nicolas et al. [68] identified functional binding sites for SP1 itself, SP3, E2F and NF-Y in the proximal Sp1 promoter. In addition, the Sp1 promoter has overlapping binding sites for SP1 and KLF4, which has been suggested to repress Sp1 expression [69]. Testis has relatively elevated KLF4 expression, with spermatids having the highest levels among germ cells [70]. While it is worth considering that KLF4 plays a role in silencing the 1S promoter, this is difficult to reconcile with the fact that KLF4 is also expressed in Sertoli cells [70], which demonstrate robust Sp1 expression (Fig. 1).
Thomas et al. [14] concluded that a 3.7 kb mRNA is a major Sp1 transcript in mouse spermatocytes. Our Northern blot (Fig. 5, C) indicated that the 8.8, 8.2, and 2.4 kb bands are the only testis variants readily detected, confirming the study by Persengiev et al. [13]. An explanation for the 3.7 kb band [13] may derive from internal annealing sites within the classic mouse Sp1 8.2 transcript for the primers used at both 5′ and 3′ ends of their PCR-based cloning and reverse Northern blot protocols (a C-rich sequence 60 bp upstream of the ATG codon and a run of 14 A’s 1,324 bp downstream of the stop codon). Using an antibody raised to a peptide defined by amino acids 123 to 138, this group detected a prominent 60 kDa testis version of SP1 on Western blots. Our antibodies did not react with this variant.
GC boxes clearly have important roles in gene expression during spermatogenesis. Understanding the functional implications of changes in SP1 and SP3 levels during spermatogenesis will need to await the application of methods that examine in vivo promoter occupancy to many other genes and perhaps use of conditional knockouts to eliminate their expression at specific stages.
Supplementary Material
ACKNOWLEDGMENTS
We would like to thank Lynette Washington and Regina York for assistance in DNA sequencing and Frank Berger for use of the microscope facilities funded by grant 5P20-RR017698 from the National Center for Research Excellence.
Footnotes
Supported by National Institutes of Health grant HD10793.
Summary sentence: Downstream promoter shift in spermatocytes explains why the prevalent 8.8 kb Sp1 mRNA correlates with diminished level of SP1 protein; SP3 protein also declines sharply during meiosis.
REFERENCES
- 1.Dynan WS, Tjian R. The promoter-specific transcription factor Sp1 binds to upstream sequences in the SV40 early promoter. Cell. 1983;35:79–87. doi: 10.1016/0092-8674(83)90210-6. [DOI] [PubMed] [Google Scholar]
- 2.Suske G, Bruford E, Philipsen S. Mammalian SP/KLF transcription factors: bring in the family. Genomics. 2005;85:551–556. doi: 10.1016/j.ygeno.2005.01.005. [DOI] [PubMed] [Google Scholar]
- 3.Suske G. The Sp-family of transcription factors. Gene. 1999;238:291–300. doi: 10.1016/s0378-1119(99)00357-1. [DOI] [PubMed] [Google Scholar]
- 4.Lomberk G, Urrutia R. The family feud: turning off Sp1 by Sp1-like KLF proteins. Biochem. J. 2005;392:1–11. doi: 10.1042/BJ20051234. [DOI] [PMC free article] [PubMed] [Google Scholar]
- 5.Zhao C, Meng A. Sp1-like transcription factors are regulators of embryonic development in vertebrates. Dev. Growth Differ. 2005;47:201–211. doi: 10.1111/j.1440-169X.2005.00797.x. [DOI] [PubMed] [Google Scholar]
- 6.Li L, He S, Sun JM, Davie JR. Gene regulation by Sp1 and Sp3. Biochem. Cell. Biol. 2004;82:460–471. doi: 10.1139/o04-045. [DOI] [PubMed] [Google Scholar]
- 7.Kaczynski J, Cook T, Urrutia R. Sp1- and Kruppel-like transcription factors. Genome Biol. 2003;4:206. doi: 10.1186/gb-2003-4-2-206. [DOI] [PMC free article] [PubMed] [Google Scholar]
- 8.Bouwman P, Philipsen S. Regulation of the activity of Sp1-related transcription factors. Mol. Cell. Endocrinol. 2002;195:27–38. doi: 10.1016/s0303-7207(02)00221-6. [DOI] [PubMed] [Google Scholar]
- 9.Kamemura K, Hart GW. Dynamic interplay between O-glycosylation and O-phosphorylation of nucleocytoplasmic proteins: a new paradigm for metabolic control of signal transduction and transcription. Prog. Nucleic Acid Res. Mol. Biol. 2003;73:107–136. doi: 10.1016/s0079-6603(03)01004-3. [DOI] [PubMed] [Google Scholar]
- 10.Chu S, Ferro TJ. Sp1: regulation of gene expression by phosphorylation. Gene. 2005;348:1–11. doi: 10.1016/j.gene.2005.01.013. [DOI] [PubMed] [Google Scholar]
- 11.Clermont Y, Oko R, Hermo L. Cell biology of mammalian spermatogenesis. In: Desjardins C, Ewing LL, editors. Cell and Molecular Biology of the Testis. Oxford University Press; New York: 1993. pp. 332–376. [Google Scholar]
- 12.Saffer JD, Jackson SP, Annarella MB. Developmental expression of Sp1 in the mouse. Mol. Cell Biol. 1991;11:2189–2199. doi: 10.1128/mcb.11.4.2189. [DOI] [PMC free article] [PubMed] [Google Scholar]
- 13.Persengiev SP, Raval PJ, Rabinovitch S, Millette CF, Kilpatrick DL. Transcription factor Sp1 is expressed by three different developmentally regulated messenger ribonucleic acids in mouse spermatogenic cells. Endocrinology. 1996;137:638–646. doi: 10.1210/endo.137.2.8593813. [DOI] [PubMed] [Google Scholar]
- 14.Thomas K, Sung DY, Yang J, Johnson K, Thompson W, Millette C, McCarrey J, Breitberg A, Gibbs R, Walker W. Identification, characterization, and functional analysis of Sp1 transcript variants expressed in germ cells during mouse spermatogenesis. Biol. Reprod. 2005;72:898–907. doi: 10.1095/biolreprod.104.030528. [DOI] [PubMed] [Google Scholar]
- 15.Persengiev SP, Saffer JD, Kilpatrick DL. An alternatively spliced form of the transcription factor Sp1 containing only a single glutamine-rich transactivation domain. Proc. Natl. Acad. Sci. U. S. A. 1995;92:9107–9111. doi: 10.1073/pnas.92.20.9107. [DOI] [PMC free article] [PubMed] [Google Scholar]
- 16.Doenecke D, Albig W, Bouterfa H, Drabent B. Organization and expression of H1 histone and H1 replacement histone genes. J Cell Biochem. 1994;54:423–431. doi: 10.1002/jcb.240540409. [DOI] [PubMed] [Google Scholar]
- 17.Wang ZF, Sirotkin AM, Buchold GM, Skoultchi AI, Marzluff WF. The mouse histone H1 genes: gene organization and differential regulation. J. Mol. Biol. 1997;271:124–138. doi: 10.1006/jmbi.1997.1166. [DOI] [PubMed] [Google Scholar]
- 18.Clare SE, Fantz DA, Kistler WS, Kistler MK. The testis-specific histone H1t gene is strongly repressed by a G/C-rich region just downstream of the TATA Box. J. Biol. Chem. 1997;272:33028–33036. doi: 10.1074/jbc.272.52.33028. [DOI] [PubMed] [Google Scholar]
- 19.Meergans T, Albig W, Doenecke D. Conserved sequence elements in human main type-H1 histone gene promoters: their role in H1 gene expression. Eur. J. Biochem. 1998;256:436–446. doi: 10.1046/j.1432-1327.1998.2560436.x. [DOI] [PubMed] [Google Scholar]
- 20.Grimes SR, Wilkerson DC, Noss KR, Wolfe SA. Transcriptional control of the testis-specific histone H1t gene. Gene. 2003;304:13–21. doi: 10.1016/s0378-1119(02)01201-5. [DOI] [PubMed] [Google Scholar]
- 21.Horvath GC, Kistler WS, Kistler MK. RFX2 is a potential transcriptional regulatory factor for histone H1t and other genes expressed during the meiotic phase of spermatogenesis. Biol. Reprod. 2004;71:1551–1559. doi: 10.1095/biolreprod.104.032268. [DOI] [PubMed] [Google Scholar]
- 22.Heyting C, Dietrich AJ. Meiotic chromosome preparation and protein labeling. Methods Cell Biol. 1991;35:177–202. doi: 10.1016/s0091-679x(08)60573-7. [DOI] [PubMed] [Google Scholar]
- 23.Meistrich ML, Trostle PK, Frapart M, Erickson RP. Biosynthesis and localization of lactate dehydrogenase X in pachytene spermatocytes and spermatids of mouse testes. Dev. Biol. 1977;60:428–441. doi: 10.1016/0012-1606(77)90140-3. [DOI] [PubMed] [Google Scholar]
- 24.Bartell JG, Davis T, Kremer EJ, Dewey MJ, Kistler WS. Expression of the rat testis-specific histone H1t gene in transgenic mice. One kilobase of 5′-flanking sequence mediates correct expression of a lacZ fusion gene. J Biol Chem. 1996;271:4046–4054. doi: 10.1074/jbc.271.8.4046. [DOI] [PubMed] [Google Scholar]
- 25.Bustin SA, Benes V, Nolan T, Pfaffl MW. Quantitative real-time RT-PCR--a perspective. J. Mol. Endocrinol. 2005;34:597–601. doi: 10.1677/jme.1.01755. [DOI] [PubMed] [Google Scholar]
- 26.Horvath GC, Clare SE, Kistler MK, Kistler WS. Characterization of the H1t promoter: role of conserved histone 1 AC and TG elements and dominance of the cap-proximal silencer. Biol Reprod. 2001;65:1074–1081. doi: 10.1095/biolreprod65.4.1074. [DOI] [PubMed] [Google Scholar]
- 27.Oakberg EF. Duration of spermatogenesis in the mouse and timing of stages of the cycle of the seminiferous epithelium. Am. J. Anat. 1956;99:507–516. doi: 10.1002/aja.1000990307. [DOI] [PubMed] [Google Scholar]
- 28.Russsell LD, Ettlin RA, Hikim APS, Clegg ED. Histological and Histopathological Evaluation of the Testis. Cache River Press; Clearwater, FL: 1990. [Google Scholar]
- 29.Cheng H, Leblond CP. Origin, differentiation and renewal of the four main epithelial cell types in the mouse small intestine. V. Unitarian Theory of the origin of the four epithelial cell types. Am J Anat. 1974;141:537–561. doi: 10.1002/aja.1001410407. [DOI] [PubMed] [Google Scholar]
- 30.Bellve AR, Cavicchia JC, Millette CF, O’Brien DA, Bhatnagar YM, Dym M. Spermatogenic cells of the prepuberal mouse. Isolation and morphological characterization. J. Cell Biol. 1977;74:68–85. doi: 10.1083/jcb.74.1.68. [DOI] [PMC free article] [PubMed] [Google Scholar]
- 31.McCarrey JB. Development of the germ cell. In: Desjardins C, Ewing LL, editors. Cell and Molecular Biology of the Testis. Oxford University Press; New York: 1993. pp. 58–89. [Google Scholar]
- 32.Kleene KC. A possible meiotic function of the peculiar patterns of gene expression in mammalian spermatogenic cells. Mech. Dev. 2001;106:3–23. doi: 10.1016/s0925-4773(01)00413-0. [DOI] [PubMed] [Google Scholar]
- 33.Horiuchi T, Aigaki T. Alternative trans-splicing: a novel mode of pre-mRNA processing. Biol Cell. 2006;98:135–140. doi: 10.1042/BC20050002. [DOI] [PubMed] [Google Scholar]
- 34.Raverot G, Weiss J, Park SY, Hurley L, Jameson JL. Sox3 expression in undifferentiated spermatogonia is required for the progression of spermatogenesis. Dev. Biol. 2005;283:215–225. doi: 10.1016/j.ydbio.2005.04.013. [DOI] [PubMed] [Google Scholar]
- 35.Kremer EJ, Kistler WS. Localization of mRNA for testis-specific histone H1t by in situ hybridization. Exp. Cell. Res. 1991;197:330–332. doi: 10.1016/0014-4827(91)90442-w. [DOI] [PubMed] [Google Scholar]
- 36.Drabent B, Bode C, Bramlage B, Doenecke D. Expression of the mouse testicular histone gene H1t during spermatogenesis. Histochem Cell Biol. 1996;106:247–251. doi: 10.1007/BF02484408. [DOI] [PubMed] [Google Scholar]
- 37.Heidaran MA, Showman RM, Kistler WS. A cytochemical study of the transcriptional and translational regulation of nuclear transition protein 1 (TP1), a major chromosomal protein of mammalian spermatids. J. Cell Biol. 1988;106:1427–1433. doi: 10.1083/jcb.106.5.1427. [DOI] [PMC free article] [PubMed] [Google Scholar]
- 38.Schultz N, Hamra FK, Garbers DL. A multitude of genes expressed solely in meiotic or postmeiotic spermatogenic cells offers a myriad of contraceptive targets. Proc. Natl. Acad. Sci. U. S. A. 2003;100:12201–12206. doi: 10.1073/pnas.1635054100. [DOI] [PMC free article] [PubMed] [Google Scholar]
- 39.Shima JE, McLean DJ, McCarrey JR, Griswold MD. The murine testicular transcriptome: characterizing gene expression in the testis during the progression of spermatogenesis. Biol Reprod. 2004;71:319–330. doi: 10.1095/biolreprod.103.026880. [DOI] [PubMed] [Google Scholar]
- 40.Chalmel F, Rollan AD, Niederhaurser-Wiederkehr C, Chung SS, Demougin P, Gattiker A, Moore J, Patard JJ, Wolgemuth DJ, Jegou B, Primig M. The conserved transcriptome in human and rodent male gametogenesis. Proc Natl Acad Sci U S A. 2007;104:8346–8351. doi: 10.1073/pnas.0701883104. [DOI] [PMC free article] [PubMed] [Google Scholar]
- 41.Sapetschnig A, Koch F, Rischitor G, Mennenga T, Suske G. Complexity of translationally controlled transcription factor Sp3 isoform expression. J Biol Chem. 2004;279:42095–42105. doi: 10.1074/jbc.M404989200. [DOI] [PubMed] [Google Scholar]
- 42.Kozak M. A short leader sequence impairs the fidelity of initiation by eukaryotic ribosomes. Gene Expr. 1991;1:111–115. [PMC free article] [PubMed] [Google Scholar]
- 43.Kozak M. Pushing the limits of the scanning mechanism for initiation of translation. Gene. 2002;299:1–34. doi: 10.1016/S0378-1119(02)01056-9. [DOI] [PMC free article] [PubMed] [Google Scholar]
- 44.Kleene KC. Patterns, mechanisms, and functions of translation regulation in mammalian spermatogenic cells. Cytogenet Genome Res. 2003;103:217–224. doi: 10.1159/000076807. [DOI] [PubMed] [Google Scholar]
- 45.Iguchi N, Tobias JW, Hecht NB. Expression profiling reveals meiotic male germ cell mRNAs that are translationally up- and down-regulated. Proc Natl Acad Sci U S A. 2006;103:7712–7717. doi: 10.1073/pnas.0510999103. [DOI] [PMC free article] [PubMed] [Google Scholar]
- 46.Eddy EM, O’Brien DA. Gene expression during mammalian meiosis. Cur Top Develop Biol. 1998;37:141–200. [PubMed] [Google Scholar]
- 47.Clare SE, Hatfield WR, Fantz DA, Kistler WS, Kistler MK. Characterization of the promoter region of the rat testis-specific histone H1t gene. Biol. Reprod. 1997;56:73–82. doi: 10.1095/biolreprod56.1.73. [DOI] [PubMed] [Google Scholar]
- 48.Wilkerson DC, Wolfe SA, Grimes SR. H1t/GC-box and H1t/TE1 element are essential for promoter activity of the testis-specific histone H1t gene. Biol Reprod. 2002;67:1157–1164. doi: 10.1095/biolreprod67.4.1157. [DOI] [PubMed] [Google Scholar]
- 49.Zakeri ZF, Wolgemuth DJ, Hunt CR. Identification and sequence analysis of a new member of the mouse HSP70 gene family and characterization of its unique cellular and developmental pattern of expression in the male germ line. Mol Cell Biol. 1988;8:2925–2932. doi: 10.1128/mcb.8.7.2925. [DOI] [PMC free article] [PubMed] [Google Scholar]
- 50.Gebara MM, McCarrey JR. Protein-DNA interactions associated with the onset of testis-specific expression of the mammalian Pgk-2 gene. Mol Cell Biol. 1992;12:1422–1431. doi: 10.1128/mcb.12.4.1422. [DOI] [PMC free article] [PubMed] [Google Scholar]
- 51.Iannello RC, Kola I, Dahl HH. Temporal and tissue-specific interactions involving novel transcription factors and the proximal promoter of the mouse Pdha-2 gene. J Biol Chem. 1993;268:22581–22590. [PubMed] [Google Scholar]
- 52.Bonny C, Cooker LA, Goldberg E. Deoxyribonucleic acid-protein interactions and expression of the human testis-specific lactate dehydrogenase promoter: transcription factor Sp1 plays a major role. Biol Reprod. 1998;58:754–759. doi: 10.1095/biolreprod58.3.754. [DOI] [PubMed] [Google Scholar]
- 53.Kim M, Li D, Yunxia C, Mueller K, Chears WS, DeJong J. Regulatory factor interactions and somatic silencing of the germ cell-specific ALF gene. J Biol Chem. 2006;281:34288–34298. doi: 10.1074/jbc.M607168200. [DOI] [PubMed] [Google Scholar]
- 54.Thomas K, del Mazo J, Eversole P, Bellve A, Hiraoka Y, Li SSL, Simon M. Developmental regulation of expression of the lactate dehydrogenase (LDH) multigene family during mouse spermatogenesis. Development. 1990;109:483–493. doi: 10.1242/dev.109.2.483. [DOI] [PubMed] [Google Scholar]
- 55.Rosario MO, Perkins SL, O’Brien DA, Allen RL, Eddy EM. Identification of the gene for the developmentally expressed 70 kDa heat-shock protein (P70) of mouse spermatogenic cells. Dev Biol. 1992;150:1–11. doi: 10.1016/0012-1606(92)90002-x. [DOI] [PubMed] [Google Scholar]
- 56.Takakubo F, Dahl HH. The expression pattern of the pyruvate dehydrogenase E1 alpha subunit genes during spermatogenesis in asult mouse. Exp Cell Res. 1992;199:39–49. doi: 10.1016/0014-4827(92)90459-l. [DOI] [PubMed] [Google Scholar]
- 57.Drabent B, Bode C, Miosge N, Herken R, Doenecke D. Expression of the mouse histone gene H1t begins at premeiotic stages of spermatogenesis. Cell Tissue Res. 1998;291:127–132. doi: 10.1007/s004410050986. [DOI] [PubMed] [Google Scholar]
- 58.Han SY, Zhou L, Upadhvava A, Lee SH, Parker KL, DeJong J. TFIIalpha/beta-like factor is encoded by a germ cell-specific gene whose expression is up-regulated with other general transcription factors during spermatogenesis in the mouse. Biol Reprod. 2001;64:507–517. doi: 10.1095/biolreprod64.2.507. [DOI] [PubMed] [Google Scholar]
- 59.DeJong J. Basic mechanisms for the control of germ cell gene expression. Gene. 2006;366:39–50. doi: 10.1016/j.gene.2005.10.012. [DOI] [PubMed] [Google Scholar]
- 60.Yoshioka H, Geyer CB, Hornecker JL, Patel KT, McCarrey JR. Analysis in vivo of developmentally and evolutionarily dynamic protein-DNA interactions regulating transcription of the Pgk2 gene during mammalian spermatogenesis. Mol Cell Biol. 2007 doi: 10.1128/MCB.00990-07. [DOI] [PMC free article] [PubMed] [Google Scholar]
- 61.Tang H, Kung A, Goldberg E. Regulation of murine lactate dehydrogenase C (Ldhc) gene expression. Biol Reprod. 2008;78:455–461. doi: 10.1095/biolreprod.107.064964. [DOI] [PMC free article] [PubMed] [Google Scholar]
- 62.Mertineit C, Yoder JA, Taketo T, Laird DW, Trasler JM, Bestor TH. Sex-specific exons control DNA methyltransferase in mammalian germ cells. Development. 1998;125:889–897. doi: 10.1242/dev.125.5.889. [DOI] [PubMed] [Google Scholar]
- 63.Shovlin TC, Bourc’his D, La Salle S, O’Doherty A, Trasler JM, Bestor TH, Walsh CP. Sex-specific promoters regulate Dnmt3L expression in mouse germ cells. Hum. Reprod. 2007;22:457–467. doi: 10.1093/humrep/del379. [DOI] [PubMed] [Google Scholar]
- 64.Gu W, Hecht NR. Translation of a testis-specific Cu/Zn superoxide dismutase (SOD-1) mRNA is regulated by a 65-kilodalton protein which binds to its 5′ untranslated region. Mol. Cell. Biol. 1996;16:4535–4543. doi: 10.1128/mcb.16.8.4535. [DOI] [PMC free article] [PubMed] [Google Scholar]
- 65.Hake LE, Hecht NB. Utilization of an alternative transcription initiation site of somatic cytochrome c in the mouse produces a testis-specific cytochrome c mRNA. J. Biol. Chem. 1993;268:4788–4797. [PubMed] [Google Scholar]
- 66.Rao SM, Howells RD. cis-acting elements in the 5′-untranslated region of rat testis proenkephalin mRNA regulate translation of the precursor protein. J. Biol. Chem. 1993;268:22164–22169. [PubMed] [Google Scholar]
- 67.Kim TH, Barrera LO, Zheng M, Qu C, Singer MA, Richmond TA, Wu Y, Green RD, Ren B. A high-resolution map of active promoters in the human genome. Nature. 2005;436:876–880. doi: 10.1038/nature03877. [DOI] [PMC free article] [PubMed] [Google Scholar]
- 68.Nicolas M, Noe V, Ciudad CJ. Transcriptional regulation of the human Sp1 gene promoter by the specificity protein (Sp) family members nuclear factor Y (NF-Y) and E2F. Biochem. J. 2003;371:265–275. doi: 10.1042/BJ20021166. [DOI] [PMC free article] [PubMed] [Google Scholar]
- 69.Kanai M, Wei D, Li Q, Jia Z, Ajani J, Le X, Yao J, Xie K. Loss of Kruppel-like factor 4 expression contributes to Sp1 overexpression and human gastric cancer development and progression. Clin. Cancer Res. 2006;12:6395–6402. doi: 10.1158/1078-0432.CCR-06-1034. [DOI] [PubMed] [Google Scholar]
- 70.Behr R, Kaestner KH. Developmental and cell type-specific expression of the zinc finger transcription factor Kruppel-like factor 4 (Klf4) in postnatal mouse testis. Mech. Dev. 2002;115:167–169. doi: 10.1016/s0925-4773(02)00127-2. [DOI] [PubMed] [Google Scholar]
- 71.Waters SH, Distel RJ, Hecht NB. Mouse testes contain two size classes of actin mRNA that are differentially expressed during spermatogenesis. Mol Cell Biol. 1985;5:1649–1654. doi: 10.1128/mcb.5.7.1649. [DOI] [PMC free article] [PubMed] [Google Scholar]
Associated Data
This section collects any data citations, data availability statements, or supplementary materials included in this article.