

Abstract
Estrogen components of some hormone replacement formulations have been implicated in the initiation of breast cancer. Some of these formulations contain equine estrogens such as equilin and equilenin that are metabolized to the genotoxic catechol 4 hydroxyequilenin (4-OHEN). Auto-oxidation generates the o-quinone form that reacts with dC and dA in oligodeoxynucleotides to form unusual stable cyclic bulky adducts, with four different stereoisomers identified for each base adduct. The dC and dA adducts have the same unsaturated bicyclo[3.3.1]nonane type linkage site with identical stereochemical characteristics. Stereochemical effects may play an important part in the biological consequences of formation of 4-OHEN-DNA adducts and the assignment of the absolute configurations of the stereoisomeric 4-OHEN-dC and -dA adducts is therefore needed to understand structure function relationships. We used density functional theory (DFT) to compute the specific optical rotations and electronic circular dichroism (ECD) spectra of the four 4-OHEN-C stereoisomers, and the results were compared with experimentally measured ORD and ECD spectra. The predicted ORD curves for the four stereoisomeric base adducts reproduced the shapes and signs of experimental spectra in the transparent spectral region. The stereochemistry of the C3′ atom was determined by comparison of the calculated and experimental ORD and ECD spectra, and the stereochemistry of C2′ was determined by mass spectrometric methods. Combining the ORD and mass spectrometry data, the absolute configurations of the four 4-OHEN-C and the stereochemically identical -dC adducts have been identified. The molecular architecture of the linkage site at the 4-OHEN-C/A and 4-OHEN-dC/dA is identical, and it is shown that the deoxyribose group does not substantially contribute to the optical activities. The absolute configurations of the 4-OHEN-dA adducts were thus deduced by comparing the experimental ORD with computed ORD values of 4-OHEN-A adducts.
Introduction
Hormone replacement therapy (HRT) is widely used to alleviate post-menopausal symptoms although undesirable side-effects, such as an increased risk of breast cancer, have been established (1, 2). Popular HRT formulations contain varying amounts of equine estrogens such as equilin and equilenin. These conjugated estrogen derivatives are rapidly metabolized to the catechol 4-hydroxyequilenin (4-OHEN) that, in turn, readily auto-oxidize to the o-quinone form (3–5). These quinoids are cytotoxic and genotoxic (5–8) and react chemically with DNA in vitro and in vivo (6–9) to generate a variety of lesions, including bulky DNA adducts (4, 9).
The quinoids produced by the oxidation of 4-OHEN can react with dC, dA, and dG in DNA to form unusual stable, stereoisomeric cyclic bulky adducts (10–12). Each of these 4-OHEN-nucleobase adducts has three chiral carbon atom centers within the region connecting the nucleobase to the 4-OHEN A-ring. Although the existence of eight stereoisomers is predicted, only four are observable as shown in Figure 1. The stereoisomers with the H and OH groups at the C1′ and C3′ positions in the trans configuration are not feasible due to the highly strained bridge ring that would be formed in this configuration (10). The four stereoisomers differ from one another by the absolute configurations of substituents about the C1′, C2′ and C3′ atoms (Figure 1). However, only the configurations at the C2′ and C3′ atoms determine the stereochemistries of these adducts due to the correlated orientations of C1′ and C3′ in the C1′-C2′-C3′ bridge. Although, four such stereoisomeric 4-OHEN-dC, -dA, and -dG (but not dT) adducts have been observed experimentally (9, 11, 12), their absolute configurations have not yet been identified.
Figure 1.

(a) Chemical structures and stereochemical characteristics of the 4-OHEN-C and -A adducts. (b) QM geometry optimized conformations of the 4-OHEN-C and –A stereoisomeric adducts.
The structures of the four stereoisomeric 4-hydroxyequilenin-guanine (4-OHEN-G) (13, 14), and 4-hydroxyequilenin-cytosine/adenine (4-OHEN-C/A) base adducts (14) (Figure 1), as well as the conformations of the 4-OHEN-C/A adducts in double-stranded DNA (15, 16) have been previously studied computationally, by DFT quantum mechanical (14) and molecular dynamics simulation (15, 16) methods. The unsaturated bicyclo[3.3.1]nonane type linkage site causes the conformations of the 4-OHEN-C and 4-OHEN-A base adducts to be severely restricted. The chirality of the C3′ atom determines the handedness of the 4-OHEN-C/A ring systems, and the C2′ chirality governs the orientation of its OH group (Figure 1). The 1′S,2′S,3′R-4-OHEN-C1 and 1′R,2′R,3′S-4-OHEN-C2 stereoisomers are a pair with inverse R and S configurations, as are the 1′S,2′R,3′R-4-OHEN-C3 and 1′R,2′S,3′S-4-OHEN-C4 stereoisomers, and the pairs are thus nearly mirror images of one another; the symmetry is broken only by the D ring with its C18′ methyl group on the equilenin rings with S configuration in all stereoisomers (Figure 1(b)). In the 4-OHEN-C1/C2 pair, the C2′ OH group is oriented toward the cytosine base moiety, while in the 4-OHEN-C3/C4 pair this group points toward the equilenin moiety (Figure 1). The characteristics of the 4-OHEN-A1/A2 and 4-OHEN-A3/A4 pairs are identical to those of the C analogs. The molecular modeling and molecular dynamics simulation studies show that the conformations of the 4-OHEN-dC and –dA stereoisomeric adducts in DNA duplexes (15–17) are specifically governed by their unique stereochemical characteristics, specifically the absolute configurations of the C1′ and C3′ atoms, and the hydroxyl group at C2′.
Stable bulky 4-OHEN-dA and -dG adducts have been found in rat mammary tissue (9), and dG, dA and dC adducts have been detected in human breast cancer patients who used Premarin (18). It has been shown that 4-OHEN is mutagenic in a supF shuttle vector plasmid system propagated in human cells (19). Base substitutions of C:G pairs in the 5′-TC/AG-5′ sequence were the predominant mutation observed, and the C:G → G:C and C:G → A:T transversions were attributed to a 4-OHEN-dC major adduct. In vitro primer extension studies conducted with several Y-family bypass polymerases, namely Dpo4, pol η and pol κ, indicate that the 4-OHEN-dC/dA lesions can be bypassed with an incorrect dNTP or by a slippage mechanism (20–23). Stereoisomer-dependent differences between the 4-OHEN-C adducts in the bypass of these lesions by DNA polymerases have been observed experimentally, and are most likely governed by the differences in absolute configurations of these adducts. Stereochemistry-dependent differences in repair efficiencies in a human nucleotide excision repair assay have also been observed (24)(Kropachev, K., Chen, D., and Geacintov, N.E., to be published).
Since stereochemistry effects play an important part in the differential treatment of the 4-OHEN-DNA lesions by polymerases and DNA repair enzymes, the assignment of the absolute configurations of these adducts is needed. In recent years, optical rotatory dispersion (ORD) methods, in combination with quantum mechanical calculation of the sign and magnitude of the ORD signals, have been used extensively to determine the absolute configurations of a variety of stereochemically distinct compounds (25–37). Predictions of the specific rotations and electronic circular dichroism (ECD) using density functional theory (DFT) have been successfully correlated with experimental data for a variety of chiral molecules (29–31, 34). In the present work, we measured the optical rotatory dispersion (ORD) spectra and calculated the wavelength-dependent specific rotation of the four different 4-OHEN-C stereoisomeric adducts using DFT methods. The predicted wavelength-dependent ORD values for the four stereoisomeric base adducts reproduced the shapes of the experimentally measured ORD spectra. Comparisons of the computed and experimental ORD curves allowed us to assign the absolute configurations of the 4-OHEN-C adducts at the C3′ atom (Figure 1), and the assignments were confirmed by experimental and calculated ECD spectra. However, the absolute configuration of the -OH group about the C2′ atom (Figure 1) cannot be determined by this method. Following the mass spectrometric approach described by Embrechts et al. (10), the stereochemistry at the C2′ atom of each of the four stereoisomeric 4-OHEN-dC adducts was determined by MS/MS methods. Thus, combining the results of the ORD, ECD, and mass spectrometric studies, the absolute configurations of all four 4-OHEN cytosine adducts were identified. Since the 4-OHEN-A/dA and 4-OHEN-C/dC adducts have identical structural features about the rigid and chiral bicyclo[3.3.1]nonane type linkage site, the same absolute configuration assignments should be also valid for the 4-OHEN-adenine adducts. This conclusion was confirmed by comparing experimentally measured and computed ORD spectra.
METHODS
1. Synthesis of 4-OHEN-dC, -C, and –dA adducts
The 4-OHEN was synthesized by treating equilin with Fremy’s salt as described by Shen et al. (38). The 4-OHEN in 0.2 mL of dimethyl sulfoxide (DMSO) solution (0.035 M) was incubated with 2′-deoxycytidine or cytosine (0.007 M) in 2 mL of 25 mM sodium phosphate buffer, pH 7.0, at 37 °C for 12 h. The covalently modified products were separated from the unmodified starting dC or C by a Waters model 510 Solvent Delivery HPLC system using a 250 mm × 10.0 mm (5 μm) Phenosphere C18 column (Phenomenex) or analytical 250 mm × 4.6 mm (5 μm) Microsorb-MV C18 column (Varian, Inc.) utilizing acetonitrile/triethylammonium acetate (50 mM) solution gradients, as described in detail earlier (12). The 4-OHEN-dA adducts were prepared in a similar manner.
2. Analysis of structural properties of 4-OHEN-dC adducts by mass spectrometry methods
HPLC fractions of each stereoisomerioc 4-OHEN-dC nucleoside adduct were stored at −20 °C until analysis. Each fraction was thawed, dissolved in 1 mL of water/acetonitrile (95:5; v/v) containing 0.1 % formic acid and infused into the electrospray source at 5 μL/min for tandem mass spectrometric analysis. Mass spectra were acquired using a Thermo Finnigan (San Jose, CA) LTQ-FT ICR mass spectrometer equipped with a Dionex (Auburn, CA) microcapillary HPLC system. The electrospray source parameters consisted of a spray voltage of 4 kV, a sheath gas flow of 5 L/min, a capillary temperature of 275 °C, and a capillary voltage of 44 V. Mass spectra and product ion tandem mass spectra (MS2) were obtained at a resolving power of 100,000 (at m/z 400). The base peak of each mass spectrum, [M+H]+ of m/z 524, was used for product ion tandem mass spectrometric analysis with collision-induced dissociation. Further fragmentation was investigated using MS3 and MS4 with the linear ion trap only for optimum sensitivity.
3. Measurements of experimental ECD and ORD spectra
The circular dichroism spectra of the 4-OHEN-C and 4-OHEN-dC adducts were recorded in aqueous solution using an AVIV model 202SF CD spectrometer.
An ORD instrument was constructed for performing the ORD measurements and was fully described elsewhere (39). Briefly, the system consisted of a 150 W Cermax Xenon arc light source (Perkin-Elmer Inc., Wellesley, MA), an H-10UV monochromator (JobinYvon-Horiba, Longjumeau, France) with the wavelength drive controlled by a microprocessor unit, and a photoelastic modulator operating at a frequency of 50 kHz. The light was passed first through a quarter-wave Fresnel romb retarder (Karl Lambrecht Co., Chicago, IL) and then the photoelastic modulator to produce a modulated linearly polarized light beam in the wavelength range desired. The light passed through the 4 mm × 10 mm quartz sample cell (10 mm optical pathlength), and finally through a crystal polarizer before reaching the detector. The latter was a Hamamatsu Model R960 photomultiplier whose output was coupled directly to a model 5209 lock-in amplifier (Princeton Applied Research, Princeton, NJ). The output current of the photomultiplier was kept constant as the wavelength was varied by a homebuilt feedback circuit that adjusted the voltage applied to the photomutiplier in order to compensate for the differences in the incident light intensities at the different wavelengths. The photoelastic modulator provided an analog voltage output that was proportional to the wavelength setting of the monochromator which, in turn, provided for easy recording of the ORD signal output as a function of wavelength on a computer. The output of the lock-in amplifier was transmitted to a computer through a GPIB interface (National Instruments Co., Austin, TX). The output signal was calibrated using (20g/100mL) aqueous solutions of L-(+) and D-(−) – Tartaric acid (Aldrich Chemical Company, Inc., St.Louis, MO, that yield standard rotations of ±12° (1 dm pathlength), respectively (Sodium D-line, 589 nm). The calibration coefficients determined separately with either L-(+) and D-(−)-Tartaric acid solutions were the same within 3%. The calibrations and signs of the ORD signals were confirmed using (1R)-(+) and (1S)-(−)-camphor purchased from Fluka Chemie Gmbh (Buchs, Switzerland). These standards yielded rotation values of +44.1° and 43.0° (1 dm pathlength, 10g/100 ml in ethanol), respectively, at 589 nm.
4. Quantum mechanical ECD and ORD calculations for 4-OHEN-C/A adducts
The conformations of the 4-OHEN-C and -A stereoisomeric adducts were deduced in previous quantum mechanical studies (14) Due to the rigid bicyclo[3.3.1]nonane type linkage site, each stereoisomeric adduct can assume only one conformation (Figure 1), which was utilized in the ORD and ECD calculations.
The calculations of ECD and specific rotations were carried out by time-dependent DFT (TDDFT) methods with Gaussian 03 (40). The excitation energies and rotational strengths of 4-OHEN-C were calculated using TDDFT at the B3LYP/6-31G* level. Electronic rotational strengths were calculated using both length and velocity representations. The ECD spectrum is simulated from electronic excitation energies and velocity rotational strengths by overlapping the Gaussian function for each transition (41, 42). For parameter σ (width of the band at 1/e height) a value of 0.2 eV was selected to give a good fit to the experimental spectra. To calculate ORD, we employed the method of Stephens et al. (29–31, 34), using time-dependent DFT/gauge-including atomic orbitals (GIAOs). A single point at the sodium D line was calculated for the four 4-OHEN-C stereoisomers using the B3LYP functional (43–45) with large basis set 6-311G++(2d,2p). The ORD curves were computed for both 4-OHEN-C and -A adducts at the B3LYP/6-31G* level. A discussion of the two methods is provided in the Results and Discussion section.
RESULTS and DISCUSSION
Experimental CD spectra of 4-OHEN-C and 4-OHEN-dC adducts
We measured the ORD and ECD spectra of both the 4-OHEN-dC nucleoside and 4-OHEN-C base adducts. In typical experiments involving the separation of such adducts, or deducing the stereochemical characteristics of cytosine adducts in native DNA, it is more convenient to work with deoxynucleoside rather than base adducts. For example, enzymatic degradation of native DNA generates nucleoside adducts and not base adducts, and the measured ECD spectra are used to classify the stereochemical properties of the 4-OHEN-dC adducts (12). On the other hand, it is more convenient to compute the ORD and ECD spectra of the 4-OHEN-C adducts than those of the 4-OHEN-dC adducts (see below). We therefore, synthesized and measured the optical activities of both 4-OHEN-dC and –C adducts to facilitate comparisons between computed and measured spectra.
Typical reversed phase elution profiles of the four stereoisomeric 4-OHEN-dC adducts have been published (12). Here, a typical reversed phase HPLC elution profile of a reaction mixture derived from the incubation of 4-OHEN with C is shown in Figure 2. This profile is similar to the elution profiles obtained with incubation mixtures of 4-OHEN with the nucleoside dC (12). In the latter case, the stereoisomeric 4-OHEN-dC nucleoside adducts were designated by the abbreviations dC1, dC2, dC3, and dC4, where the superscripts designate their elution orders. Here, we designate the 4-OHEN-C base adducts by the analogous abbreviations, C1, C2, C3, and C4, in the order of their elution in our reversed phase HPLC experiments. As in the case of the 4-OHEN-dC nucleoside adducts (12), the reaction yields of the two late-eluting fractions C3 and C4 are higher than those of the two earlier-eluting fractions C1 and C2 (Figure 2).
Figure 2.

(a) Reversed HPLC elution profile of a mixture of the four stereoismeric 4-OHEN-C adducts C1, C2, C3, and C4, derived from the reactions of 4-OHEN with cytosine. The superscripts denote the order of elution using a C18 column with following elution conditions: 5% acetonitrile in 50mM TEAA buffer solution (0 – 20 min), and 20–30% acetonitrile in 50mM TEAA buffer solution (20 – 60 min).
The C3 and C4 fractions of the 4-OHEN-C base adducts, as well as the C1 and C2 fractions, form stereoisomeric pairs with nearly symmetrical CD spectra of opposite sign (Figure 3). The CD spectra of each pair are not exact mirror images of one another because the two members of each pair are diastereoisomers and not enantiomers, due to the symmetry-breaking methyl group at C18′. The optimized conformations of the 4-OHEN-C adducts show that the equilenin ring system is nearly perpendicular to the attached cytosine ring (Figure 1). The CD spectra of opposite sign result from the near-mirror image structures of the members of each pair, which adopt opposite orientations of the equilenin ring systems with respect to the attached cytosine; these orientations are governed by absolute configurations about atoms C1′-C3′. Each stereoisomeric pair with the identical C1′-C3′ absolute configuration can have two different orientations, or absolute configurations, of the OH group at atom C2′. The two different C2′-OH group orientations do not contribute significantly to the overall ORD (or CD) spectra since only two different spectra (of opposite sign) are observed (12).
Figure 3.

CD spectra of (a) 4-OHEN-C (Cn) and (b) 4-OHEN–dC (dCn) adducts (50 μM concentration in water). The superscripts denote the order of elution in reversed phase C18 column HPLC elution experiments (see Figure 2). Computed ECD specta are shown as dotted lines.
The CD spectra of two of the four stereoismeric 4-OHEN-C nucleobase adducts, like the 4-OHEN-dC nucleoside adducts (Figure 3), exhibit two major CD bands in the 240 – 360 nm wavelength range. The 2′-deoxyribose ring does not alter the general shapes of the CD spectra. We have previously utilized the sign of the CD spectra at ~ 260 nm (either negative or positive) to classify the absolute configurations of the C1′-C2′-C3′ bridge (Figure 1b) without being able to distinguish between the two possibilities (12). Here we note that the major 4-OHEN-C adducts, C3 and C4, exhibit negative (−) and positive (+) CD signals at ~262 nm, respectively (Figure 3a). However, the corresponding nucleoside adducts dC3 and dC4 exhibit positive (+) and negative (−) extrema at ~262 nm, respectively (Figure 3b). Similar reversed relationships are observed in the pairs of minor yield adducts C1, C2 (Figure 3a) and dC1/dC2 (Figure 3b). Specifically, the C18 column reversed phase HPLC elution orders (EO) of 4-OHEN-C adducts are:
| 4-OHEN-C: | C1(−, minor) → C2(+, minor) → C3(−, major) → C4(+, major) | (EO-C) |
| 4-OHEN-dC: | dC1(+, minor) → dC2(−, minor) → dC3(+, major) → dC4(−, major) | (EO-dC) |
where the + and − signs refer to the ECD spectra at ~ 262 nm, while major and minor refer to the relative reaction yields. We note that the presence of the deoxyribose group changes the elution order of the major dC3 and dC4 and the minor dC1 and dC2 adducts relative to the elution order of the C3 and C4, and C1 and C2 adduct pairs. The elution orders are a function of the subtle differences in the absolute configurations of the hydrophobic base adducts and the more hydrophilic deoxyribose groups that contribute to the retention of the dC adducts to the matrix, thus causing differences in elution orders.
Experimental ORD spectra of 4-OHEN-C/dC adducts
The measured ORD spectra of the major C3 and C4 adducts are of opposite sign and symmetric to one another, within experimental error (Figures 4a and 4b). The ORD spectra of the minor products C1 and C2 have the same shape and sign as the major C3 and C4 adducts, respectively (data not shown). Furthermore, consistent with the relationships between the orders of elution of the 4-OHEN-C and –dC adducts and their ECD spectra summarized above in (EO-C) and (EO-dC), the signs and shapes of dC4 and C3 are similar (Figure 4a), as are those of dC3 and C4 (Figure 4b). Likewise, the ORD spectra of dC1 and C2 are similar, as are the ORD spectra of dC2 and C1 (data not shown).
Figure 4.
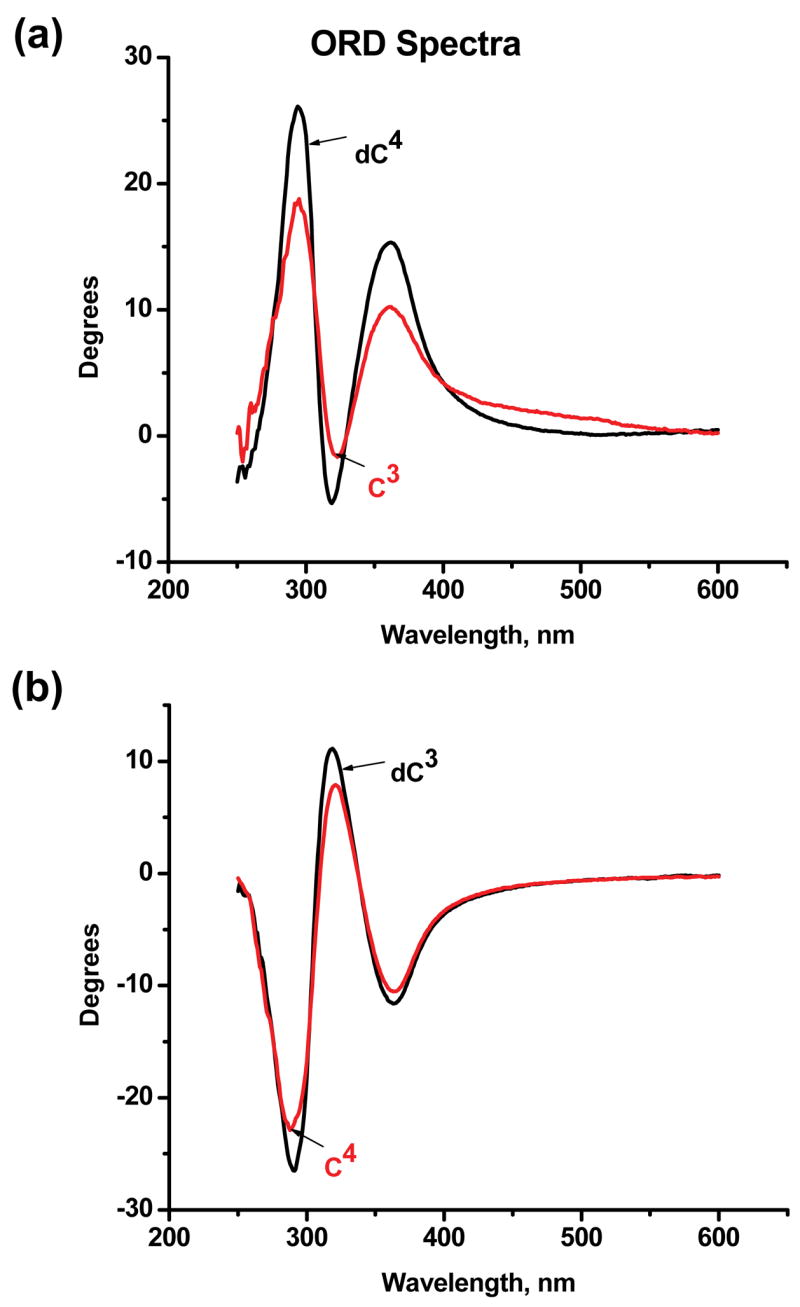
Comparison of ORD spectra of 4-OHEN-cytosine base (Cn) and 4-OHEN-2′-deoxycytosine (dCn) adducts (4.5×10⁻⁴ M concentrations in water). (a) Comparison of ORD spectra of C3 and dC4. (b) Comparison of C4 and dC3 ORD spectra.
Thus, there are two types of ORD and ECD spectra of opposite sign that we attribute to the absolute configurations of the C1′-C2′-C3′ unsaturated bicyclo[3.3.1]nonane bridge (Figure 1). However, it is not possible to correlate these ORD (or ECD) spectra with the absolute configurations of the adducts shown in Figure 1. We therefore computed the signs of the ORD signals of the four stereoisomeric 4-OHEN-C adducts to gain further insights into their absolute configurations. Since the signs and shapes of the ORD spectra of these adducts are similar in the 4-OHEN-C and 4-OHEN-dC adducts (Figure 4), the calculations were performed for the smaller 4-OHEN-C adducts for which calculations are more reliable as well as less computationally demanding.
Computations of ORD spectra of 4-OHEN-C and comparisons with experimental values
The measured and calculated ORD curves of each pair of 4-OHEN-C stereoisomers were compared in the 370 – 600 nm range (Figure 5a and 5b). Although the quantitative fits are not exact, the absolute signs, as well as the increasing magnitude of the specific rotation, [α]λ, as the wavelength is decreased, indicate that this approach is useful for correlating the absolute configurations of the molecules to the signs of the ORD spectra. Calculations below 370 nm are less reliable and are not shown here since the DFT method cannot always satisfactorily reproduce the wavelength dependence of ORD spectra in regions of electronic absorption bands, i.e., in wavelength regions where the ORD signal abruptly changes sign (see, for example,(35)). At longer wavelength (> 500 nm), the sign of the computed values may be unreliable because of the small values of the specific rotation, [α]λ (29, 35, 46, 47). As the wavelength approaches the region where electronic transitions become active, the values of [α]λ increase more rapidly than the measured values (48–50). The conformations of the 3′-OH and 2′-OH groups, specifically the dihedral angles H-O-C2′-C1′ and H-O-C3′-C2′ do not change the sign and shape of the ORD curve as shown in Table S1 for the 4-OHEN-C3 test case.
Figure 5.

Comparison of calculated and experimental ORD spectra of four 4-OHEN-C stereoisomeric adducts. The experimentally measured ORD spectra are shown by smooth lines in units of deg [dm (g/cm3)]−1, and the computed ORD values are indicated by the symbols. (a) C1 and C2; (b) C3 and C4.
Comparisons of the predicted and experimental values and wavelength dependence of [α]λ of each of the 4-OHEN-C pairs in regions of well defined negative or positive ORD signals, indicate that the shapes and negative or positive signs are consistent with the experimental data in the 370–490 nm range, thus permitting the assignment of the absolute configuration of the C1′-C2′-C3′ bridge. This is reasonable even though the calculated and measured [α]λ values do not match perfectly (35–37). Since the experimental ORD spectra of both the C1(−,minor) and C3(−,major) are positive in sign, they correspond to the 1′S,2′S,3′R-4-OHEN-C1 and 1′S,2′R,3′R-4-OHEN-C3 adducts defined in Figure 1. Similarly, the experimental [α]λ values of the C2(+,minor) and C4(+,major) are negative in sign, and thus correspond to the 1′R,2′R,3′S-4-OHEN-C2 and 1′R,2′S,3′S-4-OHEN-C4 stereoisomers (Figure 5). However, the combined experimental ORD measurements and computations of the sign and wavelength dependence of the adducts cannot distinguish the members of the stereoisomer pairs that have 2′R or 2′S absolute configurations, corresponding to different orientations of the 2′-OH group. As shown below, the orientation of the C2′-OH group can be deduced by mass spectrometry fragmentation methods.
Calculations of the specific rotation at 589 nm using more accurate basis sets
The lower-level, smaller basis set 6-31G* was used to calculate the wavelength dependence of [α]λ shown in Figure 5. We also calculated the specific rotation [α]λ values at the single 589.3 nm wavelength, the standard sodium D-line wavelength used frequently for reporting absolute ORD values, using the larger basis set 6-311G++(2d,2p) for all four stereoisomeric 4-OHEN-C adducts. The computed specific rotation values [α]589 agree reasonably well with those obtained with the smaller 6-31G* basis set (Table S2). The basis set (6-311G++(2d,2p)), which contains diffuse functions, has been shown to significantly reduce basis set errors in the calculated ORD values (31). However, the values of [α]589 calculated via this large basis are positive in sign for all four 4-OHEN-C stereoisomeric adducts, while experimentally, two of the four stereoisomers exhibit negative values of [α]589. The uniformly positive sign of the calculated [α]589 values has been noted before and attributed to inaccuracies in calculating the values of [α]589 since the ORD values are intrinsically small at this wavelength, and small changes in the electronic distribution of the wavefunctions may introduce changes in sign of the computed values (29, 35, 46, 47). Therefore, single wavelength calculations of [α]589 by the presently available computation methods are not entirely reliable even with a high level basis set, at least for the 4-OHEN-C adducts. Therefore, we calculated the wavelength-dependent [α]λ values in a wavelength region where the absolute value of the specific rotation increases sharply with decreasing wavelength (Figure 5). Errors in the sign of the ORD specific rotation are less likely in this approach and the accurate determination of the sign of the ORD rather than its absolute value is deemed sufficient for distinguishing between the appropriate pairs of 4-OHEN-C stereoisomers that have opposite signs of ORD (and CD). We computed the wavelength-dependent values of [α]λ with the small basis set (6-31G*) because the large system under investigation was computationally intractable using the higher level (B3LYP/6-311G++(2d,2p)) basis set. While the measured and computed rotation values do not match quantitatively, the signs and shapes of the wavelength-dependent specific rotations are in agreement with the data. The lack of complete agreement between the measured and computed [α]λ values can arise from different causes that are known to include errors in the density functional and basis set, and the neglect of solvent and vibrational effects (34).
Computation of ECD spectra of 4-OHEN-C and comparison with experimental values
We have calculated excitation energies and rotational strengths for the four 4-OHEN-C stereoisomers. The length and velocity rotational strengths are in good agreement, indicating that the basis set error is small. The simulated ECD spectra exhibit two major CD bands (Figure 3a), which are consistent in sign and wavelength position with the experimental spectra, permiting the assignment of the absolute configuration of the C1′-C3′ bridge. The predicted ECD spectra of 4-OHEN-C1 and C3 exhibit an intense band at ~ 260 nm with negative sign and a weaker band at ~ 350 nm with positive sign, and thus correspond to the experimental C1(−,minor) and C3(−,major) stereoisomers. Similarly, the predicted ECD spectra of 4-OHEN-C2 and C4 exhibit an intense band at ~ 260 nm with positive sign and a weaker band at ~ 350 nm with negative sign, and thus correspond to the experimental C2(+,minor) and C4(+,major) stereoisomers. The calculations and experiments are qualitatively in agreement; the results are consistent with those from the ORD data, and confirm the assignment of the absolute configuration at C3′. However, similar to the ORD spectra computations, the combined ECD experiments and computations cannot determine the configuration at C2′, because the different orientations of the C2′-OH group in the 4-OHEN-C1/C2 and C3/C4 pairs do not significantly alter the shape of CD spectra.
Analysis of fragmentation patterns of 4-OHEN-dC by MS/MS analysis
Embrechts et al. (10) showed that MS/MS fragmentation patterns of both the 4-OHEN-C and 4-OHEN-A adducts can be used to distinguish the 1′S,2′S,3′R from 1′S,2′R,3′R, and the 1′R,2′S,3′S from 1′R,2′R,3′S stereoisomers; these pairs are indistinguishable by the sign of the ORD signals. They showed that when the C2′-H atom is oriented in the same direction (cis-C2′-H) relative to the C1′-N3 bond in 4-OHEN-dC adducts, a fragmentation pathway that generates the intact cytosine base (mass 112) is observed. Such an orientation is evident in the 1′S,2′R,3′R-4-OHEN-C3 and 1′R,2′S,3′S-4-OHEN-C4 models (Figure 1). On the other hand, in the case of the 4-OHEN-C1 and 4-OHEN-C2 adducts, the C2′-H atom and the N3-C1′ bond point in different directions (trans-C2′-H), and the fragmentation pattern does not generate the base with mass 112, thus providing a means for distinguishing the C2′-H, and thus the C2′-OH orientations (10). However, Embrechts et al. studied only three out of the four 4-OHEN-dC isomers, and the HPLC elution orders of their 4-OHEN-dC adducts may have been different from ours. Therefore, in order to unambiguously assign the absolute configurations of the C2′ substituents, we re-investigated the MS/MS fragmentation patterns of all 4-OHEN-dC stereoisomers that we studied by ORD and CD methods (Figures 3 – 5).
Accurate mass measurements using positive ion electrospray mass spectrometry were performed with each of the four 4-OHEN-dC fractions. Each of the 4 stereoisomers was repurified using HPLC and analyzed using positive ion electrospray MSn. During MS, each 4-OHEN-dC adduct formed a protonated molecule of m/z 524. High resolution accurate mass measurements were used to confirm that the elemental compositions were identical in each of the four fractions and corresponded to the expected elemental composition C27H30O8N3 (< 5 ppm). Next, MS-MS product ion analysis of each protonated molecule was carried out with collision-induced dissociation, and the base peak for each isomer was detected at m/z 408 (data not shown).
Since no other significant product ions were detected, the base peaks of m/z 408 for each isomer were selected and fragmented, and these MS3 product ion mass spectra were obtained and are shown in Figure S1 (Supporting Information). The MS3 product ion mass spectra of the isomers in HPLC peaks 3 (dC3) and 4 (dC4) formed base peaks of m/z 362 whereas the base peaks of the MS3 spectra of peaks 1 (dC1) and 2 (dC2) were detected at m/z 390. Next, MS4 measurements were carried out using either m/z 362 or 390 (whichever was most abundant) as precursors from the MS3 analyses, and the results are shown in Figure 6. Only the stereoisomeric pair corresponding to dC3 and dC4 form the cytosine product ion of m/z 112. As reported previously (10), the stereoisomers dC3 and dC4 correspond to those in which the hydrogen atom on carbon C2′ has a cis-C2′-H configuration with respect to the N3 – C1′ bond. The proposed fragmentation pathways for all four stereoisomers, shown in Figures 7 and S2, indicate how only two of these isomers, dC3 and dC4 can form the ion of m/z 112. Therefore, the MSn fragmentation patterns show that the dC3 and dC4 isomers correspond to the 1′S,2′R,3′R-4-OHEN-C3 and 1′R,2′S,3′S-4-OHEN-C4 pair. Furthermore, the isomers dC1 and dC2 correspond to the 1′S,2′S,3′R-4-OHEN-C1 and 1′R,2′R,3′S-4-OHEN-C2 pair.
Figure 6.

Positive ion electrospray MS4 spectra of the protonated molecules of m/z 524 for the 4-OHEN-dCn adducts where the superscript n = 1 – 4 denotes the order s of elution in reversed phase C18 column HPLC experiments. Following MS-MS of m/z 524, the base peak of m/z 408 in each spectrum was selected for MS3 analysis as shown in Figure 5. Then, the base peaks of m/z 390 (dC1 and dC2) or m/z 362 (dC3 and dC4) were selected for collision-induced dissociation and MS4 analysis. Note the cytosine ion of m/z 112, which distinguishes the adducts dC3 and dC4 from adducts dC1 and dC2. The fragmentation pathways are proposed in Figure 7 for the formation of the cytosine ions of m/z 112.
Figure 7.

Proposed fragmentation pathways for the protonated molecules of the isomeric 4-OHEN-dC (dCn) with n = 3,4. The protonated molecules of the isomers of dC3 and dC4 fragment to form unique cytosine ions of m/z 112 that occur with two hydrogen atom transfers. The protonated molecules of the isomers dC1 and dC2 cannot fragment to form ions of m/z 112 due to the unfavorable stereochemical arrangement for hydrogen rearrangement (see the text, and MS/MS spectra and fragmentation patterns shown in Supporting Information).
Based on the conclusions from the experimentally measured and computed ORD values and ECD spectra and the MSn fragmentation patterns, it is now possible to assign the absolute configurations of each of the four 4-OHEN-base and 4-OHEN-nucleoside adducts (Table 1).
Table 1.
Assignments of absolute configurations of 4-OHEN cytosine adducts.
| Structuresa | 4-OHEN-C1 | 4-OHEN-C2 | 4-OHEN-C3 | 4-OHEN-C4 |
|---|---|---|---|---|
| Absolute Configurations | 1′S,2′S,3′R (trans-C2′-H) | 1′R,2′R,3′S (trans-C2′-H) | 1′S,2′R,3′R (cis-C2′-H) | 1′R,2′S,3′S (cis-C2′-H) |
| C, Nucleobase Adductsb | C1 | C2 | C3 | C4 |
| 2′-deoxycytidine Adductb | dC2 | dC1 | dC4 | dC3 |
| ORD > 370 nm | Positive | Negative | Positive | Negative |
| CD (~ 262 nm) | Negative | Positive | Negative | Positive |
| MS/MSn (2′C Assignments) | dC1 or dC2 | dC1 or dC2 | dC3 or dC4 | dC3 or dC4 |
The calculations are based on coordinates of the structures shown in Figure 1.
The superscript is used to denote the experimental sample in the elution order in reversed phase C18 column HPLC experiments
Absolute configuration and reaction yields of 4-OHEN-C/dC adducts
When 4-OHEN is reacted with the cytosine nucleobase or nucleoside 2′-deoxycytidine, the yields of the two initially eluting fractions (C1, C2 (Figure 2) or dC1, dC2 (12)) are always lower by factors of ~ 5 – 15 than the yields of the subsequently eluting two fractions (C3, C4 (Figure 2) or dC3, dC4 (12)). Similar differences are observed when 4-OHEN is reacted with dA (12). Based on the assignments of absolute configurations of these different stereoisomeric 4-OHEN-adducts it is evident that the C2′-OH group is oriented towards the nucleobase in the dC1 and dC2 adducts (trans-C2′-H), and points away from the base in the dC3 and dC4 adducts (cis-C2′-H). This difference in yields may be understood in terms of the orientation of the bulky 2′-OH group towards the nucleobase target atoms in the case of the C1/dC1 and C2/dC2, thus lowering the probability of formation of the cyclic products; however, in the case of the C3/dC3 and C4/dC4 adducts this steric hindrance effect is absent, thus favoring a higher reaction yield of the latter products. We conclude that the smaller reaction yields of dC1/dC2 (or C1/C2) relative to the yields of the stereoisomeric dC3/dC4 (or C3/C4) are due to the absolute configurations of the -OH group at C2′.
Analysis of 4-OHEN-A/dA adducts
The 4-OHEN adenine adducts have the same linkage site, stereochemical characteristics, and rigid conformations as the cytosine adducts (Figure 1). The stereochemistry in both cases is governed by the same chiralities of the C2′ and C3′ atoms at the 4-OHEN-base linkage site. As in the case of the 4-OHEN-dC adducts, the reaction yields of the two late-eluting 4-OHEN-dA3 and -dA4 fractions are significantly larger than those of the earlier-eluting 4-OHEN-A1 and -A2 fractions (12). The above mass spectrometric analysis of the absolute configurations of the 4-OHEN-dC3 and –dC4 adducts, indicates that the C2′ OH group in the bridge is directed in the opposite direction relative to the attached base ring system. Therefore, by analogy, the 4-OHEN-dA3 and –dA4 adducts correspond to the 1′S,2′R,3′R-4-OHEN-dA3 and 1′R,2′S,3′S-4-OHEN-dA4 stereoisomeric pair. These conclusions are consistent with the assignments of the absolute configurations of the C2′ OH groups in the two major, late-eluting 4-OHEN-dA adducts based on previous MS/MS experiments by Embrechts et al. (10), and also the lower reaction yields of the dA1 and dA2 adducts (12). Furthermore, as in the 4-OHEN-dC3 and -dC4 adducts, the higher reaction yields of the late-eluting 4-OHEN-dA3 and -dA4 adducts is also consistent with the orientation of the C2′ OH group away from the reaction site at the 4-OHEN-dA interface. The minor yield 4-OHEN-dA1 and -dA2 pair then correspond to the 1′S,2′S,3′R-4-OHEN-A1 and 1′R,2′R,3′S-4-OHEN-A2 pair. However, MS/MS methods cannot distinguish the absolute configurations of the C1′-C2′-C3′ bicyclo[3.3.1]nonane type linkage site bridge. Using the same approach as described above for the 4-OHEN-C adducts, we have experimentally measured the ORD spectra in the > 350 nm wavelength range and compared the signs of the calculated ORD values with the signs of the measured ORD. An example for the major 4-OHEN adenine adducts is shown in Figure S3 in Supporting Information, and the assignments are summarized in Table 2. In this case measurements were performed for the 4-OHEN-dA nucleoside adducts while the computations were for the 4-OHEN-A base adducts. However, base and nucleoside adducts have very similar measured ORD spectra in the case of the 4-OHEN-C/dC adducts, demonstrating that the deoxyribose ring contributes very little to the optical activities of the configurationally related 4-OHEN-dA and dC adducts
Table 2.
Assignments of absolute configurations of 4-OHEN adenine adducts.
| Structures (from Figure 1) | 4-OHEN-A1 | 4-OHEN-A2 | 4-OHEN-A3 | 4-OHEN-A4 |
|---|---|---|---|---|
| Absolute Configurations | 1′S,2′S,3′R | 1′R,2′R,3′S | 1′S,2′R,3′R | 1′R,2′S,3′S |
| 2′-deoxyadenosine adduct* | dA1 | dA2 | dA3 | dA4 |
| ORD > 396 nm | Positive | Negative | Positive | Negative |
| CD (~ 280 nm) | Negative | Positive | Negative | Positive |
Elution order in reversed phase C18 column HPLC experiments
Summary and Conclusions
An approach based on the combined methods of ECD and ORD, molecular modeling, computation of the wavelength-dependent ECD and ORD, and MS/MS fragmentation patterns, was utilized to determine the absolute configurations of the four stereoisomeric 4-OHEN-C/dC adducts. The computed signs of the ORD and the increasing or decreasing magnitudes of the computed ORD with decreasing wavelength, rather than the absolute values of the specific rotation [α]λ, are deemed sufficient for identifying the absolute configurations of the stereoisomeric adducts. The positive or negative signs of the ORD signals distinguish stereoisomers with opposite orientations of the C1′-C2′-C3′ bicyclo[3.3.1]nonane type linkage site bridge that links the 4-OHEN and cytosine base moieties, and the results are consistent with ECD calculations and measurements. While this method cannot distinguish the differing orientations of the -H and -OH subsituents at the C2′ carbon atom, these orientations can be distinguished by mass spectrometric fragmentation methods. The molecular architectures of the 4-OHEN-dA adducts at the linkage site are identical to those of their 4-OHEN-dC counterparts, and hence the 4-OHEN-dA absolute configurations were deduced from comparison of the experimental and computed wavelength dependence of their ORD values. These assignments now permit relating differential biological processing of the various stereoisomers with their structures (17).
Supplementary Material
Supporting Information Available:
Table S1 gives calculated ORD values as a function of dihedral angles H-O-C3′-C2′ and H-O-C2′-C1′. Table S2 gives calculated OR values at the sodium D line (589 nm) using B3LYP functional. Figure S1 shows positive ion electrospray MS3 spectra of the m/z 480 product ions formed from the protonated molecules of m/z 524 of the 4OHEN-dCn adducts detected as fractionated by the HPLC elution experiment. Figure S2 shows proposed fragmentation pathways for the protonated molecules of the isomeric 4-OHEN-dC1 and 4-OHEN-dC2 adducts. Figure S3 shows comparison of experimental ORD spectra of dA3 and dA4 and calculated ORD values for 4-OHEN-A3 and A4 adenine adducts. This material is available free of charge via the Internet at http://pubs.acs.org.
Acknowledgments
The experimental portion of this work was supported by the National Institutes of Health, National Cancer Institute Grant CA112412 (N.E.G.) and the computational aspects were supported by Grants CA-75449 (S.B.). Components of this work were conducted in the Shared Instrumentation Facility at NYU that was constructed with support from Research Facilities Improvement Grant C06 RR-16572 from the National Center for Research Resources, NIH. Some of the mass spectrometry experiments were conducted with an Agilent 1100 Series Capillary LCMSD Ion Trap XCT Mass Spectrometer system purchased with the assistance of Grant CHE-0234863 from the National Science Foundation. The content is solely the responsibility of the authors and does not necessarily represent the official views of the National Cancer Institute or the National Institutes of Health. Computations were performed on SGI workstations at the Information Technology Services of New York University and on our own cluster of Silicon Graphic Origin supercomputers and Dell precision 490n workstations. Partial support for computational infrastructure and systems management was also provided by Grant CA-28038 (S.B.).
Abbreviations
- 4-OHEN
4-hydroxyequilenin
- 4-OHEN-G
4-hydroxyequilenin-guanine
- 4-OHEN-A
4-hydroxyequilenin-adenine
- 4-OHEN-C
4-hydroxyequilenin-cytosine
- dC
2′-deoxycytidine, and C, cytosine
- dG
2′-deoxyguanosine
- dA
2′-deoxyadenosine, and A adenine
- DFT
density functional theory
- ORD
optical rotatory dispersion
- ECD
electronic circular dichroism
- QM
quantum mechanics
References
- 1.Hersh AL, Stefanick ML, Stafford RS. National use of postmenopausal hormone therapy: annual trends and response to recent evidence. Jama. 2004;291:47–53. doi: 10.1001/jama.291.1.47. [DOI] [PubMed] [Google Scholar]
- 2.Rossouw JE, Anderson GL, Prentice RL, LaCroix AZ, Kooperberg C, Stefanick ML, Jackson RD, Beresford SA, Howard BV, Johnson KC, Kotchen JM, Ockene J. Risks and benefits of estrogen plus progestin in healthy postmenopausal women: principal results From the Women’s Health Initiative randomized controlled trial. Jama. 2002;288:321–333. doi: 10.1001/jama.288.3.321. [DOI] [PubMed] [Google Scholar]
- 3.Bolton JL. Quinoids, quinoid radicals, and phenoxyl radicals formed from estrogens and antiestrogens. Toxicology. 2002;177:55–65. doi: 10.1016/s0300-483x(02)00195-6. [DOI] [PubMed] [Google Scholar]
- 4.Bolton JL, Pisha E, Zhang F, Qiu S. Role of quinoids in estrogen carcinogenesis. Chem Res Toxicol. 1998;11:1113–1127. doi: 10.1021/tx9801007. [DOI] [PubMed] [Google Scholar]
- 5.Zhang F, Chen Y, Pisha E, Shen L, Xiong Y, van Breemen RB, Bolton JL. The major metabolite of equilin, 4-hydroxyequilin, autoxidizes to an o-quinone which isomerizes to the potent cytotoxin 4-hydroxyequilenin-o-quinone. Chem Res Toxicol. 1999;12:204–213. doi: 10.1021/tx980217v. [DOI] [PubMed] [Google Scholar]
- 6.Pisha E, Lui X, Constantinou AI, Bolton JL. Evidence that a metabolite of equine estrogens, 4-hydroxyequilenin, induces cellular transformation in vitro. Chem Res Toxicol. 2001;14:82–90. doi: 10.1021/tx000168y. [DOI] [PubMed] [Google Scholar]
- 7.Chen Y, Liu X, Pisha E, Constantinou AI, Hua Y, Shen L, van Breemen RB, Elguindi EC, Blond SY, Zhang F, Bolton JL. A metabolite of equine estrogens, 4-hydroxyequilenin, induces DNA damage and apoptosis in breast cancer cell lines. Chem Res Toxicol. 2000;13:342–350. doi: 10.1021/tx990186j. [DOI] [PubMed] [Google Scholar]
- 8.Li Y, Yao J, Chang M, Cuendet M, Bolton JL. Altered apoptotic response in MCF 10A cells treated with the equine estrogen metabolite, 4-hydroxyequilenin. Toxicol Lett. 2004;154:225–233. doi: 10.1016/j.toxlet.2004.08.006. [DOI] [PubMed] [Google Scholar]
- 9.Zhang F, Swanson SM, van Breemen RB, Liu X, Yang Y, Gu C, Bolton JL. Equine estrogen metabolite 4-hydroxyequilenin induces DNA damage in the rat mammary tissues: formation of single-strand breaks, apurinic sites, stable adducts, and oxidized bases. Chem Res Toxicol. 2001;14:1654–1659. doi: 10.1021/tx010158c. [DOI] [PubMed] [Google Scholar]
- 10.Embrechts J, Lemiere F, Van Dongen W, Esmans EL. Equilenin-2′-deoxynucleoside adducts: analysis with nano-liquid chromatography coupled to nano-electrospray tandem mass spectrometry. J Mass Spectrom. 2001;36:317–328. doi: 10.1002/jms.136. [DOI] [PubMed] [Google Scholar]
- 11.Shen L, Qiu S, Chen Y, Zhang F, van Breemen RB, Nikolic D, Bolton JL. Alkylation of 2′-deoxynucleosides and DNA by the Premarin metabolite 4-hydroxyequilenin semiquinone radical. Chem Res Toxicol. 1998;11:94–101. doi: 10.1021/tx970181r. [DOI] [PubMed] [Google Scholar]
- 12.Kolbanovskiy A, Kuzmin V, Shastry A, Kolbanovskaya M, Chen D, Chang M, Bolton JL, Geacintov NE. Base selectivity and effects of sequence and DNA secondary structure on the formation of covalent adducts derived from the equine estrogen metabolite 4-hydroxyequilenin. Chem Res Toxicol. 2005;18:1737–1747. doi: 10.1021/tx050190x. [DOI] [PubMed] [Google Scholar]
- 13.Yan S, Wu M, Ding S, Geacintov NE, Broyde S. Conformational analysis of a 4-hydroxyequilenin Guanine adduct using density functional theory. Chem Res Toxicol. 2002;15:648–653. doi: 10.1021/tx0101797. [DOI] [PubMed] [Google Scholar]
- 14.Ding S, Shapiro R, Geacintov NE, Broyde S. Conformations of stereoisomeric base adducts to 4-hydroxyequilenin. Chem Res Toxicol. 2003;16:695–707. doi: 10.1021/tx0340246. [DOI] [PubMed] [Google Scholar]
- 15.Ding S, Shapiro R, Geacintov NE, Broyde S. Equilenin-derived DNA adducts to cytosine in DNA duplexes: structures and thermodynamics. Biochemistry. 2005;44:14565–14576. doi: 10.1021/bi051090t. [DOI] [PubMed] [Google Scholar]
- 16.Ding S, Shapiro R, Geacintov NE, Broyde S. 4-hydroxyequilenin-adenine lesions in DNA duplexes: stereochemistry, damage site, and structure. Biochemistry. 2007;46:182–191. doi: 10.1021/bi061652o. [DOI] [PMC free article] [PubMed] [Google Scholar]
- 17.Ding S, Shapiro R, Cai Y, Geacintov NE, Broyde S. Conformational Properties of Equilenin-DNA Adducts: Stereoisomer and Base Effects. Chemical research in toxicology. 2008 doi: 10.1021/tx800010u. [DOI] [PMC free article] [PubMed] [Google Scholar]
- 18.Embrechts J, Lemiere F, Van Dongen W, Esmans EL, Buytaert P, Van Marck E, Kockx M, Makar A. Detection of estrogen DNA-adducts in human breast tumor tissue and healthy tissue by combined nano LC-nano ES tandem mass spectrometry. J Am Soc Mass Spectrom. 2003;14:482–491. doi: 10.1016/S1044-0305(03)00130-2. [DOI] [PubMed] [Google Scholar]
- 19.Yasui M, Matsui S, Laxmi YR, Suzuki N, Kim SY, Shibutani S, Matsuda T. Mutagenic events induced by 4-hydroxyequilin in supF shuttle vector plasmid propagated in human cells. Carcinogenesis. 2003;24:911–917. doi: 10.1093/carcin/bgg029. [DOI] [PubMed] [Google Scholar]
- 20.Chen DD, Oum L, Kolbanovskiy A, Kuzmin V, Shastry A, Chang MS, Bolton JL, Geacintov N. Translesion synthesis and nucleotide excision repair of site specifically modified oligodeoxyribonucleotides containing single lesions derived from the equine estrogen metabolite 4-OHEN. Chemical Research in Toxicology. 2004;17:1782–1782. [Google Scholar]
- 21.Suzuki N, Yasui M, Santosh Laxmi YR, Ohmori H, Hanaoka F, Shibutani S. Translesion synthesis past equine estrogen-derived 2′-deoxycytidine DNA adducts by human DNA polymerases eta and kappa. Biochemistry. 2004;43:11312–11320. doi: 10.1021/bi049273n. [DOI] [PubMed] [Google Scholar]
- 22.Yasui M, Suzuki N, Liu X, Okamoto Y, Kim SY, Laxmi YR, Shibutani S. Mechanism of translesion synthesis past an equine estrogen-DNA adduct by Y-family DNA polymerases. J Mol Biol. 2007;371:1151–1162. doi: 10.1016/j.jmb.2007.06.009. [DOI] [PMC free article] [PubMed] [Google Scholar]
- 23.Yasui M, Laxmi YR, Ananthoju SR, Suzuki N, Kim SY, Shibutani S. Translesion Synthesis Past Equine Estrogen-Derived 2′-Deoxyadenosine DNA Adducts by Human DNA Polymerases eta and kappa. Biochemistry. 2006;45:6187–6194. doi: 10.1021/bi0525324. [DOI] [PMC free article] [PubMed] [Google Scholar]
- 24.Chen D. Department of Chemistry. New York University; New York: 2006. Nucleotide Excision Repair and Translesion Synthesis of DNA Adducts Derived from the Equine Estrogen Metabolite 4-hydroxyequilenin. [Google Scholar]
- 25.Ruud K, Helgaker T. Optical rotation studied by density-functional and coupled-cluster methods. Chem Phys Lett. 2002;352:533–539. [Google Scholar]
- 26.Polavarapu PL. Ab initio molecular optical rotations and absolute configurations. Mol Phys. 1997;91:551–554. [Google Scholar]
- 27.Polavarapu PL, Chakraborty DK. Absolute stereochemistry of chiral molecules from ab initio theoretical and experimental molecular optical rotations. J Am Chem Soc. 1998;120:6160–6164. [Google Scholar]
- 28.Kondru RK, Wipf P, Beratan DN. Theory-assisted determination of absolute stereochemistry for complex natural products via computation of molar rotation angles. J Am Chem Soc. 1998;120:2204–2205. [Google Scholar]
- 29.Cheeseman JR, Frisch MJ, Devlin FJ, Stephens PJ. Hartree-Fock and density functional theory ab initio calculation of optical rotation using GIAOs: Basis set dependence. J Phys Chem A. 2000;104:1039–1046. [Google Scholar]
- 30.Stephens PJ, Devlin FJ, Cheeseman JR, Frisch MJ, Mennucci B, Tomasi J. Prediction of optical rotation using density functional theory: 6,8-dioxabicyclo[3.2.1]octanes. Tetrahedron-Asymmetr. 2000;11:2443–2448. [Google Scholar]
- 31.Stephens PJ, Devlin FJ, Cheeseman JR, Frisch MJ. Calculation of optical rotation using density functional theory. J Phys Chem A. 2001;105:5356–5371. [Google Scholar]
- 32.Grimme S. Calculation of frequency dependent optical rotation using density functional response theory. Chem Phys Lett. 2001;339:380–388. [Google Scholar]
- 33.Muller T, Wiberg KB, Vaccaro PH, Cheeseman JR, Frisch MJ. Cavity ring-down polarimetry (CRDP): theoretical and experimental characterization. J Opt Soc Am B. 2002;19:125–141. [Google Scholar]
- 34.Stephens PJ, Mccann DM, Cheeseman JR, Frisch MJ. Determination of absolute configurations of chiral molecules using ab initio time-dependent density functional theory calculations of optical rotation: How reliable are absolute configurations obtained for molecules with small rotations? Chirality. 2005;17:S52–S64. doi: 10.1002/chir.20109. [DOI] [PubMed] [Google Scholar]
- 35.Giorgio E, Viglione RG, Zanasi R, Rosini C. Ab initio calculation of optical rotatory dispersion (ORD) curves: A simple and reliable approach to the assignment of the molecular absolute configuration. J Am Chem Soc. 2004;126:12968–12976. doi: 10.1021/ja046875l. [DOI] [PubMed] [Google Scholar]
- 36.Giorgio E, Roje M, Tanaka K, Hamersak Z, Sunjic V, Nakanishi K, Rosini C, Berova N. Determination of the absolute configuration of flexible molecules by ab initio ORD calculations: A case study with cytoxazones and isocytoxazones. Journal of Organic Chemistry. 2005;70:6557–6563. doi: 10.1021/jo048023+. [DOI] [PubMed] [Google Scholar]
- 37.Giorgio E, Tanaka K, Verotta L, Nakanishi K, Berova N, Rosini C. Determination of the absolute configurations of flexible molecules: synthesis and theoretical simulation of electronic circular dichroism/optical rotation of some pyrrolo[2,3-b]indoline alkaloids--a case study. Chirality. 2007;19:434–445. doi: 10.1002/chir.20395. [DOI] [PubMed] [Google Scholar]
- 38.Shen L, Pisha E, Huang Z, Pezzuto JM, Krol E, Alam Z, van Breemen RB, Bolton JL. Bioreductive activation of catechol estrogen-ortho-quinones: aromatization of the B ring in 4-hydroxyequilenin markedly alters quinoid formation and reactivity. Carcinogenesis. 1997;18:1093–1101. doi: 10.1093/carcin/18.5.1093. [DOI] [PubMed] [Google Scholar]
- 39.Durandin A, Jia L, Crean C, Kolbanovskiy A, Ding S, Shafirovich V, Broyde S, Geacintov NE. Assignment of absolute configurations of the enantiomeric spiroiminodihydantoin nucleobases by experimental and computational optical rotatory dispersion methods. Chem Res Toxicol. 2006;19:908–913. doi: 10.1021/tx060078e. [DOI] [PubMed] [Google Scholar]
- 40.Frisch MJ, Trucks GW, Schlegel HB, Scuseria GE, Robb MA, Cheeseman JR, Montgomery JJA, Vreven T, Kudin KN, Burant JC, Millam JM, Iyengar SS, Tomasi J, Barone V, Mennucci B, Cossi M, Scalmani G, Rega N, Petersson GA, Nakatsuji H, Hada M, Ehara M, Toyota K, Fukuda R, Hasegawa J, Ishida M, Nakajima T, Honda Y, Kitao O, Nakai H, Klene M, Li X, Knox JE, Hratchian HP, Cross JB, Bakken V, Adamo C, Jaramillo J, Gomperts R, Stratmann RE, Yazyev O, Austin AJ, Cammi R, Pomelli C, Ochterski JW, Ayala PY, Morokuma K, Voth GA, Salvador P, Dannenberg JJ, Zakrzewski VG, Dapprich S, Daniels AD, Strain MC, Farkas O, Malick DK, Rabuck AD, Raghavachari K, Foresman JB, Ortiz JV, Cui Q, Baboul AG, Clifford S, Cioslowski J, Stefanov BB, Liu G, Liashenko A, Piskorz P, Komaromi I, Martin RL, Fox DJ, Keith T, Al-Laham MA, Peng CY, Nanayakkara A, Challacombe M, Gill PMW, Johnson B, Chen W, Wong MW, Gonzalez C, Pople JA. Gaussian, Gaussian 03, Revision C.02 ed. Gaussian, Inc; Wallingford CT: 2004. [Google Scholar]
- 41.Diedrich C, Grimme S. Systematic investigation of modern quantum chemical methods to predict electronic circular dichroism spectra. J Phys Chem A. 2003;107:2524–2539. [Google Scholar]
- 42.Giorgio E, Tanaka K, Verotta L, Nakanishi K, Berova N, Rosini C. Determination of the absolute configurations of flexible molecules: Synthesis and theoretical simulation of electronic circular dichroism/optical rotation of some pyrrolo[2,3-b]indoline alkaloids - A case study. Chirality. 2007;19:434–445. doi: 10.1002/chir.20395. [DOI] [PubMed] [Google Scholar]
- 43.Becke AD. Density-Functional Exchange-Energy Approximation with Correct Asymptotic-Behavior. Phys Rev A. 1988;38:3098–3100. doi: 10.1103/physreva.38.3098. [DOI] [PubMed] [Google Scholar]
- 44.Lee CT, Yang WT, Parr RG. Development of the Colle-Salvetti Correlation-Energy Formula into a Functional of the Electron-Density. Phys Rev B. 1988;37:785–789. doi: 10.1103/physrevb.37.785. [DOI] [PubMed] [Google Scholar]
- 45.Becke AD. Density-Functional Thermochemistry .3 The Role of Exact Exchange. J Chem Phys. 1993;98:5648–5652. [Google Scholar]
- 46.Ruud K, Taylor PR, Astrand PO. Zero-point vibrational effects on optical rotation. Chem Phys Lett. 2001;337:217–223. doi: 10.1021/ja004160m. [DOI] [PubMed] [Google Scholar]
- 47.Ruud K, Stephens PJ, Devlin FJ, Taylor PR, Cheeseman JR, Frisch MJ. Coupled-cluster calculations of optical rotation. Chem Phys Lett. 2003;373:606–614. [Google Scholar]
- 48.Wiberg KB, Vaccaro PH, Cheeseman JR. Conformational effects on optical rotation. 3-substituted 1-butenes. J Am Chem Soc. 2003;125:1888–1896. doi: 10.1021/ja0211914. [DOI] [PubMed] [Google Scholar]
- 49.Wiberg KB, Wang YG, Vaccaro PH, Cheeseman JR, Trucks G, Frisch MJ. Optical activity of 1-butene, butane, and related hydrocarbons. J Phys Chem A. 2004;108:32–38. [Google Scholar]
- 50.Tam MC, Russ NJ, Crawford TD. Coupled cluster calculations of optical rotatory dispersion of (S)-methyloxirane. J Chem Phys. 2004;121:3550–3557. doi: 10.1063/1.1772352. [DOI] [PubMed] [Google Scholar]
Associated Data
This section collects any data citations, data availability statements, or supplementary materials included in this article.
Supplementary Materials
Supporting Information Available:
Table S1 gives calculated ORD values as a function of dihedral angles H-O-C3′-C2′ and H-O-C2′-C1′. Table S2 gives calculated OR values at the sodium D line (589 nm) using B3LYP functional. Figure S1 shows positive ion electrospray MS3 spectra of the m/z 480 product ions formed from the protonated molecules of m/z 524 of the 4OHEN-dCn adducts detected as fractionated by the HPLC elution experiment. Figure S2 shows proposed fragmentation pathways for the protonated molecules of the isomeric 4-OHEN-dC1 and 4-OHEN-dC2 adducts. Figure S3 shows comparison of experimental ORD spectra of dA3 and dA4 and calculated ORD values for 4-OHEN-A3 and A4 adenine adducts. This material is available free of charge via the Internet at http://pubs.acs.org.