Abstract
Background
Spatially discordant alternans (SDA) has been linked to life-threatening arrhythmias. The mechanisms underlying SDA development in cardiac tissue remain unclear.
Methods and Results
We investigated the role of conduction velocity (CV) restitution and short-term memory in the organization and evolution of alternans in action potential duration using high-resolution optical mapping of the epicardial surface in 8 isolated, Langendorff-perfused rabbit hearts. To assess the spatial organization of alternans, we tracked the evolution of nodal lines that separate out-of-phase regions of SDA. We measured the action potential duration heterogeneity index and maximal slope of CV restitution and estimated the effects of short-term memory by calculating time constant of action potential duration accommodation (τ). We found that 2 mechanisms underlie the development of SDA in the heart, leading to 2 distinct behaviors of nodal lines. The first mechanism is based on steep CV restitution and is associated with small τ and stable nodal lines. The second mechanism is associated with short-term memory (large τ) and is characterized by shallow CV restitution and unstable behavior of nodal lines. The maximum slope of the CV restitution was steeper (18.16±3.34 m/s2) and τ was smaller (τ=4.31±0.33 stimuli) for areas with stable nodal lines than for areas with unstable nodal lines (6.32±0.96 m/s2 and τ=10.3±1.84 stimuli; P<0.01).
Conclusions
Our results provide new insight into the mechanisms underlying SDA formation in the rabbit heart. Specifically, our results suggest that a new mechanism associated with short-term memory underlies SDA formation in the heart, in addition to steep CV restitution.
Keywords: action potentials, alternans, mapping, memory, restitution
T-wave alternans is a precursor of cardiac electrical instability and consequently sudden cardiac death.1,2 T-wave alternans results from action potential duration (APD) alternans. APD alternans can be spatially concordant (SCA), when all cells from different spatial locations oscillate in phase, or spatially discordant (SDA), when neighboring regions of cells alternate with the opposite phase. These discordant regions are separated by a nodal line in which no alternans is present. SDA causes an increase in the spatial dispersion in the repolarization, whereas in theory, considerable SCA may occur with minimal dispersion of repolarization. Therefore, SDA is thought to be proarrhythmic3-5; however, its underlying mechanism remains unclear.
CLINICAL PERSPECTIVE.
T-wave alternans often are a precursor to ventricular fibrillation and thus sudden cardiac death. It has been suggested that spatially discordant alternans (SDA) of action potential duration may lead to T-wave alternans, but the underlying mechanisms of SDA development are not clear. Previous studies have proposed preexisting action potential duration heterogeneities and steep dependence of conduction velocity in the myocardium on the preceding diastolic interval as possible causes of SDA. Our experiments demonstrate that a new mechanism associated with pacing history, ie, short-term memory, might also underlie SDA formation in the heart. In addition, we show that the heterogeneity of action potential duration does not necessarily correlate with the onset of alternans. Our findings have significant clinical relevance because they suggest that new dynamic factors such as the rate at which the heart muscle is paced also may play a role in the development of SDA and subsequently ventricular fibrillation. This suggests that cardiac memory needs to be considered an additional factor that can contribute to arrhythmia initiation. Ultimately, our findings can be used to define a new paradigm in the clinic for testing arrhythmia inducibility and need to be considered in the design of antiarrhythmic drugs.
Two possible mechanisms have been proposed to explain the appearance of SDA. The first requires the presence of preexisting heterogeneities, and SDA can be formed via an appropriately timed stimulus or a change in pacing rate.5-7 Because in heterogeneous tissue alternans amplitude varies spatially, it is possible to time a stimulus that reverses the alternans phase in one part of the tissue.7 The SDA will appear around locations of heterogeneity immediately as pacing rate increases.8 However, several numerical studies have suggested that tissue heterogeneity is not essential for the formation of SDA. The second mechanism proposed for SDA is based on a steep conduction velocity (CV) restitution mechanism, ie, when CV of a propagating wave has a steep dependence on the preceding diastolic interval.9-13 In addition, some studies have suggested that both tissue heterogeneity and steep CV restitution can be involved in the formation of SDA.14,15
Recently, Hayashi et al8 demonstrated that these 2 mechanisms can be distinguished by the behavior of the nodal lines. Their elegant numerical study shows that if SDA develops by the first mechanism, ie, heterogeneity, nodal lines would form at locations dictated by underlying tissue heterogeneity with 2 different scenarios. First, in the case of APD heterogeneity, once a nodal line forms, it can drift away from the pacing site on a beat-to-beat basis without reaching a steady state. Second, in the case of heterogeneity of intracellular Ca2+ cycling, the nodal line may reach a steady state and remain pinned at the original position despite acceleration of the pacing rate. In contrast, if SDA develops through the second mechanism, ie, steep CV restitution, nodal lines reach steady state and move toward the pacing site as the pacing rate increases. Hayashi et al8 also presented some indirect experimental evidence that this mechanism is responsible for alternans formation in the isolated rabbit heart. In particular, they showed the presence of a steep CV restitution but were unable to detect CV alternans, which must accompany the SDA formed by this mechanism.9
Because the behavior of nodal lines has been shown to be crucial in determining the underlying mechanism of SDA, here we use an approach similar to that of Hayashi et al8 to investigate experimentally the organization and evolution of SDA in the ventricles of the isolated rabbit heart. Our results demonstrate that 2 different scenarios of the nodal line dynamics may be present in the same heart: Nodal lines can (1) remain stationary during pacing at constant rate and move toward the pacing site as the rate increases or (2) be unstable and undergo spatiotemporal evolution. We confirm that the first scenario is associated with a steep CV restitution, as demonstrated previously. In addition, we demonstrate experimentally for the first time the spatial distribution of CV alternans and its strong correlation with APD alternans. We demonstrate also that the second scenario is associated with short-term memory, ie, a slow change of APD in time after a change in the pacing rate.16-19
Methods
Whole-Heart Preparation
Animals (n=8) were used according to National Institutes of Health guidelines. New Zealand White rabbits of either sex (2.5 to 3 kg) were injected with heparin sulfate (300 U) and anesthetized with sodium pentobarbital (75 mg/kg IV). After thoracotomy, the hearts were quickly removed and immersed in cardioplegic solution containing (mmol/L) glucose 280, KCl 13.44, NaHCO3 12.6, and mannitol 34. The aorta was quickly cannulated and retrogradely perfused with warm (36±1°C) oxygenated Tyrode’s solution under constant pressure (70 mm Hg). The Tyrode’s solution contained (mmol/L) NaCl 130, CaCl2 1.8, KCl 4, MgCl2 1.0, NaH2PO4 1.2, NaHCO3 24, and glucose 5.5 (pH 7.4 adjusted with HCl). The hearts were immersed in a chamber and superfused with the same Tyrode’s solution; temperature was controlled (36±1°C). Blebbistatin (10 μmol/L) was added to the Tyrode’s solution to reduce motion artifacts.20
Optical Mapping System
A bolus of 5 mL of the dye Di-4-ANEPPS (10 μmol/L) was injected. A diode-pumped continuous-excitation green laser (532 nm, 1 to 5 W, Millenia Pro 5sJ, Spectra-Physics Inc, Mountain View, Calif) was used for excitation. Two fast charge-coupled device cameras (CA-D1-0128T, DALSA, Waterloo, Ontario, Canada) were used to record simultaneously from the anterior and posterior epicardial ventricular surfaces (>80% of total surface). Movies (8 seconds) were acquired at 600 frames per second, with 64×64-pixel resolution (0.4 mm per pixel). The background fluorescence was subtracted from each frame, and spatial (5×5 pixels) and temporal (9 pixels) conical convolution filters were used. A volume-conducted ECG was recorded.
Pacing Protocol
A dynamic pacing protocol was used in which the basic cycle length (BCL) was changed from 300 to 200 ms in steps of 20 ms and from 200 to 100 ms in steps of 5 ms. Two hundred stimuli were applied at each BCL to achieve steady state. Movies were taken to capture responses to the last 10 stimuli at each BCL (steady state) and during transition to a new BCL. We applied the pacing protocol 2 to 5 times in each heart while pacing from left and/or right ventricle bases. Overall, we successfully completed 27 runs of the pacing protocol in 8 hearts.
Parameter Measurements
Optical APDs were measured at 50% repolarization because incomplete repolarization at high pacing rate prevents assessment of APDs at 70% or 80% levels.
The local CV was measured as described previously.15,21 Specifically, the distributions of activation times for the spatial regions of 5×5 pixels were fitted with the plane, and gradients of activation times gx and gy were calculated for each plane along the x and y axes, respectively. The magnitude of the local CV was calculated for each pixel as (gx2+gy2)1/2. Mean values and SEs for CV were calculated for the visible anterior and posterior surfaces. The maximal slopes of CV restitution curves were calculated using fits with sigmoidal functions in Origin software (Origin 7.0, OriginLab Corp, Northampton, Mass).
Local alternans was measured by calculating the difference in APD and CV between odd and even beats as described previously.22 The amplitude of the APD and CV alternans was calculated as ΔAPD=|APDodd−APDeven| and ΔCV=|CVodd−CVeven|, respectively. The phase of alternans was positive for long-short APD sequences and fast-slow CV sequences (represented by red). The phase of alternans was negative for short-long APD sequences and slow-fast CV sequences (represented by blue).22 Nodal lines were defined as areas separating out-of-phase regions of discordant alternans in which the amplitude of alternans was below the threshold: ΔAPD<3 ms and ΔCV<3 cm/s. Two-dimensional alternans maps were constructed to reveal the spatial distribution of the amplitude and phase of the alternans. Mean values and SEs for steady-state APDs were calculated for the visible anterior and posterior surfaces as follows: during 1:1 response and SCA, for the odd and even APD maps separately; and during SDA, for the areas of longer and shorter APDs from the odd and even APD maps separately.
We calculated the APD heterogeneity index (μ) for the steady-state maps at each BCL according to the following formula15: μ=(APD95−APD5)/APD50, where APD95 and APD5 represent the 95th and 5th percentiles of the APD distribution, respectively, and APD50 is a median APD distribution.
The onset of SCA was defined as the BCL at which at least 5% of either the anterior or posterior surface displayed APD alternans >3 ms. The onset of SDA was defined as the BCL at which at least 5% of anterior of posterior surface displayed phase shift.
Statistical Analysis
Group data are presented as mean±SE. Statistical comparisons between posterior and anterior surfaces were performed with a paired 2-sample t test and Wilcoxon 2-sample nonparametric test. Fisher’s and McNemar’s tests were used to compare categorical variables between independent and dependent groups, respectively. Values of P<0.05 were considered statistically significant.
The authors had full access to and take full responsibility for the integrity of the data. All authors have read and agree to the manuscript as written.
Results
The Onset of SCA and SDA Is a Local Phenomenon
Typical examples of optical action potentials recorded by a single pixel during 1:1 responses and alternans are presented in Figure 1A. The steady-state alternans maps constructed at different values of BCL are displayed in Figure 1B for the anterior (top) and posterior (bottom) surfaces. At a BCL of 300 ms, both anterior and posterior surfaces demonstrate 1:1 responses shown as the absence of APD alternans (black). At a BCL of 155 ms in the same heart, the anterior surface has a 1:1 responses (black), and the posterior surface displays SCA (blue). At a BCL of 135 ms, both anterior and posterior surfaces display SDA shown as a combination of the blue and red areas separated by the black nodal lines. Figure 1B demonstrates that different regions of the heart can have different vulnerability to alternans.
Figure 1.
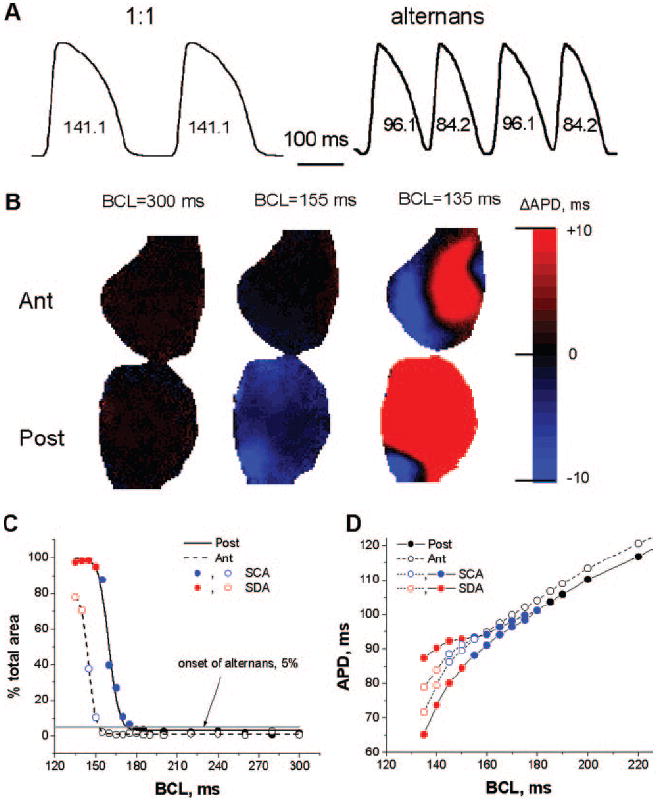
Formation of APD alternans in the rabbit heart. A, Typical single-pixel optical action potentials during 1:1 responses and alternans. B, Examples of steady-state alternans maps on posterior (Post) and anterior (Ant) surfaces for 3 different BCLs. C, Percentage of posterior (solid line) and anterior (dashed line) surfaces occupied by 1:1 responses (black), SCA (blue), and SDA (red). The onset of alternans was determined as 5% of the total area (gray horizontal line). D, Mean steady-state APD as a function of the BCL for posterior (●) and anterior (○) epicardial surfaces. Black, blue, and red represent 1:1 responses, SCA, and SDA, respectively.
In Figure 1C, we have quantified the percentage of total area occupied by the alternans on the posterior (solid line, filled circles) and anterior (dashed line, open circles) surfaces as a function of the BCL. We define the onset of alternans as the value of BCL at which at least 5% of the surface is occupied by alternans (gray horizontal line). The 1:1 responses are shown as black open and filled circles; SCA is shown in blue; and SDA is shown in red. SCA occurred at different values of BCL for the posterior and anterior surfaces and initially occupied a small percentage of the area. As BCL decreased, the area of SCA increased and rapidly transformed into SDA.
Figure 1D shows the steady-state mean APD on the anterior and posterior surfaces as a function of BCL. The magnitude of both SCA (blue) and SDA (red) increases as BCL decreases. For this particular example, the alternans is larger and appears at longer BCLs for the posterior than the anterior surfaces. The onset of SCA was 175 and 150 ms and the onset of the SDA was 150 and 140 ms for the posterior and anterior surfaces, respectively. SEs calculated for both surfaces are included in Figure 1D, but they are almost negligible.
Altogether, SCA was observed in 100% (27 of 27 attempts in 8 of 8 hearts), and SDA occurred in 85% (23 of 27 attempts in 7 of 8 hearts). SCA onset occurred at a shorter BCL for the anterior surface (160.1±5.87 ms) than for the posterior surface (170.45±5.53 ms; P<0.05). The SDA onset was not significantly different for the anterior (140.81±6.59 ms) and posterior (150.14±7.42 ms) surfaces. For each surface, SCA onset occurred at a longer BCL than SDA onset (P<0.05).
The Transition From SCA to SDA Is Time Dependent
After the BCL was changed from one value to another, the transition from SCA into SDA did not always occur instantaneously. Instead, in some areas, after a change in the BCL, the spatial organization of SDA was a dynamic, time-dependent process. A representative example is shown in Figure 2A for the posterior surface when BCL was decreased from 140 to 135 ms. The steady-state alternans map at a BCL of 140 ms is shown on the left; the alternans maps for consecutive stimulus numbers at a BCL of 135 ms are on the right. At a BCL of 140 ms, the presence of SCA is shown in blue. After a change in BCL to 135 ms, SCA is still present during the first 30 stimuli. At 34 stimuli, the phase of alternans had switched in some areas, as indicated by the appearance of red regions, and SDA had developed. The size of the red regions increases as the number of stimuli increases. Note that some regions keep the original phase (remain blue); ie, they display temporal concordant alternans (TCA) throughout the entire episode. Other regions change their phase (blue becomes red); ie, they display temporal discordant alternans (TDA). The regions that display either TCA or TDA at a BCL of 135 ms are indicated by the blue arrows and contour lines at 80 stimuli. For comparison, the same contour lines are shown at 34 stimuli. Note that the development of TDA is associated with the development of SDA, leading to increased APD heterogeneity.
Figure 2.
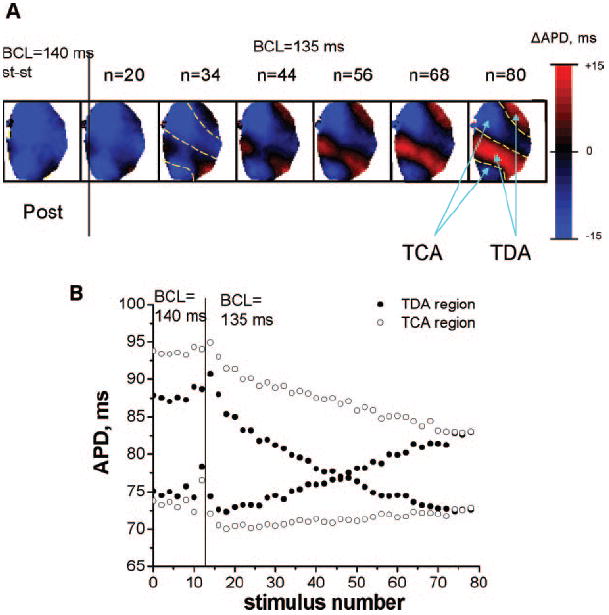
Temporal evolution of SDA. A, Examples of alternans maps from the posterior (Post) surfaces showing the development of SDA after the BCL was changed from 140 to 135 ms. The stimulus number is shown on top of each map. Note the eventual development of TCA and TDA regions indicated by the blue arrows and contour lines. The same contour lines are shown at 34 stimuli for comparison. B, Change in average APDs in the TCA (○) and TDA (●) regions (see n=80 stimuli, Figure 2A) at a BCL of 135 ms as the stimulus number increases.
In Figure 2B, we illustrate the temporal evolution of alternans in the TCA (open circles) and TDA (filled circles) regions from Figure 2A (n=80 stimuli) after a change in BCL from 140 to 135 ms. Note that for each region the alternans has 2 APDs, 1 long and 1 short, and the amplitude of alternans can be estimated as the difference between these APDs. The amplitude of the TDA region decreases over time, switches phase, and then increases. The amplitude of TCA decreases more slowly with time, suggesting that TDA might have developed later. We observed a time-dependent transition from SCA to SDA in 6 of 7 hearts.
Organization of the Nodal Lines in SDA
Numerical experiments have shown that the behavior of a nodal line reflects the underlying mechanism of SDA formation.8 Specifically, steady-state nodal lines are predicted to move toward the pacing site as the BCL decreases when SDA is induced dynamically by steep CV restitution. However, when SDA is due to tissue heterogeneities, nodal lines should form at locations dictated by the underlying tissue heterogeneity and either remain pinned or drift away from the pacing site without reaching a steady state, depending on whether the alternans is due to intracellular Ca2+ cycling or steep APD restitution.8
We tested the above predictions experimentally and investigated whether one or both types of behavior prevail in the isolated rabbit heart. First, we investigated the temporal evolution of the nodal lines during adaptation after changing from one value of BCL to another. A representative example of such behavior is shown in Figure 3A when the BCL was decreased from 140 to 135 ms. Our results indicate that the nodal lines can behave according to the 2 different scenarios. Nodal lines may remain at the same position after the BCL is changed during pacing, as shown here for the anterior surface. We have called this “stable” behavior. Or, in the same heart, nodal lines may undergo temporal evolution, as shown for the posterior surface. We designate this “unstable” behavior. In the latter case, the dynamics of the nodal lines are very complex and do not exhibit stable patterns. Nodal lines can drift in varying directions, toward or away from the pacing site, suggesting that APD heterogeneity cannot be the underlying mechanism for unstable nodal lines. For the particular case of Figure 3A, the 2 top unstable nodal lines on the posterior surface drift toward each other (see blue arrows) and mutually annihilate over time (see steady state at a BCL of 135 ms). Overall, of 23 pacing protocols leading to SDA formation in 7 hearts, we observed 10 (10) cases of stable (unstable) nodal lines on the posterior surfaces and 16 (6) cases of stable (unstable) nodal lines on the anterior surfaces (P=NS). Thus, overall, 62% of the nodal lines were stable and 38% were unstable.
Figure 3.
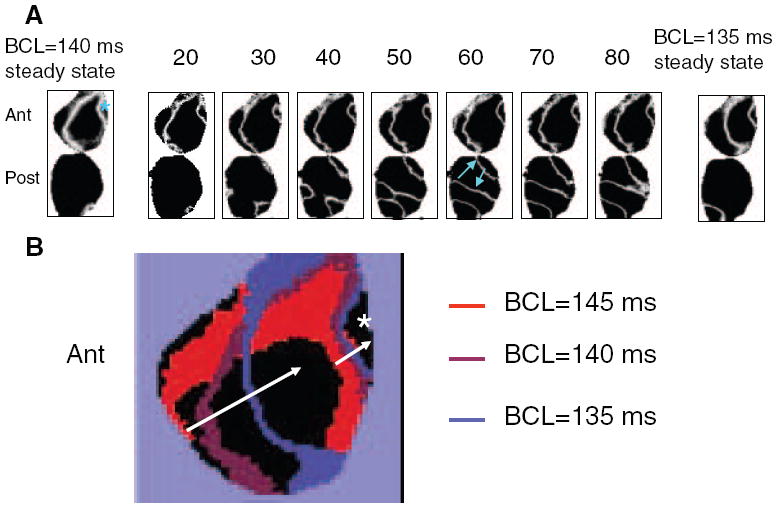
A, Temporal evolution of the nodal lines on anterior (Ant) and posterior (Post) surfaces as the BCL changes from 140 to 135 ms. Stimulus numbers are indicated on top of each map. Blue asterisk shows the location of the pacing electrode; blue arrows show the direction of nodal line drift as the stimulus number increases. B, Superposition of the stable nodal lines at steady state for different values of BCLs. The white arrow shows that nodal lines drift toward the pacing site (white asterisk) as BCL decreases.
Second, we investigated the positions of stable nodal lines at different values of BCL to determine whether they remained pinned or moved toward the pacing site as BCL decreased. Figure 3B illustrates the positions of the steady-state nodal lines at BCLs of 145 ms (red), 140 ms (violet), and 135 ms (blue). Two nodal lines are present at each value of BCL, 1 proximal and 1 distal to the pacing site (asterisk). As the BCL decreases, the nodal line drifts toward the pacing site (see arrows in Figure 3B). Thus, our results suggest that the steep CV restitution could be a possible mechanism of SDA formation8 for the case of stable nodal lines.
Heterogeneity of APD Does Not Correlate With the Onset of Alternans
Although the behavior of the unstable nodal lines described in the previous section suggested that tissue heterogeneity cannot be its underlying mechanism, we further investigated the relationship between the heterogeneity of APD and the onset of alternans in more detail. Figure 4A illustrates the dependence of the mean APD heterogeneity index (μ) from 8 hearts calculated separately for the anterior (open circles) and posterior (filled circles) surfaces for each BCL. As the BCL decreased, μ increased for both surfaces as described previously.5,15 At all BCLs, μ was not statistically significant between both anterior and posterior surfaces (P=NS).
Figure 4.
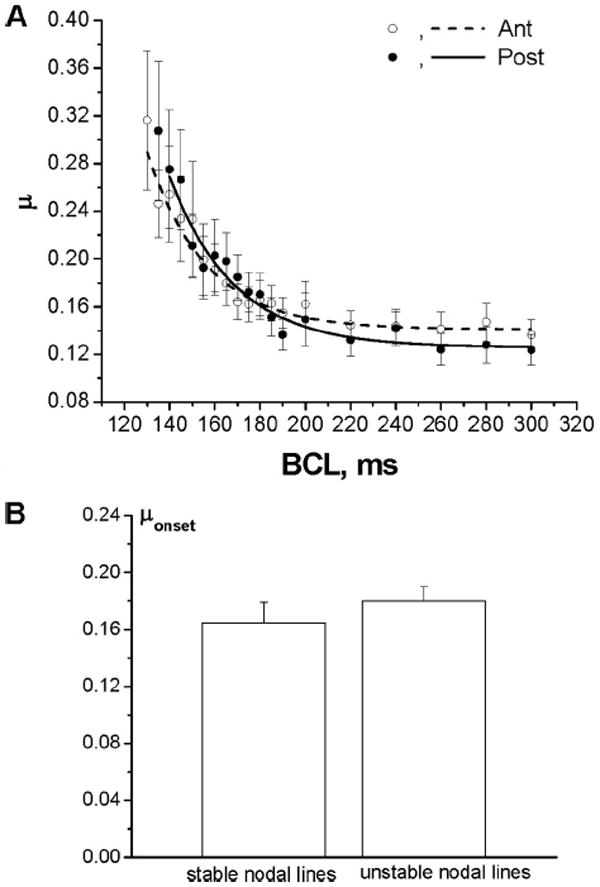
A, Mean APD heterogeneity index (μ) from 8 hearts as a function of BCL for the anterior (Ant) and posterior (Post) surfaces (P=NS for all BCLs). B, Mean values of μonset from 8 hearts calculated separately for the stable and unstable nodal lines are not significantly different (P=NS).
To determine whether the onset of alternans at the anterior and posterior surfaces is dependent on APD heterogeneity, we calculated the correlation between the following pairs: the onset of SCA and μonset and the onset of SDA and μonset, where μonset is μ measured at the onset of alternans. All 4 correlation coefficients of the linear regression functions calculated from 27 pacing protocols in 8 hearts were <0.5 (P>0.05), indicating the lack of significant correlation between μonset and the onset of alternans on either surface.
Figure 4B shows that μonset calculated separately for the stable and unstable nodal lines from 8 hearts are not significantly different (P=NS).
CV Restitution and Alternans
The behavior of the stable nodal lines at different BCLs described in Figure 3B suggested that steep CV restitution may underlie SDA formation in this case. Figure 5A shows mean CV restitution curves measured for the anterior (open circles) and posterior (filled circles) surfaces for that particular experiment. CV restitution is steeper on the anterior surface where the stable nodal lines are present than on posterior surface where nodal lines are unstable. These results were consistent throughout all our experiments: the maximum slope of the CV restitution curves measured in 8 hearts was steeper for the areas with stable nodal lines (18.16±3.34 m/s2) than for the areas with unstable nodal lines (6.32±0.96 m/s2; P<0.01). In contrast, the difference in the maximum slopes measured for the anterior (7.75±1.22 m/s2) and posterior (14.07±3.09 m/s2) surfaces was not significant statistically (P=NS).
Figure 5.
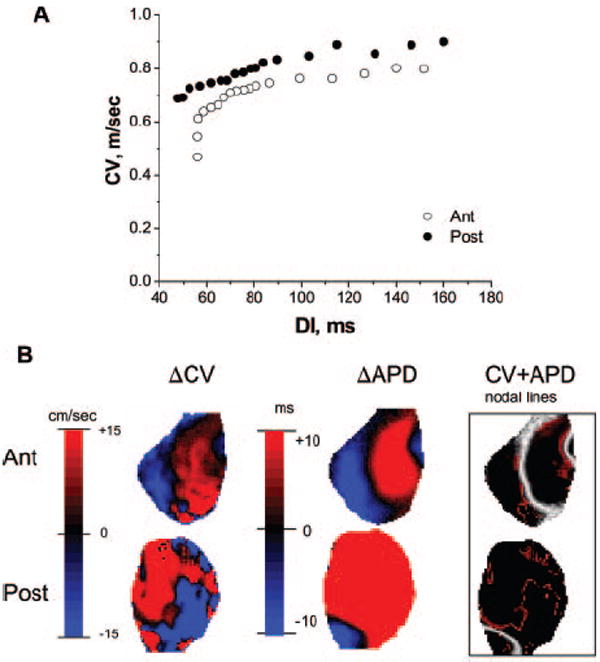
CV restitution and alternans. A, Mean CV restitution calculated for anterior (Ant; ○) and posterior (Post; ●) surfaces in a representative experiment. B, Steady-state alternans maps for posterior and anterior surfaces at a BCL of 135 ms showing alternans in CV (left), alternans in APD (middle), and superposition of their nodal lines (right). The APD and CV nodal lines are shown in white and red, respectively. DI indicates diastolic interval.
Numerical studies have predicted that alternans in APD should be accompanied by alternans in CV.9 However, although alternans in conduction time has been documented experimentally in single-electrode recordings,23 nothing is known about spatial distribution of CV alternans or about its correlation with APD alternans. Figure 5B (left) shows the amplitude map of CV alternans on the anterior and posterior surfaces (BCL=135 ms) in a representative experiment. For comparison, the APD alternans map recorded at the same BCL is shown in the middle, and a superposition of the CV (red lines) and APD (white lines) nodal lines is shown on the right. Clearly, although the CV and APD nodal lines correlate strongly on the anterior surface (stable nodal lines), they are not correlated on the posterior surface (unstable nodal lines).
Further quantification is presented in Figure 6, which illustrates the CV-to-APD relationships for all pixel values at a BCL of 135 ms on the anterior (top) and posterior (bottom) surfaces in experiment shown in Figure 5B. On the top, the amplitude and phase of APD alternans strongly correlate (P<0.01) with those of CV alternans. Positive (negative) CV alternans coincides with positive (negative) APD alternans on the anterior surface, where stable nodal lines are present. In contrast, no correlation was observed for the posterior surface (unstable nodal lines), where both positive and negative CV alternans exist for positive and negative APD alternans.
Figure 6.
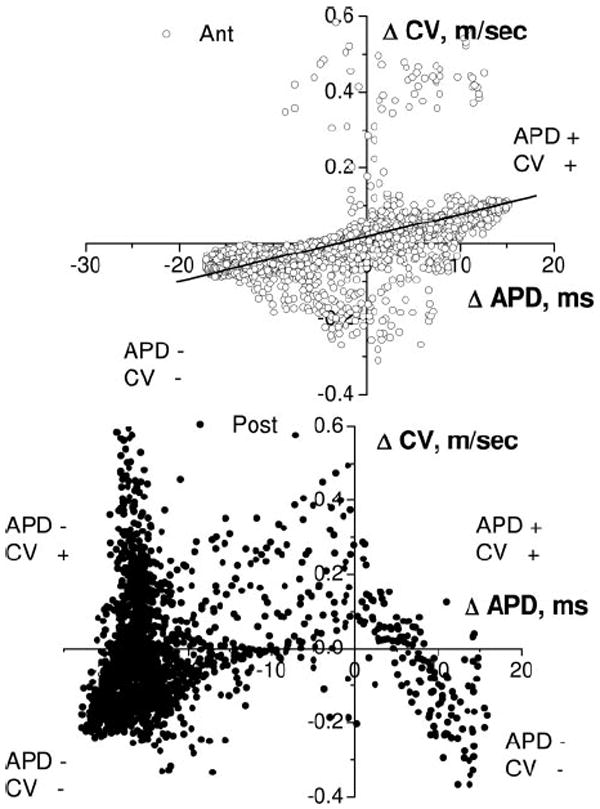
Correlation between APD and CV alternans at a BCL of 135 ms for the anterior (Ant; ○) and posterior (Post; ●) surfaces in experiment shown in Figure 5B. On the anterior surface, positive (negative) CV alternans correlates with positive (negative) APD alternans. On the posterior surface, both positive and negative CV alternans exist for positive and negative APD alternans.
Short-Term Memory and SDA
The behavior of the unstable nodal lines suggested that short-term memory, ie, dependence of APD on the entire pacing history and not just the immediately preceding diastolic interval, might be involved in SDA formation. It is well known16-19 that one of the consequences of short-term memory is slow APD accommodation on changing the pacing rate. Figure 7A illustrates the typical temporal evolution of the longer APD during alternans for single pixels on the anterior (open circles) and posterior (filled circles) surfaces after the BCL was changed from 140 to 135 ms. The data are calculated from the example shown in the Figure 3, in which nodal lines are stable (unstable) in the anterior (posterior) surfaces. The data were fitted with the exponential function APD=APD0+a×exp(−t/τ), and the time constant (τ) of APD accommodation was calculated for each pixel. The APD on the anterior surface reached steady state much faster (τ=2.03) than on the posterior surface (τ=18.64). It has been demonstrated that the longer it takes for the APD to reach a steady state after changing the BCL, the larger τ is and therefore the greater the amount of short-term memory in the tissue is.12,18,24
Figure 7.
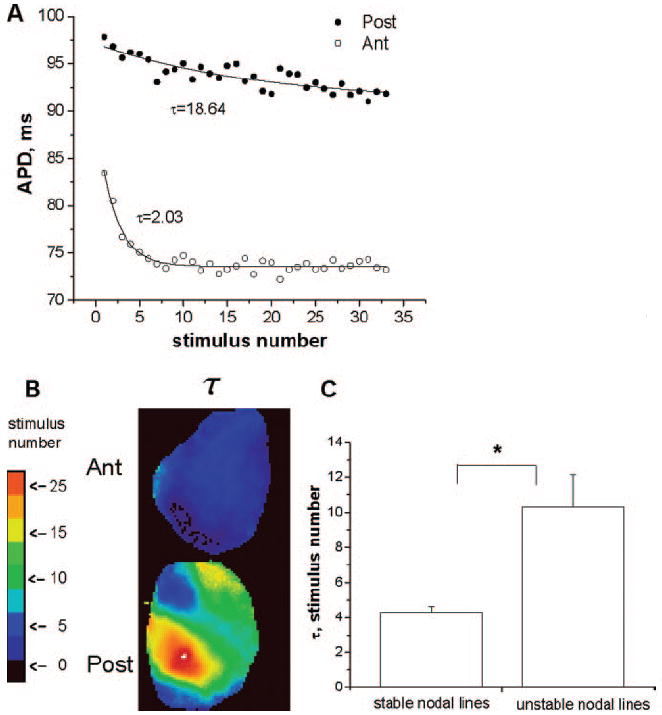
APD accommodation. A, Representative examples of the temporal evolution of the longer APD during alternans from 1 pixel on posterior (Post; ●) and anterior (ant; ○) surfaces after BCL was changed from 140 to 135 ms. B, Spatial distribution of τ for the posterior and anterior surfaces. C, Mean±SE of τ for stable and unstable nodal lines from 7 experiments.
The spatial distribution of τ on the posterior and anterior surfaces is presented in Figure 7B. Note the homogeneous distribution and small values of τ for the anterior surface, where nodal lines are stable. In contrast, the values of τ are much larger and the distribution of τ is much more heterogeneous on the posterior surface, where nodal lines exhibit unstable behavior. Figure 7C quantifies the mean values of τ calculated from 7 experiments for the cases with stable (n=26) and unstable (n=16) nodal lines. The difference is statistically significant (P<0.01).
Discussion
The major new findings of this study are as follows. First, the onset of alternans displays complex spatiotemporal dynamics. Second, the evolution of nodal lines during SDA shows 2 distinct behaviors at a given BCL. Nodal lines can remain at the same positions (stable behavior) or undergo drifting (unstable behavior). Third, stable nodal lines are associated with a steep CV restitution and are correlated with CV alternans, a numerical prediction that is borne out for the first time by our experiments. Fourth, the unstable nodal lines are consistent with the more pronounced effect of short-term memory, ie, larger time constant of APD accommodation. Finally, heterogeneity of APD does not correlate with the onset of alternans.
Temporal Evolution of Alternans
In the literature, there are numerous theoretical and experimental studies on APD alternans.5-15,22 For example, it is known that SCA can appear when the pacing rate is increased and become SDA when the pacing rate increases further. However, very little is known about the dynamical origin of the onset of alternans. Our results indicate for the first time that the onset of APD alternans is a local phenomenon that undergoes complex spatiotemporal dynamics. The onset of SCA is characterized not only by the value of BCL but also by the percentage of the heart surface at which SCA appears. The transition from SCA to SDA can occur via 2 different pathways. First, as the BCL decreases, the regions displaying SCA become larger, and the instantaneous transition to SDA occurs. Second, the transition to SDA occurs over time during adaptation.
SDA, Steep CV Restitution, and CV Alternans
Previously, a steep CV restitution was proposed theoretically as a possible mechanism of SDA formation in homogeneous tissues.9-15,22 Later, it was demonstrated, also theoretically, that a steep CV restitution results in stable nodal lines.8 It has been suggested that this mechanism is responsible for alternans formation in the whole rabbit heart. This suggestion was based on indirect experimental evidence such as the presence of a steep CV restitution and the drift of the nodal line toward the pacing site as the BCL decreases. However, direct evidence had not been obtained for the CV alternans that must accompany APD alternans as predicted by theory.9 Our results strongly suggest that a steep CV restitution is one possible mechanism of SDA in the isolated rabbit heart. We observed stable behavior of the nodal lines in 62% of our experiments. This behavior is associated with a steep CV restitution and with drifting of the nodal lines toward the pacing site as the BCL decreases. Moreover, we have demonstrated for the first time the spatial distribution of CV alternans and its strong correlation with APD alternans for this case. Specifically, we show that the positions of the nodal lines for the CV and APD alternans coincide.
SDA, APD Heterogeneity, and Short-Term Memory
Our results indicate that a steep CV restitution is not the only mechanism underlying SDA in the whole rabbit heart. Indeed, in 38% of our experiments, the nodal lines are unstable and are not associated with steep CV restitution. In this case, the nodal lines exhibit a complex spatiotemporal behavior as SDA slowly develops with time from SCA during adaptation on shortening of BCL.
Similar drifting of nodal lines has been described elsewhere8 when SDA was modeled in sharply heterogeneous tissue. In that study, when the BCL was changed, the nodal line appeared immediately at the border of a preexisting heterogeneity (of IK1) and drifted away from the pacing site. However, in our experiments, the behavior of unstable nodal lines is different. First, SDA alternans did not appear immediately as the BCL changed. Instead, there was a slow temporal transition from SCA to SDA. Second, nodal lines do drift during adaptation, but the direction of drift is seemingly unpredictable. To rule out the possibility that the unstable nodal lines result from APD heterogeneity, we demonstrated that the heterogeneity indexes measured at the onset of SCA μonset are not statistically different for stable and unstable nodal lines.
Our results suggest that the unstable behavior of the nodal lines is associated with slow APD accommodation. We demonstrated that the time constant of APD accommodation (τ) is significantly smaller for SDA with stable nodal lines than for SDA with unstable nodal lines. The large τ leads to slow temporal change of APD and a slow increase in heterogeneity. This creates a substrate for the development of the SDA from SCA. However, although our results strongly suggest that SDA can be associated with short-term memory, further experiments are needed to elucidate the mechanism precisely.
Study Limitations
Our study has limitations that need to be considered. First, the optical mapping technique allows measurements from the epicardial surface only. This limits our ability to interpret nodal line behavior. Of course, in the real 3-dimensional geometry of the rabbit ventricle, the behavior of the nodal lines is expected to be much more complex. Second, it is important to note that we used blebbistatin (10 μmol/L) to reduce motion artifacts. It has been demonstrated20 that even higher doses of blebbistatin do not affect the APD in the rabbit heart. To be sure, we conducted patch-clamp studies in isolated rabbit myocytes (data not shown) and demonstrated that the resting membrane potential and 3 levels of APD (APD50, APD70, and APD90) do not change in the presence of blebbistatin at different frequencies.
Acknowledgments
We thank Jiang Jiang for the technical support and Dr S.V. Pandit for fruitful discussions.
Sources of Funding This work was supported by American Heart Association Scientist Development Grant 0635061N (Dr Tolkacheva) and National Heart Lung and Blood Institute grants PO1 HL039707, P01 HL087226, RO1 HL070074, and RO1 HL060843 (Dr Jalife).
Footnotes
Circulation is available at http://circ.ahajournals.org
Disclosures None.
References
- 1.Rosenbaum DS, Jackson LE, Smith JM, Garan H, Ruskin JN, Cohen RJ. Electrical alternans and vulnerability to ventricular arrhythmias. N Engl J Med. 1994;330:235–241. doi: 10.1056/NEJM199401273300402. [DOI] [PubMed] [Google Scholar]
- 2.Pruvot EJ, Rosenbaum DS. T-wave alternans for risk stratification and prevention of sudden cardiac death. Curr Cardiol Rep. 2003;5:350–357. doi: 10.1007/s11886-003-0090-4. [DOI] [PubMed] [Google Scholar]
- 3.Konta T, Ikeda K, Yamaki M, Nakamura K, Honma K, Kubota I, Yasui S. Significance of discordant ST alternans in ventricular fibrillation. Circulation. 1990;82:2185–2189. doi: 10.1161/01.cir.82.6.2185. [DOI] [PubMed] [Google Scholar]
- 4.Rubenstein DS, Lipsius SL. Premature beats elicit a phase reversal of mechanoelectrical alternans in cat ventricular myocytes: a possible mechanism for reentrant arrhythmias. Circulation. 1995;91:201–214. doi: 10.1161/01.cir.91.1.201. [DOI] [PubMed] [Google Scholar]
- 5.Pastore JM, Girouard SD, Laurita KR, Akar FG, Rosenbaum DS. Mechanism linking T-wave alternans to the genesis of cardiac fibrillation. Circulation. 1999;99:1385–1394. doi: 10.1161/01.cir.99.10.1385. [DOI] [PubMed] [Google Scholar]
- 6.Chinushi M, Kozhevnikov D, Caref EB, Restivo M, El-Sherif N. Mechanism of discordant T wave alternans in the vivo heart. J Cardiovasc Electrophysiol. 2003;14:632–638. doi: 10.1046/j.1540-8167.2003.03028.x. [DOI] [PubMed] [Google Scholar]
- 7.Pastore JM, Laurita KR, Rosenbaum DS. Importance of spatiotemporal heterogeneity of cellular restitution in mechanism of arrhythmogenic discordant alternans. Heart Rhythm. 2006;3:711–719. doi: 10.1016/j.hrthm.2006.02.1034. [DOI] [PubMed] [Google Scholar]
- 8.Hayashi H, Shiferaw Y, Sato D, Nihei M, Lin S-F, Chen P-S, Garfinkel A, Weiss JN, Qu Z. Dynamic origin of spatially discordant alternans in cardiac tissue. Biophys J. 2007;92:448–460. doi: 10.1529/biophysj.106.091009. [DOI] [PMC free article] [PubMed] [Google Scholar]
- 9.Watanabe MA, Fenton FH, Evans SJ, Hastings HM, Karma A. Mechanisms for discordant alternans. J Cardiovasc Electrophysiol. 2001;12:196–206. doi: 10.1046/j.1540-8167.2001.00196.x. [DOI] [PubMed] [Google Scholar]
- 10.Fox JJ, Riccio FH, Bodenschatz E, Gilmour RF., Jr Spatiotemporal transition to conduction block in canine ventricle. Circ Res. 2002;90:289–296. doi: 10.1161/hh0302.104723. [DOI] [PubMed] [Google Scholar]
- 11.Fenton FH, Cherry EM, Hastings HM, Evans SJ. Multiple mechanisms of spiral wave breakup in a model of cardiac electrical activity. Chaos. 2002;12:852–892. doi: 10.1063/1.1504242. [DOI] [PubMed] [Google Scholar]
- 12.Franz MR. The electrical restitution curve revisited: steep or flat slope: which is better? J Cardiovasc Electrophys. 2003;14:s140–s147. doi: 10.1046/j.1540.8167.90303.x. [DOI] [PubMed] [Google Scholar]
- 13.Taggart P, Sutton P, Chalabi Z, Boyett MR, Simon R, Elliott D, Gil JS. Effect of adrenergic stimulation on action potential duration restitution in human. Circulation. 2003;107:285–289. doi: 10.1161/01.cir.0000044941.13346.74. [DOI] [PubMed] [Google Scholar]
- 14.Qu Z, Garfinkel A, Chen P-S, Weiss JN. Mechanisms of discordant alternans and induction of reentry in simulated cardiac tissue. Circulation. 2000;102:1664–1670. doi: 10.1161/01.cir.102.14.1664. [DOI] [PubMed] [Google Scholar]
- 15.Banville I, Gray A. Effect of action potential duration and conduction velocity restitution and their spatial dispersion on alternans and the stability of arrhythmias. J Cardiovasc Electrophysiol. 2002;13:1141–1149. doi: 10.1046/j.1540-8167.2002.01141.x. [DOI] [PubMed] [Google Scholar]
- 16.Watanabe MA, Koller ML. Mathematical analysis of dynamics of cardiac memory and accommodation: theory and experiment. Am J Physiol. 2002;282:H1534–H1547. doi: 10.1152/ajpheart.00351.2001. [DOI] [PubMed] [Google Scholar]
- 17.Kalb SS, Dobrovolny H, Tolkacheva EG, Idriss SF, Krassowska W, Gauthier DJ. The restitution portrait: a new method for investigating rate-dependence restitution. J Cardiovasc Electrophysiol. 2004;15:698–709. doi: 10.1046/j.1540-8167.2004.03550.x. [DOI] [PubMed] [Google Scholar]
- 18.Elharrar V, Surawicz B. Cycle length effect on restitution of action potential duration in dog cardiac fibers. Am J Physiol. 1983;244:H782–H792. doi: 10.1152/ajpheart.1983.244.6.H782. [DOI] [PubMed] [Google Scholar]
- 19.Janse MJ, Sosunov EA, Coronel R, Opthof T, Anyukhovsky EP, de Bakker JMT, Plotnikov AN, Shlapakova IN, Danilo P, Jr, Tijssen JGP, Rosen MR. Repolarization gradients in the canine left ventricle before and after induction of short term cardiac memory. Circulation. 2005;112:1711–1718. doi: 10.1161/CIRCULATIONAHA.104.516583. [DOI] [PubMed] [Google Scholar]
- 20.Fedorov VV, Lozinsky IT, Sosunov EA, Anyukhovsky EP, Rosen MR, Balke WC, Efimov IR. Application of blebbistatin as an excitation-contraction uncoupler for electrophysiological study of rat and rabbit hearts. Heart Rhythm. 2007;4:619–626. doi: 10.1016/j.hrthm.2006.12.047. [DOI] [PubMed] [Google Scholar]
- 21.Bayly PV, KenKnight BH, Rogers JM, Hillsley RE, Ideker RE, Smith WM. Estimation of conduction velocity vector fields from epicardial mapping data. IEEE Trans Biomed Eng. 1998;45:563–571. doi: 10.1109/10.668746. [DOI] [PubMed] [Google Scholar]
- 22.Weiss JN, Karma A, Shiferaw Y, Chen P-S, Garfinkel A, Qu Z. From pulsus to pulseless: the saga of cardiac alternans. Circ Res. 2006;98:1244–1253. doi: 10.1161/01.RES.0000224540.97431.f0. [DOI] [PubMed] [Google Scholar]
- 23.Cao J-M, Qu Z, Kim Y-H, Wu T-J, Garfinkel A, Weiss JN, Karagueuzian HS, Chen P-S. Spatiotemporal heterogeneity in the induction of ventricular fibrillation by rapid pacing: importance of cardiac restitution properties. Circ Res. 1999;84:1318–1331. doi: 10.1161/01.res.84.11.1318. [DOI] [PubMed] [Google Scholar]
- 24.Kalb SS, Dobrovolny H, Tolkacheva EG, Idriss SF, Krassowska W, Gauthier DJ. The restitution portrait: a new method for investigating rate-dependence restitution. J Cardiovasc Electrophysiol. 2004;15:698–709. doi: 10.1046/j.1540-8167.2004.03550.x. [DOI] [PubMed] [Google Scholar]


