

Abstract
A mechanism-based model for pharmacodynamic effects of dexamethasone (DEX) was incorporated into our model for arthritis disease progression in the rat to aid in identification of the primary factors responsible for edema and bone loss. Collagen-induced arthritis (CIA) was produced in male Lewis rats following injection of type II porcine collagen. DEX was given subcutaneously in single doses of 0.225 or 2.25 mg/kg or 7-day multiple doses of 0.045 or 0.225 mg/kg at 21 days post disease induction. Effects on disease progression were measured by paw swelling, bone mineral density (BMD), body weights, plasma corticosterone (CST), and TNF-α, IL-1β, IL-6, and GR mRNA expression in paw tissue. Lumbar and femur BMD was determined by PIXImus-II dual energy x-ray absorptiometry. Plasma CST was assayed by HPLC. Cytokine and GR mRNA were assayed by quantitative real-time PCR. Indirect response models, drug-interaction models, transduction processes, and the 5th-generation model of corticosteroid dynamics were integrated and applied using S-ADAPT software to describe how dexamethasone binding to GR can regulate diverse processes. Cytokine mRNA, GR mRNA, plasma CST, and paw edema were suppressed following DEX administration. TNF-α mRNA expression and BMD appeared to increase immediately after dosing but were ultimately reduced. Model parameters indicated that IL-6 and IL-1β were most sensitive to inhibition by DEX. TNF-α appeared to primarily influence edema while IL-6 contributed the most to bone loss. Lower doses of corticosteroids may be sufficient to suppress the cytokines most relevant to bone erosion.
INTRODUCTION
Corticosteroids (CS) have long played a role in treatment of rheumatoid arthritis (Hart, 1976; Neeck, 2002). Therapy with this class of drugs dates back to early 1950 before quantitative methods describing the kinetics and dynamics of drug disposition and treatment effects were considered necessary for drug development and clinical applications. Numerous adverse effects became recognized and thus dose adjustments were often warranted and other drugs were sought to replace chronic CS treatment regimens. However, CS have remained a mainstay in treatment when other drugs fail and often for bridging between alternative treatments. Furthermore, recent studies employing low-dose prednisolone or methylprednisolone alone or in combination with other small molecule drugs have highlighted the beneficial role of these compounds in preventing irreversible joint erosion (Svensson et al., 2005; Wassenberg et al., 2005; Da Silva et al., 2006). In the present study quantitative analysis of CS effects on pro-inflammatory cytokine mRNA in a rat model of RA was performed and used to explain differences in concentrations necessary for treatment effects on paw edema versus bone mineral density (BMD), potentially providing insight for optimizing the use of CS in the clinical setting.
A disease progression model for pro-inflammatory cytokine mRNA, glucocorticoid receptor (GR) mRNA, plasma corticosterone (CST), paw edema, and BMD is presented in Part I. Here we integrate the effects of dexamethasone (DEX) into the disease progression model by assuming that DEX binds to the same receptor as CST and both ligand-receptor complexes mediate the observed responses. Time courses of DEX effects and model fittings are presented for several disease progression markers: tumor necrosis factor–α (TNF-α), interleukin-1β (IL-1β), interleukin-6 (IL-6), glucocorticoid receptor (GR) mRNA, plasma corticosterone (CST), paw edema, and BMD for various dose regimens. Simulations indicating optimal dosing in rats for protecting BMD, while affecting cytokine expression and paw edema, are presented. The combination of mechanistic disease progression modeling with pharmacodynamic DEX effects provides a systems approach to resolving the role of CS treatment on cytokine suppression and subsequent cytokine effects on paw swelling and bone mineral density, and suggests how optimal doses or combination therapies may be designed using knowledge of cytokine suppression and relevant contributions to disease endpoints.
METHODS
Care of animals, induction of arthritis, measurements of paw edema, TNF-α, IL-1β, IL-6 mRNA, GR mRNA, CST, BMD and other details are presented in Part I.
Experimental Design
Dynamics of Cytokine mRNA, GR mRNA, & CST: Low and High Single Dose Dexamethasone
On study day zero 144 male Lewis rats were induced with CIA. Of these 144, 78 rats developed edema in both paws. Animal body weights and paw edema were monitored on study days 0, 7, 9, 12, 15, 17, 19, 21, and at time of sacrifice. Two groups of 39 rats received either a low dose (0.225 mg/kg) or high dose (2.25 mg/kg) of subcutaneous (SC) dexamethasone on day 21. Four to five animals in each group were sacrificed at 1, 2, 4, 6, 8, 12, 24, 36, and 48 hours post dose. Animals were sacrificed by aortal exsanguinations and blood was collected in syringes containing sufficient EDTA to yield 1.5 mg/mL (4 mM) final concentration (Samtani and Jusko, 2005). Samples were centrifuged at 1800 × g for 10 min at 4° C. Plasma was collected and stored at −80° C. Skin was removed from hind paws, the paws were excised above the ankle and flash frozen in liquid nitrogen prior to storage at −80° C.
Bone Mineral Density Dynamics: 7-Day Multiple DEX Administration
An additional 8 healthy rats and 6 induced with arthritis were scanned with the PIXImus II instrument (GE Healthcare, WI) to assess changes in bone mineral density in the femur, paw, and lumbar regions after 7-day DEX administration. Healthy rats were divided into two groups of four and dosed once-daily for seven days with either 0.045 or 0.225 mg/kg SC DEX starting on day 21. The six arthritic rats were dosed once-daily for seven days with 0.225 mg/kg SC DEX starting on day 21. Healthy animals were scanned for the femur, lumbar, and paw regions on days 1, 8, 16, 20, 22, 24, 26, 30, and 33. Arthritic animals were scanned for the femur, lumbar, and paw regions on days 9, 12, 15, 20, 22, 24, 26, 30, and 33.
Paw and body weight data and tissues from preliminary pilot studies in our laboratory and from Part I were also included in the model development. A total of 162 healthy and arthritic rats were used for all paw mRNA measurements. From this 220, 214, and 212 data points were used for TNF-α, IL-1β, and IL-6 mRNA (1–2 paws were used per rat). Plasma corticosterone was assayed from 177 rats (177 data points) and paw edema was determined from 314 rats (4340 data points, 13 points per rat). Bone mineral density was assayed from 46 animals and a total of 1464 data points from 5 different scanned regions were modeled. Only the paw mRNA measures and plasma CST were collected by sparse sampling means. The non-invasive measures, paw edema and bone mineral density, were collected serially.
Pharmacodynamic Model of Dexamethasone Effects in Rat Arthritis
Figure 1 shows a general schematic for the entire arthritis progression model with DEX binding to GR. The structure of the disease progression model and relevant feedback by CST is presented in Part I. In general all equations for cytokine mRNA, GR mRNA, paw edema, and BMD remain unchanged when integrating dexamethasone effects into the model, as it is the CS bound to receptor complex in the nucleus (DRN) that exerts the effect of both DEX and CST. In this model equal concentrations of corticosterone bound to GR in the nucleus and of DEX bound to GR in the nucleus are treated as the same effectors on cytokine mRNA, GR mRNA and CST. Equations that govern this binding and distribution of drug bound to GR in the nucleus are modified in the presence of DEX.
Figure 1.

Model schematic for corticosteroid and cytokine inter-regulation during arthritis progression. Parameters and symbols are explained in the text and tables. Lines with arrows indicate conversion to or turnover of the indicated responses. Lines ending in closed circles indicate an effect is being exerted by the connected factors.
Corticosterone and GR dynamics
The modified differential equation and initial condition describing concentrations of free GR in the presence of both CST and DEX is
| (1) |
where ksyn_GR is the first-order synthesis rate from GR mRNA and kdgr_GR is the first-order loss rate constant. The parameters kRE_C and kRE_D describe the rates that corticosterone bound to receptor and dexamethasone bound to receptor return from the nucleus. The parameter RF is the fraction of GR that returns intact and active. The values for kdgr_GR and RF were fixed from previous studies (Hazra et al., 2007a; Hazra et al., 2007b; Hazra et al., 2007c). The second-order binding rate constant for CST was defined as where 279.45g is the molecular weight of CST and 18.64 nM is the literature reported KD for CST (Buchwald, 2007). The parameter ffCST·kon_C is the fraction of drug in plasma that is capable of binding in tissue. The second-order binding rate constant for DEX was defined as where 298.01 g is the molecular weight of DEX and 6.59 nM is the literature reported KD for DEX (Buchwald, 2007). The model assumes that CST equilibrium between vasculature and tissue is immediate. Bound CST-receptor complex in the cytosol is
| (2) |
and bound DEX-GR complex in the cytosol is
| (3) |
where kT is the first-order rate constant for translocation of bound CST-GR complex to the nucleus and is reported previously. Concentrations of bound CST-GR complex in the nucleus are
| (4) |
and concentrations of bound DEX-GR complex in the nucleus are
| (5) |
The value of DRN for the presence of the two CS is then calculated as the sum of concentrations of each drug bound to receptor in the nucleus: DRN = DRN_C +DRN_D. The parameters R0_GR, R0_DR, and R0_DRN are defined based on the steady-state baseline conditions as described in Part I.
Production of plasma CST concentrations is up-regulated by inflammation and is correlated with pro-inflammatory cytokines and inhibited by DEX-GR complex in the nucleus.
| (6) |
where kin_CST is the first-order rate constant for the production of CST and IC50_CST is the amount of DRN_D required to inhibit production of CST 50%. The variable BCYT is the influence of proinflammatory cytokines on CST up-regulation defined as
| (7) |
where β1 and β2 are the intrinsic activities of each individual cytokine on CST up-regulation.
Dynamics of Paw Edema and Bone Mineral Density
Pharmacodynamic models of drug effect for paw edema and bone mineral density are as presented in Part I.
Disease State Pharmacokinetics of Dexamethasone
The pharmacokinetic model for dexamethasone concentrations after 0.225 and 2.25 mg/kg SC doses in healthy and arthritic animals was applied to describe the kinetics of SC dexamethasone. Equations and initial conditions describing the amounts of DEX in each compartment are
| (8) |
| (9) |
| (10) |
where AAbs indicates the amount at the absorption site, Apl is the amount of DEX in plasma, AT is the amount in peripheral tissues, ka is the first-order absorption rate constant (5.78 hr−1), CL is the plasma clearance (1.05 and 1.19 L·hr−1·kg−1 for healthy and arthritic rats), CLD is the inter-compartmental clearance (7.20 L·hr−1·kg−1), VP is the central volume of distribution (3.41 L), VT is the peripheral volume (1.44 L), and F is the IM bioavailability (0.86). Concentrations of DEX in plasma were generated from: Cpl = AAbs/VP.
Model Fitting and Nonlinear Regression Analysis
The pharmacodynamic model was constructed in two phases with the disease progression data and drug effect data modeled simultaneously. The first model fitting phase included both disease progression (Part I) and drug effect data on cytokine mRNA, GR mRNA, and plasma CST. The relevant parameters were obtained and then fixed for the second model fitting phase where paw edema and BMD data from both Part I and Part II were modeled simultaneously. Drug effect-related data, parameters, and model fitted curves are presented here. Modeling fittings were performed using S-ADAPT (BMSR, University of Southern California, San Diego, CA) as described in Part I. Model simulations were done using Berkeley Madonna Software (University of California, Berkeley, CA) implementing the Rosenbrock (stiff) method for solving differential equations. Simulated values of the BMD at steady-state were used to determine the dose at which the maximal steady-state response after treatment was observed. The initial lower and upper bounds of dose in the numerical bisection algorithm were 0 and 2.25 mg/kg once-daily. These bounds were narrowed until there was less than a 0.001 mg/kg difference between the upper and lower bounds while keeping the maximum response between these two limits. The three-significant digit was reported as the optimal-dose.
RESULTS
The pharmacokinetics of DEX after intramuscular (IM) administration was studied previously in healthy and arthritic rats (Figure 2). A pilot study in healthy rats showed concentrations following SC and IM dosing to be identical. Plasma DEX concentrations were measured in samples collected in this study and were in agreement with those from IM dosing. The same kinetic model for IM administration was applied for healthy and arthritic rats following SC DEX dosing.
Figure 2.

Plasma concentration-time profiles of high (triangles) and low-dose (circles) of IM dexamethasone in healthy (solid symbols) and arthritic (open symbols) rats, and SC dexamethasone in arthritic rats (gray squares high-dose, solid squares low-dose). Model fittings are shown as solid lines and parameters are defined in the text.
Profiles for cytokine mRNA expression following single SC doses of 0.225 or 2.25 mg/kg DEX are shown in Figure 3. TNF-α mRNA shown in Panel A had an unexpected time course following DEX dosing. There was an abrupt rise followed by a drop returning to a rise above the natural disease progression for both doses, although the inhibition by DEX was maintained longer with the higher dose. The IL-1β mRNA was initially inhibited abruptly and almost completely after both DEX doses; however, the inhibition was maintained near 100% for a longer time with the higher dose. Interleukin-6 was inhibited very rapidly and completely in a similar manner. No difference in drug effects between low and high doses was observed with IL-6, indicating a high degree of sensitivity to CS. Interestingly TNF-α was the only cytokine with increased mRNA expression following DEX. Relevant parameter estimates for drug effects on cytokine mRNA are presented in Table 1. The IC50 values for these cytokines were in agreement with the observed responses. The lowest value of 4.5 nM was for interleukin-6 indicating the greatest sensitivity to CS effect, followed by IC50_IL1β of 32.6 nM, and TNF-α at 550 nM. The release constant for DEX-GR complex from the nucleus (kre_D (hr−1) = 0.0498) was also much lower than that of CST-GR complex (kre_C (hr−1) = 85.04). The remaining disease progression model and parameters are presented in Part I.
Figure 3.
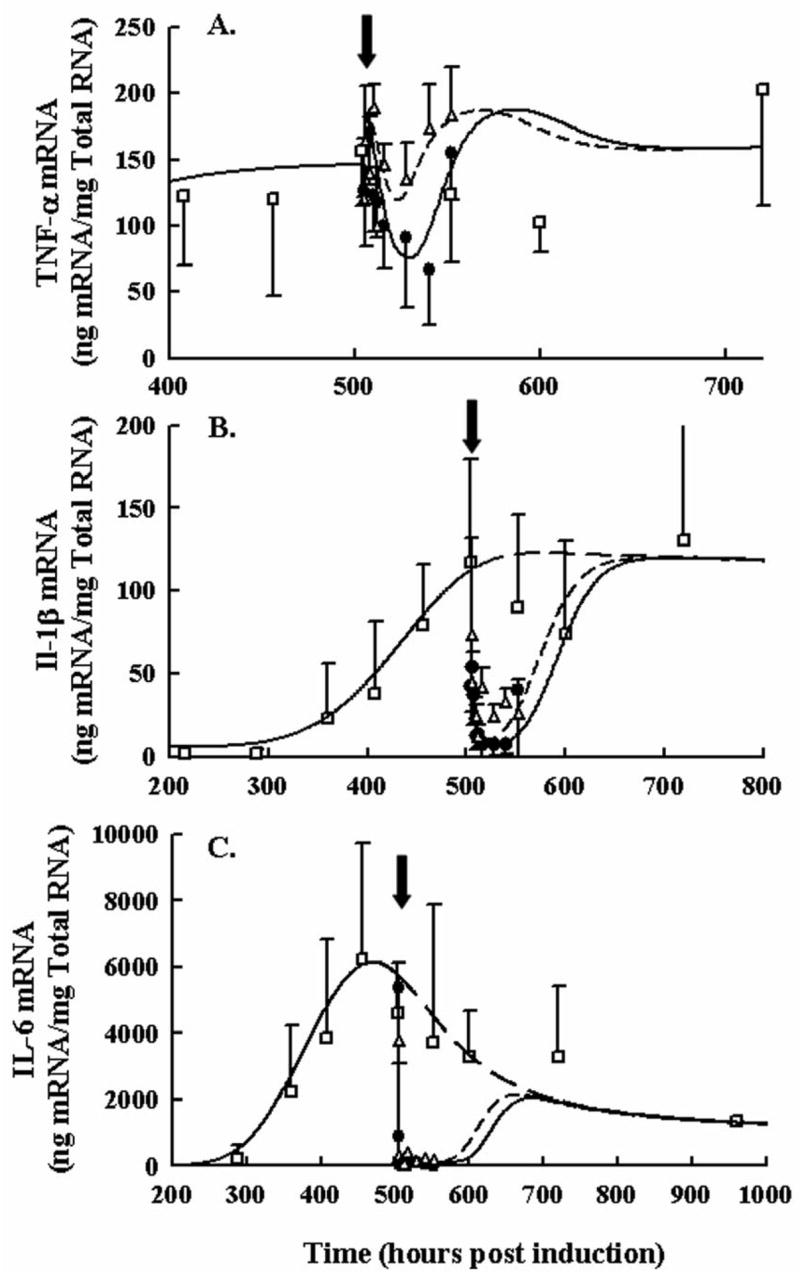
Time course of TNF-α (Panel A), IL-1β (Panel B), and IL-6 (Panel C) paw mRNA expression in arthritic rats following 0.225 and 2.25 mg/kg SC DEX. Closed circles depict mRNA after single high dose administration. Open triangles depict mRNA after single low dose administration. Black arrows indicate time of dosing, 504 hours post CIA induction. Open squares show natural disease progression of cytokine mRNA. Observations in all figures are reported as mean ± one standard deviation. Model fittings are presented as solid lines for the 2.25 mg/kg dose, short-dashed lines for the single 0.225 mg/kg dose, and long dashed lines for no DEX treatment.
Table 1.
Model Parameters for CS Effects on Cytokine & GR mRNA, CST, and BMD.
| Parameter (units) | Description | Estimatea |
|---|---|---|
| IC50_TNFα (nMol) | IC50 for CST & DEX effects on TNF-α mRNA via GR | 550.0 |
| γ1 | Hill coefficient of CST & DEX effects on TNF-α mRNA | 2.00b |
| IC50_IL1β (nMol) | IC50 for CST & DEX effects on IL-1β mRNA via GR | 32.55 |
| IC50_IL6 (nMol) | IC50 for CST & DEX effects on IL-6 mRNA via GR | 4.503 |
| γ3 | Hill coefficient of CST & DEX effects on IL-6 mRNA | 2.00b |
| IC50_GRm (nMol) | IC50 for CST & DEX effects on GR mRNA via GR | 545.7 |
| γ5 | Hill coefficient of CST & DEX effects on GR mRNA | 10.00b |
| IC50_CST (nMol) | IC50 for DEX effects on plasma CST via GR | 20.31 |
| kre_D (hr−1) | Release constant for DEX & GR complex from nucleus | 0.0498 |
| IC50_Glucocorticoid (nMol) | IC50 for CST & DEX effects on BMD | 984.8 |
S-ADAPT Software was unable to generate CV%
Parameter value was fixed
Dexamethasone effects on GR mRNA and endogenous CST are shown in Figure 4 (Panels A and B) following single SC doses of 0.225 or 2.25 mg/kg DEX and are compared to no drug treatment. For the low dose, there appeared to be a quick drop followed by a rebound in GR mRNA whereas the high dose showed a sharp drop that remained below disease progression values throughout 48 hours post dose. Data for CST is shown in Panel B. No differences with dose were observed as CST was suppressed very rapidly and nearly completely. Drug effect parameters for GR mRNA and CST are presented in Table 1. The IC50 of GR was fairly high which accounts for the low dose having almost no response while the high dose produced a sharp drop necessitating the high value of the Hill coefficient.
Figure 4.
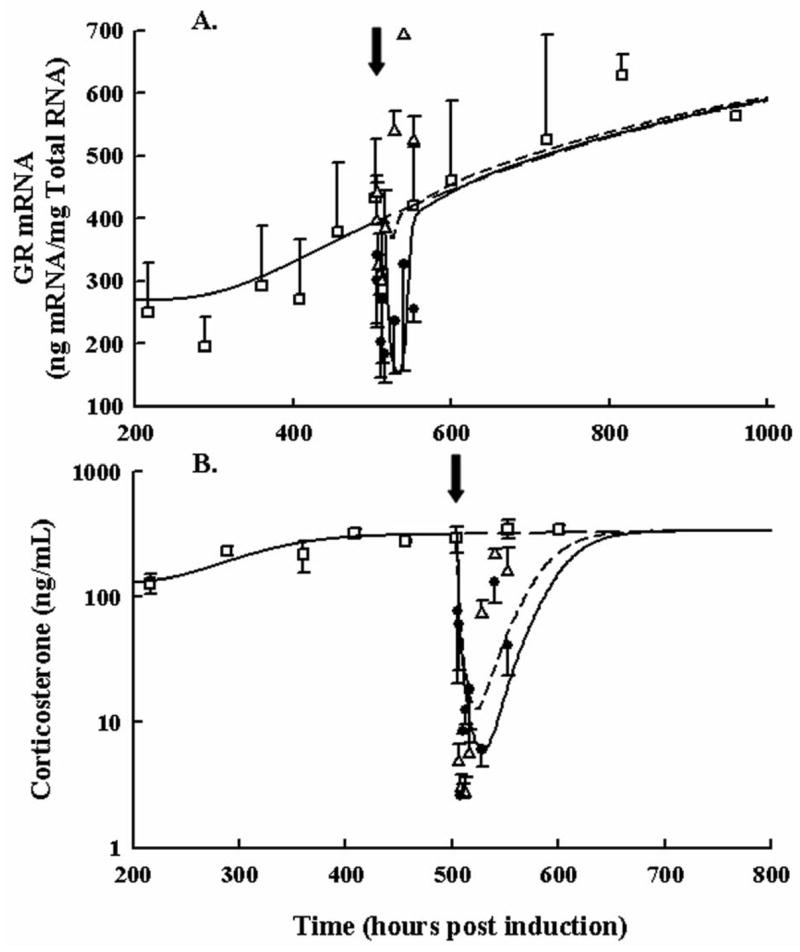
Time courses for GR mRNA in paw (Panel A) and plasma corticosterone (Panel B) following 0.225 and 2.25 mg/kg SC DEX and no drug treatment. Closed circles depict mRNA after the single high dose. Open triangles depict mRNA after the single low dose. Black arrows indicate the time of dosing (504 hours post CIA induction). Open squares show the natural disease progression time course of GR mRNA. Data and model fittings are as described in Figure 3.
Paw edema responses in rats with CIA after single 0.225 and 2.25 mg/kg as well as 7 once-daily multiple-doses of 0.225 mg/kg DEX are shown in Figure 5. For all doses, edema dropped rapidly. However, multiple-dosing was required to suppress paw size close to the healthy baseline. Returns to disease state values were not observed during the first 48 hours following acute single doses. Instead this return was drawn out over 100–300 hours as indicated by the chronic dosing paw edema data. Parameter estimates for paw edema are present in Part I along with model equations. Model fittings captured the profiles fairly well, although there was a general over-prediction of suppression with the low dose and the extent to which the multiple-dosing would reduce the overall paw edema was also slightly over-predicted.
Figure 5.
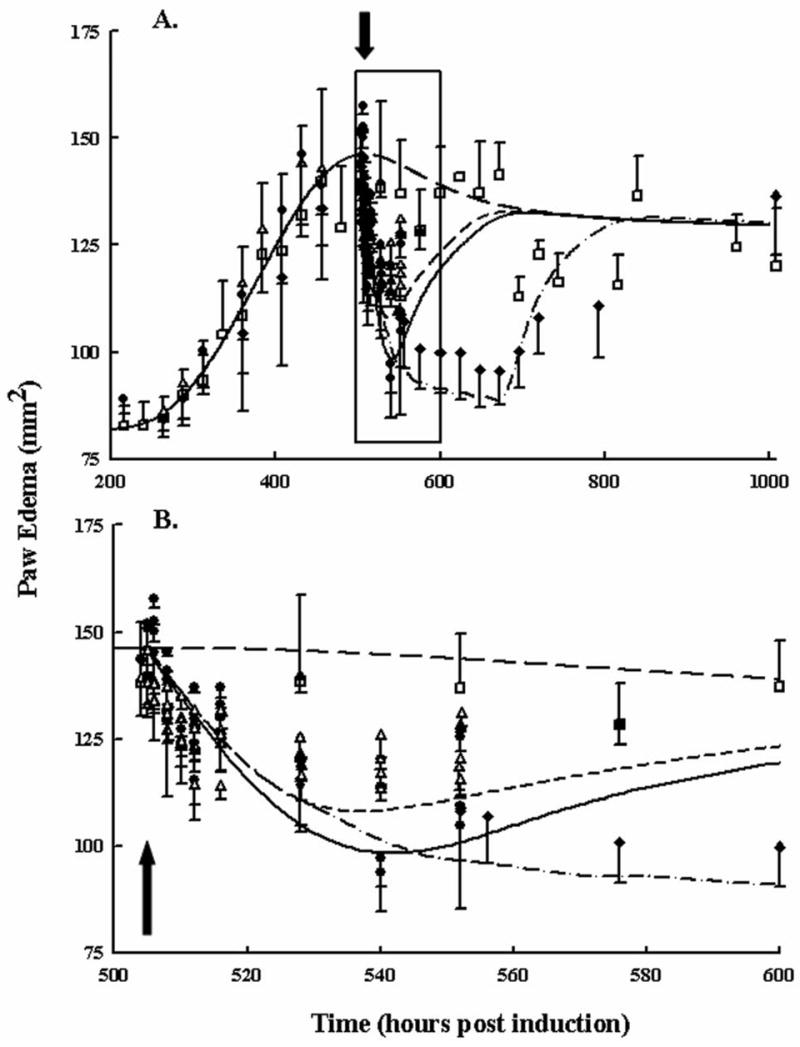
Disease progression of paw edema following no drug (open squares), single low dose (open triangles), single high dose (closed circles), and 7 low-dose multiple administrations (closed diamonds). Panel A shows the entire disease progression. Panel B presents the same data magnified between 500 and 600 hours post CIA induction. The black arrows indicate the first time of dosing at 504 hours. Additional doses for rats receiving seven once-daily doses were done at 528, 552, 576, 600, 624, and 648 hours post-disease induction. Data and model fittings are as described in Figure 3.
Figure 6 shows bone mineral density progression in the femur and lumbar regions of healthy and arthritic rats following 7 once-daily multiple-dosing of either 0.045 mg/kg in healthy rats or 0.225 mg/kg DEX in healthy and arthritic rats. Early in time there is an increase in BMD from natural growth of the 6–9 week old rats. After the first dose at 504 hours in the arthritic group, there was an initial increase in BMD followed by a further decline. In healthy rats there was a delay of about 100 hours before the effects of DEX were observed on BMD. Unlike for paw edema, DEX is known to regulate other factors besides cytokine mRNA in bone turnover. The model incorporated DEX effects through both inhibition of osteoblast production and reduced pro-inflammatory cytokine mRNA production. The relevent IC50 for CS inhibition of osteoblast production is listed in Table 1 with a value of 984 nM. In the lumbar region, effects of arthritis were not immediately apparent although it was observed that systemic CS did reduce BMD later in time. Model fittings of BMD in general captured the data well.
Figure 6.
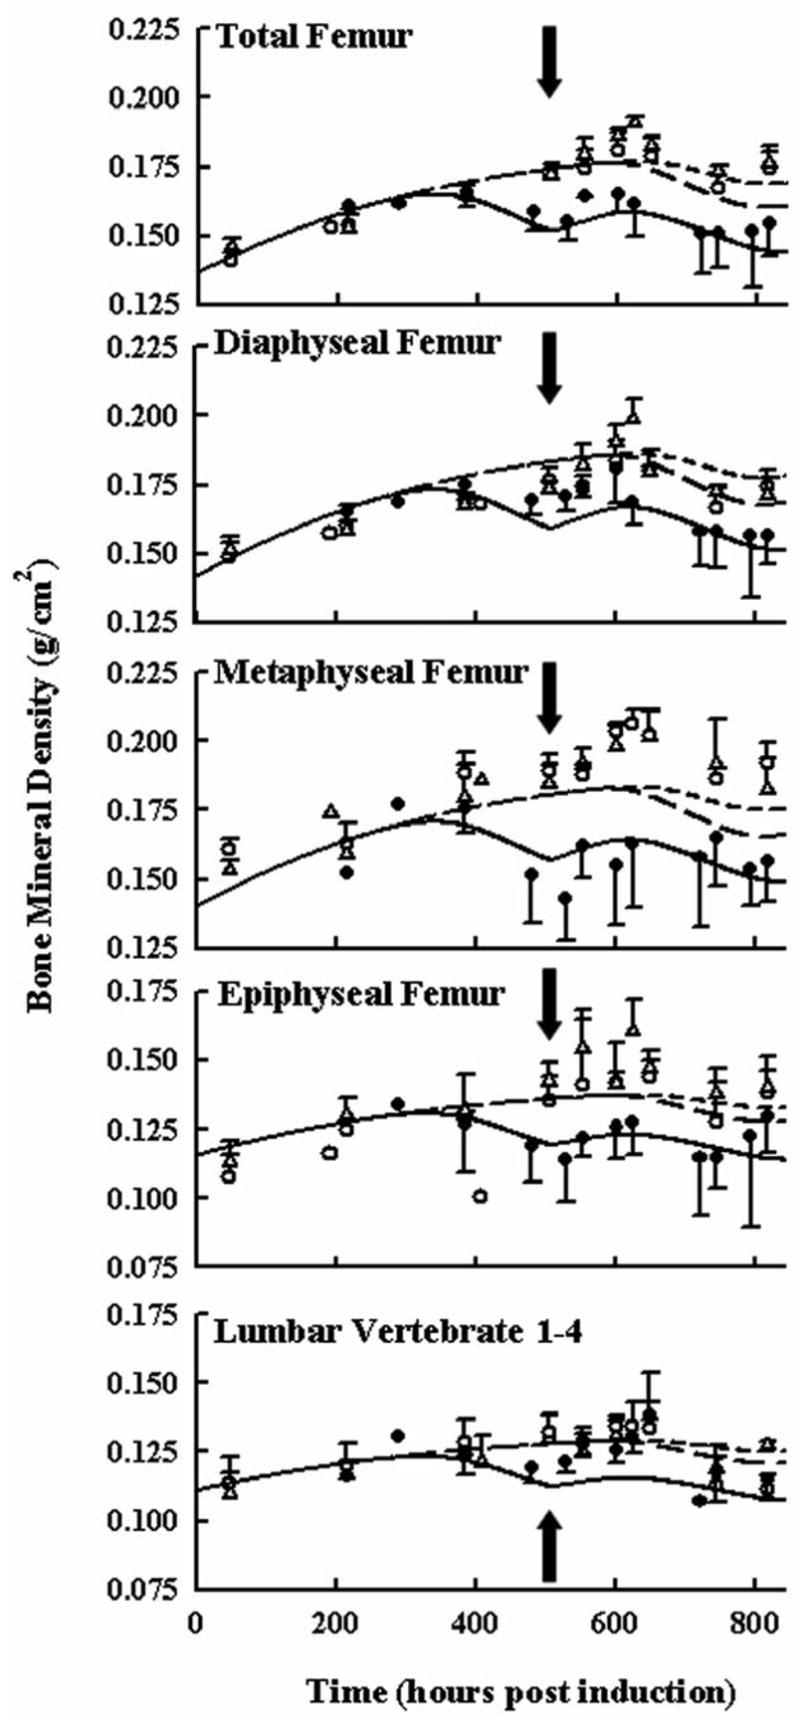
Time courses of bone mineral density in different regions of the rat femur and lumbar vertebrate following 7-day QID 0.045 and 0.225 mg/kg SC DEX in healthy rats and 7-day QID 0.225 mg/kg SC DEX in arthritic rats. Closed circles depict BMD after 0.225 mg/kg DEX in arthritic rats for 7 days. Open triangles depict BMD after 7-day 0.045 mg/kg dosing in healthy rats. Open circles depict BMD after 7-day 0.225 mg/kg dosing in healthy rats. Black arrows indicate the time of dosing (504 hours post CIA induction). Data and model fittings are as described in Figure 3.
Simulated concentrations of DRN for all DEX dosing regimens are shown in Figure 7. These simulations are particularly useful when comparing the IC50 values for DRN for each type of response. Figure 8 shows simulations of total femur BMD, lumbar BMD, cytokine mRNAs, DRN, and paw edema after chronic treatment with 0, 0.0113, or 0.225 mg/kg DEX once daily. The 0.0113 mg/kg dose was determined through analysis of steady-state equations to be the optimal chronic DEX dose for preventing BMD loss. Higher DRN concentrations than produced by 0.0113 mg/kg meant that inhibition of bone production would cause a greater loss in BMD, whereas lower concentrations of DRN would yield less pro-inflammatory cytokine suppression and result in stimulation of bone loss. The 0.225 mg/kg dose was initially chosen to produce concentrations in the rat similar to those in low dose clinical regimens. If 0.225 mg/kg in the rat is equivalent to the minimal clinically effective dose, then the model would indicate this dosing scenario to greatly reduce bone mineral density (Figure 8, Panels A and B). Wider gray lines in these figures indicate oscillations between peak and trough responses from serial dosing every 24 hours. Interesting was that the ‘optimal dose’ produced a general increase in BMD despite an increase in TNF-α mRNA expression, indicating that IL-1β and IL-6 would more strongly regulate BMD. Despite the reduction in IL-1β and IL-6 mRNA, paw edema was not dramatically reduced, highlighting the effect of TNF-α on edema.
Figure 7.
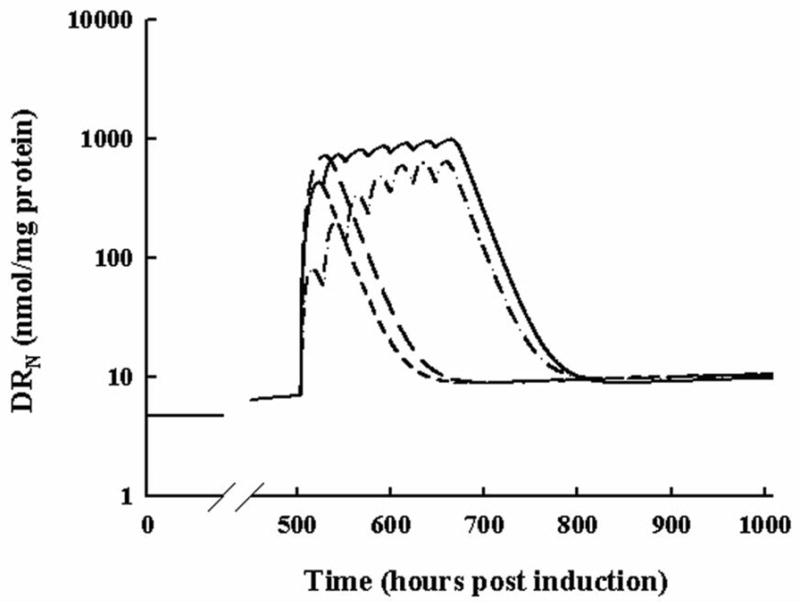
Simulated profiles of DRN for all relevant DEX dosing regimens. The short-dashed line indicates the response from 0.225 mg/kg SC DEX. The long-dashed line indicates the response to 2.25 mg/kg SC DEX. The dash-dot-dash line shows the response to 7-day QID 0.045 mg/kg SC DEX. The solid line shows the response to 7-day QID 0.225 mg/kg SC DEX.
Figure 8.
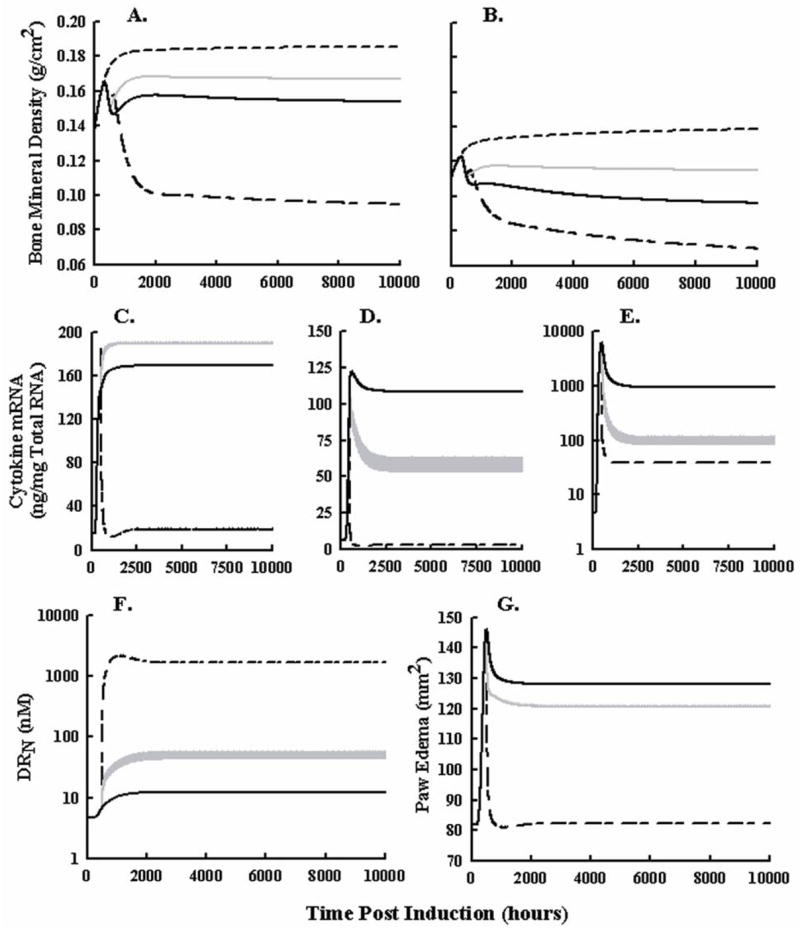
Simulated profiles of femur BMD (Panel A), lumbar BMD (Panel B), TNF-α mRNA (Panel C), IL-1β mRNA (Panel D), IL-6 mRNA (Panel E), DRN (Panel F), and paw edema (Panel G) following no drug treatment (solid black lines), chronic 0.0113 mg/kg DEX daily (gray lines), and 0.225 mg/kg DEX daily (black long-short dashed lines) in arthritic rats. Short dashed lines depict BMD responses in healthy rats. DEX dosing begins 504 hours post induction and is repeated every 24 hours for the remainder of the simulation.
DISCUSSION
Developing mechanistic models of drug effects in disease states requires understanding of both disease progression and how the drug acts on intermediary factors. We examined CIA progression in the rat and subsequent effects of DEX on the relevant factors driving edema and bone turnover. Endogenous CST plays a role in mediating cytokine turnover in disease progression (Turnbull and Rivier, 1999; Neeck et al., 2002). Therefore, effects of DEX and other CS may be included with minimal modifications of the disease progression model. Only the drug kinetics and drug-receptor binding need definition. Our experimental design effectively integrates DEX pharmacodynamics with disease progression to better resolve parameters of both components.
Pharmacodynamic data for DEX are critical for understanding the interrelationships between cytokines, GR mRNA, and CST. As the disease progresses, immune factors such as chemo/cytokines turn over quickly. Corticosterone concentrations and GR mRNA are up-regulated slowly so that cytokines remain in balance and no abrupt inhibition or changes are observed in the natural disease progression. However, when DEX is administered and concentrations of DRN spike, rapid changes occur in all relevant profiles revealing rate-limiting steps, rates of loss and production, and edema and BMD responses to different concentrations of cytokines. This modeling effort not only extracts quantitative biological relationships concerning cytokine effects on paw edema and BMD, but also yields implications about the role of corticosteroids and other therapies that target cytokines in inflammatory arthritis.
The time course of TNF-α mRNA after acute 0.225 and 2.25 mg/kg SC DEX was unusual because of the increase in TNF-α expression both early and later in time. Interestingly, IL-6 was shown to inhibit the expression of TNF-α (Schindler et al., 1990). With the rapid and near complete drop in IL-6 mRNA production post-dose, it is possible that if IL-6 consistently inhibited TNF-α production, then TNF-α mRNA would increase when IL-6 concentrations fell. Based on the in vitro evidence for this suppression, the maximal suppression of TNF-α mRNA was fixed at 30% inhibition (Schindler et al., 1990). The model then captured both this rise and fall and rise again in TNF-α mRNA response.
That the expression of IL-6 mRNA was highly sensitive to DEX indicates that the decline observed in IL-6 mRNA was related to CST. With increased CST and GR mRNA, DRN was increased sufficiently to cause a drop in IL-6 but not in the other measured cytokine mRNA. While this explains in part the decline of IL-6 mRNA, it could not be the entire reason. If DRN increased rapidly as in the case of CS dosing, CST would be inhibited almost completely and for a prolonged time, such that when DRN returned to normal and CST remained suppressed, the IL-6 mRNA production would overshoot the measured response. The ‘remission’ compartment presented in Part I helped capture this decline. It is possible that as the disease develops into a more chronic state there is a shift from the innate to a more humoral immune response, effectively altering concentrations of pro-inflammatory cytokines.
Turnover of GR mRNA after DEX behaved differently than the cytokines. There was an abrupt decline followed by a rebound to values higher than found in the natural disease progression with the low dose. If TNF-α had a larger contribution to GR mRNA up-regulation, then it is possible that this rebound would have been observed. This would have also been seen for the higher dose. A time delay was necessary to account for the slow rate of disease progression that did not plateau as quickly as cytokine mRNAs while a fast drop was observed in response to DEX. Transit compartments accounted for the delayed response to cytokines while allowing the equation describing GR to have a high rate of turnover to reflect rapid drug effects.
Binding of DEX to GR was modeled using literature reported KD values to adjust the binding of CST in the presence of DEX in such a way that only ffgc·kon_C was fitted for both drugs. This parameter corrects for both the fraction of drug that equilibrates from plasma into tissue and the free fraction able to bind receptor. Distribution is assumed to be instantaneous. The release rate constants (kre_C, kre_D) from the nucleus were reasonably estimated compared with the kre for methylprednisolone (MPL, kre_M =1.31 hr−1) since CST is less potent than MPL while DEX is more potent. The release constant for DEX-GR complex from the nucleus was also much lower than that of CST-GR complex and MPL-GR complex. If both molecules exert their effects to the same extent through GR in the nucleus then DEX would need to remain bound in the nucleus for a longer duration to yield the differences in observed inhibition of cytokine mRNA for CST during disease progression versus DEX concentrations following dosing. Interestingly, the profile for DRN after chronic dosing of 0.045 mg/kg DEX (Figure 6) quickly approached the steady-state DRN as exhibited for 0.225 mg/kg DEX. This meant that the single 2.25 mg/kg and 7-day 0.225 multiple-doses of DEX were likely exerting near maximal responses. This steady-state was limited by the concentrations of free GR receptor. The estimate for synthesis of GR in inflamed tissue was 0.1054 hr−1 compared to 0.54 hr−1 in liver tissue reported previously (Schindler et al., 1990; Ramakrishnan et al., 2002; Hazra et al., 2007b; Hazra et al., 2007c).
As DEX affects cytokine mRNA expression and not edema directly, it is the inhibition of cytokines that governs the decline in paw edema. In general the model captured that data well with modest over-prediction for the 0.225 mg/kg acute and chronic dosing. This over-prediction may be due in part to the linear additive relationship between cytokine mRNA and paw edema. If the relationship between cytokines and edema is receptor driven, then a Hill-type effect relationship may be more appropriate. It is also possible that because there are other processes which contribute to edema not included in the model, their effects on up-regulating paw edema are missed. However, altering each signaling pathway alone and simultaneously in different combinations while measuring relevant paw edema is impractical, thus the true effect of cytokines on edema may be mis-specified. For the key inflammatory signaling pathways that were measured, this model captured the data well and linear stimulatory parameters reflect the relative contributions of each cytokine to paw edema.
The effect of DEX on bone was observed by two different responses. 1) An increase in BMD was observed almost immediately in arthritic animals as concentrations of pro-inflammatory cytokines fell. 2) Effects of DEX on osteoblast apoptosis/reduced-activity resulted in decreased BMD in all scanned regions of both healthy and arthritic animals approximately 100 hr (5 days) after the first dose. Higher doses of CS overpowered the anti-inflammatory effects yielding a reduced BMD. Figure 8 indicated that much lower doses of DEX were sufficient to reduce cytokines IL-1β and IL-6 mRNA, increasing BMD and mitigating adverse effects. The cytokine mRNA with the least effect on BMD was TNF-α, which had the highest IC50 value (550 nM). The cytokine with the lowest IC50 value (4.5 nM), IL-6, had the greatest contribution to BMD loss. The observation that the cytokine most sensitive to DRN contributed the most to reducing BMD density provided a potential explanation for why recent studies involving low dose CS were able to halt radiographic damage to joints (Svensson et al., 2005; Wassenberg et al., 2005; Da Silva et al., 2006).
The doses of 0.225 and 2.25 mg/kg were chosen to produce DEX concentrations in rat plasma similar to the lowest and highest exposures in humans. If these are relevant clinical doses based on PK, free fraction of drug, and drug-receptor binding constants, then Figure 8 would suggest that the minimally effective doses (0.225 mg/kg in the rat) are 20 times in excess of the optimal dose. Concentrations at higher doses of DEX will produce effects on bone loss which will dominate the protective effects. Owing to the lower binding affinity and potentially reduced kre value for prednisolone, concentrations of DRN may approach those of this lower ‘optimal’ dose and potentially explain why recent studies with low-dose prednisolone have appeared protective for BMD (Buchwald, 2007). Additionally, the model suggests that since lower doses of CS should be given and these doses may be insufficient to suppress TNF-α, a second agent given to either reduce concentrations of TNF-α or inhibit TNF-α effects on inflammation would be beneficial to both edema and BMD responses.
Owing to the extensive clinical history of corticosteroid use, their pharmacokinetics are well established as are receptor binding constants making this modeling paradigm potentially useful for translation to the clinic. It is advantageous that the model processes are based on known physiology of RA and that the major factors understood to control inflammation can be related to each other to describe disease progression and drug effects on both the molecular and symptomatic aspects of chronic auto-immune arthritis.
Nonstandard abbreviations
- BMD
Bone Mineral Density
- CIA
Collagen Induced Arthritis
- CS
Corticosteroid
- CST
Corticosterone
- DEX
Dexamethasone
- DRN
Drug Bound to Receptor in the Nucleus
- GR
Glucocorticoid Receptor
- IL-1β
Interleukin-1β
- IL-6
Interleukin-6
- IM
Intramuscular
- OB
Osteoblast
- OC
Osteoclast
- PD
Pharmacodynamic
- PK
Pharmacokinetic
- SC
Subcutaneous
- TNF-α
Tumor Necrosis Factor-α
Supported by NIH Grant GM24211 and by a Fellowship from Amgen Inc. for J. C. Earp
Recommended Section Assignment: Inflammation, Immunopharmacology, and Asthma JPET # 137414
References
- Buchwald P. Glucocorticoid receptor binding: A biphasic dependence on molecular size as revealed by the bilinear LinBiExp model. Steroids. 2007 doi: 10.1016/j.steroids.2007.10.001. (in press) [DOI] [PubMed] [Google Scholar]
- Da Silva JA, Jacobs JW, Kirwan JR, Boers M, Saag KG, Ines LB, de Koning EJ, Buttgereit F, Cutolo M, Capell H, Rau R, Bijlsma JW. Safety of low dose glucocorticoid treatment in rheumatoid arthritis: published evidence and prospective trial data. Ann Rheum Dis. 2006;65:285–293. doi: 10.1136/ard.2005.038638. [DOI] [PMC free article] [PubMed] [Google Scholar]
- Hart FD. History of the treatment of rheumatoid arthritis. Br Med J. 1976;1:763–765. doi: 10.1136/bmj.1.6012.763. [DOI] [PMC free article] [PubMed] [Google Scholar]
- Hazra A, DuBois DC, Almon RR, Jusko WJ. Assessing the dynamics of nuclear glucocorticoid-receptor complex: adding flexibility to gene expression modeling. J Pharmacokinet Pharmacodyn. 2007a;34:333–354. doi: 10.1007/s10928-007-9049-1. [DOI] [PMC free article] [PubMed] [Google Scholar]
- Hazra A, Pyszczynski N, DuBois DC, Almon RR, Jusko WJ. Modeling receptor/gene-mediated effects of corticosteroids on hepatic tyrosine aminotransferase dynamics in rats: dual regulation by endogenous and exogenous corticosteroids. J Pharmacokinet Pharmacodyn. 2007b;34:643–667. doi: 10.1007/s10928-007-9063-3. [DOI] [PMC free article] [PubMed] [Google Scholar]
- Hazra A, Pyszczynski NA, Dubois DC, Almon RR, Jusko WJ. Modeling of corticosteroid effects on hepatic low-density lipoprotein receptors and plasma lipid dynamics in rats. Pharm Res. 2007c;25:769–780. doi: 10.1007/s11095-007-9371-8. 2008. [DOI] [PMC free article] [PubMed] [Google Scholar]
- Neeck G. Fifty years of experience with cortisone therapy in the study and treatment of rheumatoid arthritis. Ann N Y Acad Sci. 2002;966:28–38. doi: 10.1111/j.1749-6632.2002.tb04199.x. [DOI] [PubMed] [Google Scholar]
- Neeck G, Renkawitz R, Eggert M. Molecular aspects of glucocorticoid hormone action in rheumatoid arthritis. Cytokines Cell Mol Ther. 2002;7:61–69. doi: 10.1080/13684730412331302081. [DOI] [PubMed] [Google Scholar]
- Ramakrishnan R, DuBois DC, Almon RR, Pyszczynski NA, Jusko WJ. Fifth-generation model for corticosteroid pharmacodynamics: application to steady-state receptor down-regulation and enzyme induction patterns during seven-day continuous infusion of methylprednisolone in rats. J Pharmacokinet Pharmacodyn. 2002;29:1–24. doi: 10.1023/a:1015765201129. [DOI] [PMC free article] [PubMed] [Google Scholar]
- Samtani MN, Jusko WJ. Stability of dexamethasone sodium phosphate in rat plasma. Int J Pharm. 2005;301:262–266. doi: 10.1016/j.ijpharm.2005.06.003. [DOI] [PMC free article] [PubMed] [Google Scholar]
- Schindler R, Mancilla J, Endres S, Ghorbani R, Clark SC, Dinarello CA. Correlations and interactions in the production of interleukin-6 (IL-6), IL-1, and tumor necrosis factor (TNF) in human blood mononuclear cells: IL-6 suppresses IL-1 and TNF. Blood. 1990;75:40–47. [PubMed] [Google Scholar]
- Svensson B, Boonen A, Albertsson K, van der Heijde D, Keller C, Hafstrom I. Low-dose prednisolone in addition to the initial disease-modifying antirheumatic drug in patients with early active rheumatoid arthritis reduces joint destruction and increases the remission rate: a two-year randomized trial. Arthritis Rheum. 2005;52:3360–3370. doi: 10.1002/art.21298. [DOI] [PubMed] [Google Scholar]
- Turnbull AV, Rivier CL. Regulation of the hypothalamic-pituitary-adrenal axis by cytokines: actions and mechanisms of action. Physiol Rev. 1999;79:1–71. doi: 10.1152/physrev.1999.79.1.1. [DOI] [PubMed] [Google Scholar]
- Wassenberg S, Rau R, Steinfeld P, Zeidler H. Very low-dose prednisolone in early rheumatoid arthritis retards radiographic progression over two years: a multicenter, double-blind, placebo-controlled trial. Arthritis Rheum. 2005;52:3371–3380. doi: 10.1002/art.21421. [DOI] [PubMed] [Google Scholar]