Abstract
Detailed analyses of the clone-based genome assembly reveal that the recent duplication content of mouse (4.94%) is now comparable to that of human (5.5%), in contrast to previous estimates from the whole-genome shotgun sequence assembly. The architecture of mouse and human genomes differ dramatically; most mouse duplications are organized into discrete clusters of tandem duplications that are depleted for genes/transcripts and enriched for LINE and LTR retroposons. We assessed copy-number variation of the C57BL/6J duplicated regions within 15 mouse strains used for genetic association studies, sequencing, and the Mouse Phenome Project. We determined that over 60% of these basepairs are polymorphic between the strains (on average 20 Mbp of copy-number variable DNA between different mouse strains). Our data suggest that different mouse strains show comparable, if not greater, copy-number polymorphism when compared to human; however, such variation is more locally restricted. We show large and complex patterns of inter-strain copy-number variation restricted to large gene families associated with spermatogenesis, pregnancy, viviparity, pheromone signalling, and immune response.
Initial estimates suggested that 1-2% of the mouse genome1-3 consisted of high identity (>90%) duplications. These estimates, however, were complicated by the whole-genome shotgun sequence assembly (WGSA) method, which cannot resolve large, highly identical duplications. In particular, the largest (>15 kb) and most identical (>97%) duplicated segments4 are often missing, collapsed, or mis-assigned as part of WGSA draft assemblies. Missing duplications, for example, are thought to result from difficulties in assembling regions of the genome where there is an excess of sequence mate-pair violations due to paralogous sequences. As the mouse genome assembly has progressed from WGSA to an ordered BAC-based assembly, the segmental duplication (SD) content has gradually increased5,6. Accurate resolution of the duplicated regions is particularly critical as some of these regions have been shown to be highly variable in copy-number between commonly related strains of mice7-11, enriched in lineage-specific gene families undergoing positive selection12,13, and preferential sites of large-scale rearrangement associated with chromosome evolution in the rodent lineage6,14-16. Here we present a detailed analysis of the recent duplication content of the mouse clone-based finished genome assembly and assess copy-number variation (CNV) of these regions in 15 different inbred strains of mice. The results suggest distinct properties of mouse SDs when compared to human and reveal previously unrecognized complex patterns of structural variation.
RESULTS
A self-comparison of the current mouse assembly genome (Build36) identifies 141.4 Mbp of SD (>1 kbp in length and >90% identity) (See Supplementary Note for details). We confirmed 96% (83.14/86.63 Mbp) of the largest (>10 kbp) and most identical (>94%) duplications using a previously described detection strategy that is independent from the assembly2,17. As a second measure of validation, we examined a total of 24 large-insert clones that had been shown to produce multi-site signals by FISH on C57BL/6J metaphase chromosomes2,8. Of the corresponding sequences, 23/24 were confirmed as duplicated by at least one of our measures for duplication (Supplementary Table 1). Using only the assembly-based comparison, we found that the majority (21/24) carried more than 40% duplicated basepairs attesting to the high quality of the mouse assembly (Supplementary Table 1). In total, if we consider all pairwise alignments (<94% identity) and all those (>94% sequence identity) that are confirmed by two independent methods, we calculate the SD content of the mouse genome to be 4.94%. This value represents a 2- to 3-fold increase from previous estimates1-3.
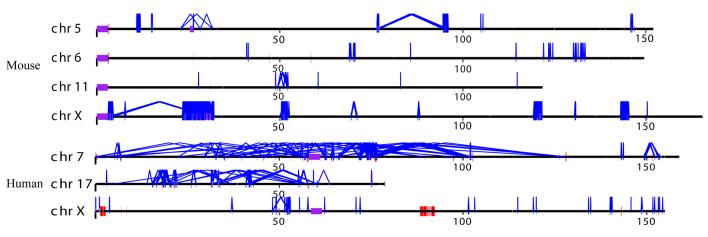
The availability of the human and mouse genomes as clone-ordered BAC-based sequence assemblies provides the first opportunity to systematically compare SD sequence properties for two mammalian genomes (Table 1). Both genomes show similar levels of duplication (∼5%) distributed in a highly non-random fashion (Supplementary Fig. 1). We find that recent mouse duplications are restricted to fewer genomic locations, with a total of 149 mouse duplication blocks (Table 1, Fig. 1) >100 kb in length compared to 269 blocks within the human genome (Build36). While fewer in number, murine duplication blocks are 50-80% larger in size. For example, there are a total of 19 mouse duplication blocks greater than 1 Mb (Fig. 1) compared to 11 mapped within the human genome (Table 1, Supplementary Table 2). Intrachromosomal duplications are more abundant in both genomes (Table 1); however, in the mouse genome there is a mode at ∼95% sequence identity, while in humans the mode is shifted to >99%. This difference cannot be explained solely by differences in the effective substitution rate18. There remains the possibility that the largest and most identical duplications map to gaps in the current mouse genome assembly.
Table 1.
Segmental duplication features of mouse and human.
| Mouse (Build36) | Human (Build36) | |
|---|---|---|
| Non-redundant basepairs | 126.0 Mb (4.94% genome) | 159.2 Mb (5.52% genome) |
| Number of pairwise alignment (intrachromosomal) | 39168 (519.7 Mb) | 10384 (149.4 Mb) |
| Number of pairwise alignment (interchromosomal) | 52423 (130.5 Mb) | 15530 (149.7 Mb) |
| Duplication blocks (>100 kb) | 149 | 269 |
| Duplication blocks (>1 Mb) | 19 | 11 |
| Number of pairwise alignments per block | 4 ∼ 7557 (median 87) | 2 ∼ 601 (median 34) |
| Proportion of Tandem Duplications | ||
| All duplications (>1 kb) | 35.2% | 21.6% |
| Duplications (>10 kb) | 88.6% | 28.4% |
| Duplications (>20 kb) | 89.2% | 32.9% |
| LINE enrichment (all duplication) | 69% enriched (p<0.001) | 5% depleted (p>0.05) |
| SINE enrichment (all duplication) | 49% depleted (p<0.001) | 9.9% enriched (p<0.05) |
| LTR enrichment (duplication>20 kb) | 80% enrichment (p<0.001) | 21.8% enriched (p<0.05) |
| Exon density (exon/Mb) | ||
| RefSeq | 32 (55.8% depleted, p<0.001) | 56 (14.7% depleted, p<0.05) |
| EST (spliced) | 230 (7.9% depleted, p>0.05) | 599 (62.3% enriched, p<0.001) |
Duplication blocks were defined as regions containing large, high identity pairwise alignments (>10 kb, >95% identity) where the sum of non-redundant basepairs is >100 kb. The significance of the enrichment was determined by simulating the genomic features in random sample (n=1000) of mouse/human genomic sequence.
Figure 1. (a) Mouse duplication and copy-number variant genomic landscape.
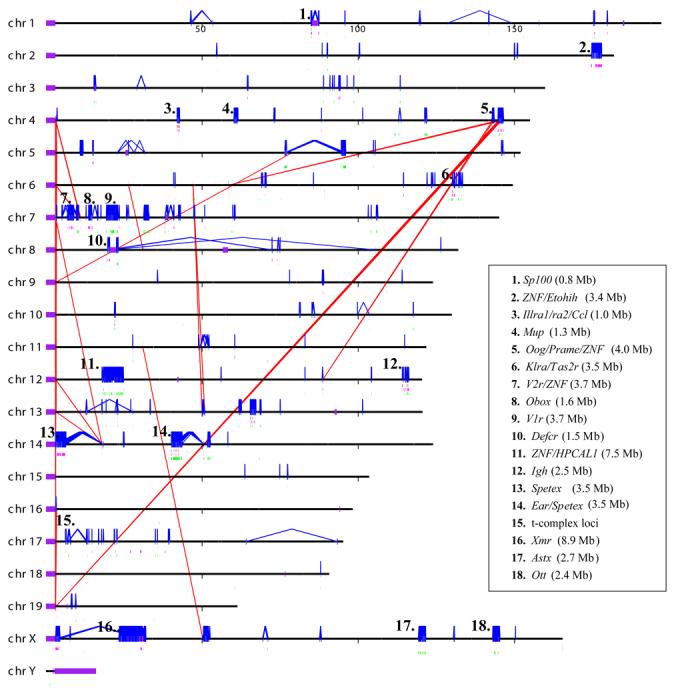
Interchromosomal (red) and intrachromosomal (blue) duplications (>20 kb and >94% sequence identity) are shown for the C57BL/6J mouse genome. Copy-number polymorphic duplicated regions are flagged if two or more strains show a gain (green bars) or loss (pink bars) with respect to C57BL/6J. Brown bars highlight regions showing both gain and loss. Some of the largest duplicated and CNV regions are enumerated and labeled based on gene content. Mouse chromosomes 7, 12, 14, and X show the greatest preponderance of large duplication blocks. In the case of chromosome 7, the duplication blocks account for 32% of the first 50 Mb of that chromosome. (b) Mouse vs. human genome duplication pattern. Mouse and human intrachromosomal duplication patterns are compared for chromosome 7, 17, and X. Note: the human interspersed pattern of recent duplications when compared to the tandem clusters in mouse for the autosomes. A greater fraction of the mouse X chromosome is duplicated (12.8% in mouse vs. 7.8% in human). The X chromosome is syntenic between man and mouse. Human chr17 is syntenic to mouse chr11 and human chr7 is syntenic to mouse chr6 and chr5 based on UCSC genome browser human net track.
As noted previously2,5,8, there are few examples of large interchromosomal duplication (Table 1) and most large (>10 kb) intrachromosomal duplications are tandemly organized with >89% of the pairwise alignments mapping in close proximity to one another (Fig. 2). Mouse duplicated sequences have 3 to 4 times as many paralogs when compared to human. This finding implies that structural variation of the mouse genome mediated by non-allelic homologous recombination may be more common but should be more locally restricted. We compared the exon density (RefGene annotation) between unique and duplicated regions of the mouse genome (Table 1) and found a greater depletion of exons in mouse segmental duplication when compared to human. To eliminate the possibility of incomplete gene annotation and potential processed pseudogenes, we examined the density of all ESTs that show evidence of splicing. Once again, the proportion of spliced ESTs is reduced (7.9%) when compared to unique regions of the genome, although this difference is not significant by simulation (Table 1). In contrast, the human genome shows a strong (p<0.001) enrichment of spliced ESTs within segmental duplications.
Figure 2. Distribution of mouse versus human duplication pairwise alignments.
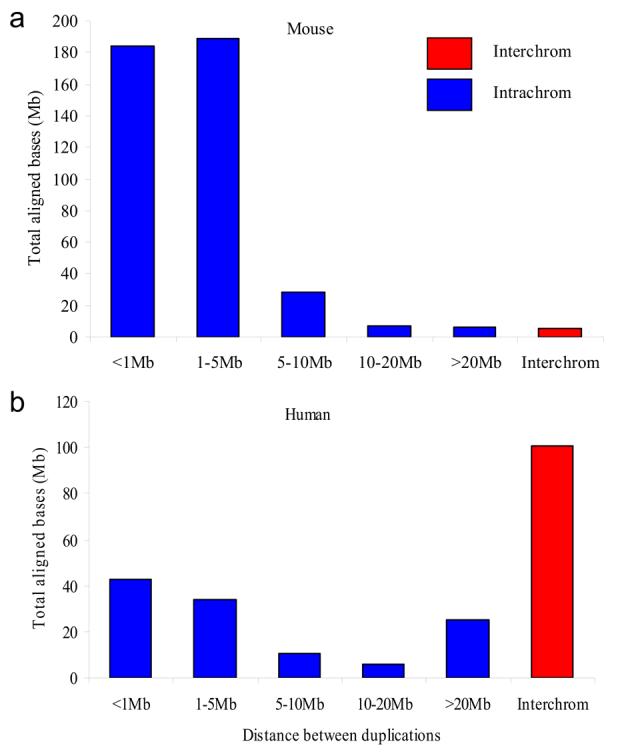
The distance between segmental duplications was computed for the mouse (Build36) and the human (Build36) genome. All pairwise alignments >10 kb in length were binned into various categories. Tandem duplications that map within 5 Mb of one another constitute the bulk of mouse segmental duplications.
The enrichment of Alu-SINE repeat elements at the boundaries of new human segmental duplications has been taken as evidence that these elements played a role in the dispersal of SDs in the ancestral primate genome19,20. We examined the repeat composition of mouse segmental duplications and found them significantly enriched for both LINE and repeat elements (1.5- to 2-fold enrichment) (Supplementary Table 3, Fig. 3). In contrast, SINE elements were underrepresented (49%, Table 1) when compared to unique regions of the mouse genome. An examination of the transition boundaries between larger (>20 kb) segmental duplication alignments shows the most dramatic enrichment. Approximately 32% of the basepairs at these boundaries consist of LINE repeat sequences (Fig. 3), while 20% are LTR repeat elements. If we limit the analysis to unique-duplication transition regions, we find the most significant enrichment for LTR sequences in the duplicated portion when compared to the flanking unique sequence (Fig. 3c). Either side of the transition region appears equally enriched in LINE repeat elements, although this enrichment is significant only for the youngest LINEs (<12% sequence divergence from consensus) (Supplementary Table 4).
Figure 3. LINE and LTR enrichment within mouse segmental duplications.
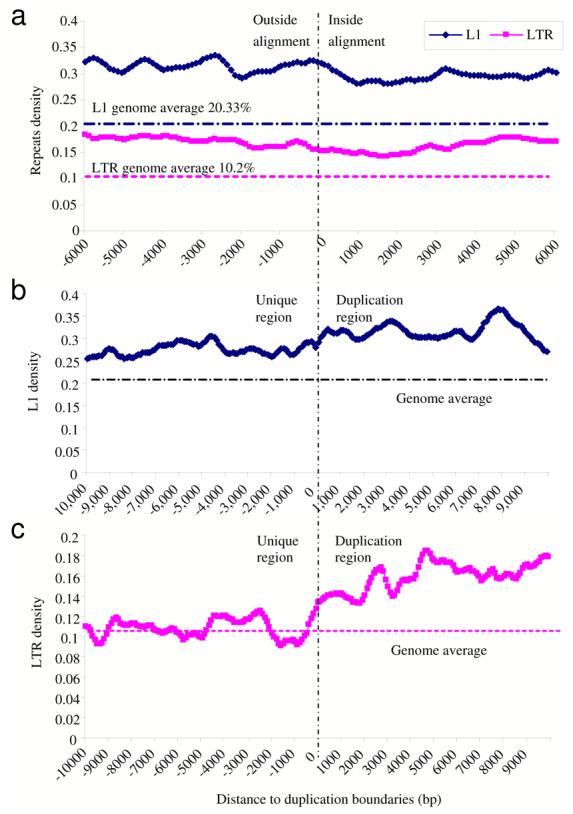
(a) We examined all large pairwise alignments (>20 kb) and computed the LINE and LTR content (in 500 bp windows; sliding increments of 100 bp) on either side of the alignment boundary as determined by whole-genome analysis comparison method. Segmental duplications are significantly enriched for both LINE and LTR repeats. We next examined all transition regions where there was at least 10 kb of unique sequence abutting segmental duplication (n=5325 alignments) and computed the (b) LINE content and (c) LTR content on either side of the unique/duplication transition boundary. LTR repeat sequences show specific enrichment for segmental duplications when compared to unique transition regions, while both the flanking unique and duplicated regions were enriched for LINE repeats.
Numerous studies in different organisms have shown that segmental duplications are enriched 4- to 10-fold for copy-number variation9,21-23 although such variation also occurs outside regions of SD. Using our duplication map of the mouse genome, we specifically focused on the design of a customized high-density oligonucleotide array (average 1 probe/481 bp) targeted to C57BL/6J SDs that were confirmed by both computational methods (Supplementary Note). As a control, we also selected 273 regions that had been predicted to be copy-number variant based on earlier BAC-arrayCGH experiments (Supplementary Table 5). We selected 15 inbred strains of mice based on their genealogical relationship to C57BL/6J or use as NIEHS sequencing strains/Mouse Phenome Project. All arrayCGH experiments were performed using C57BL/6J as the reference strain.
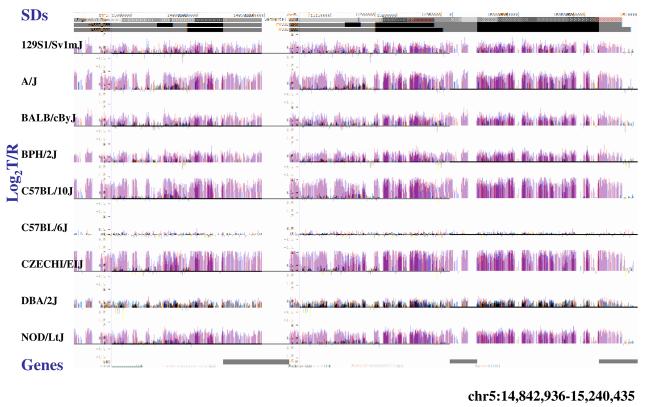
Based on the raw log2 signal intensity data24, striking CNV was observed between the C57BL/6J and the other inbred strains (Fig. 4a). Signal intensity differences as detected by array CGH were greater than a similar dataset generated for assessing human CNV over segmental duplications21, possibly due to the high level of homozygosity and fixation of copy-number variation within each inbred strain, facilitating their detection. We used a Hidden Markov Model (HMM) to identify significant transitions in log2 ratios corresponding to a likely copy-number gain or loss. Our HMM requires at least 24 probes of unchanged state before calling a region as copy-number variant, thereby, limiting our detection to CNVs >12 kbp in length. We validated our CNVs by comparing our results to 42 “high confidence” copy-number variants for intervals that had been predicted previously by Graubert and colleagues in five inbred strains that overlapped with our dataset. The comparison (Supplementary Table 5) showed that the HMM performed well, correctly identifying 95% (41/42) of these sites. As a control, we compared two different individuals from the C57BL/6J and identified 4/2,424 potential copy-number differences (Supplementary Table 6). Two of these positives corresponded to a known sites of somatic variation (IgH) leaving two potential false positives or regions that are variable between C57BL/6J individuals.
Figure 4. Copy-number variable mouse segmental duplications.
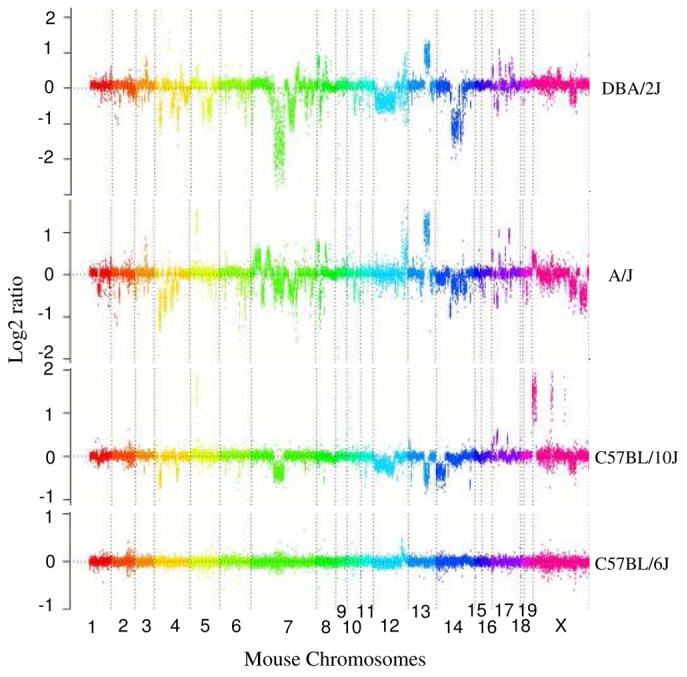
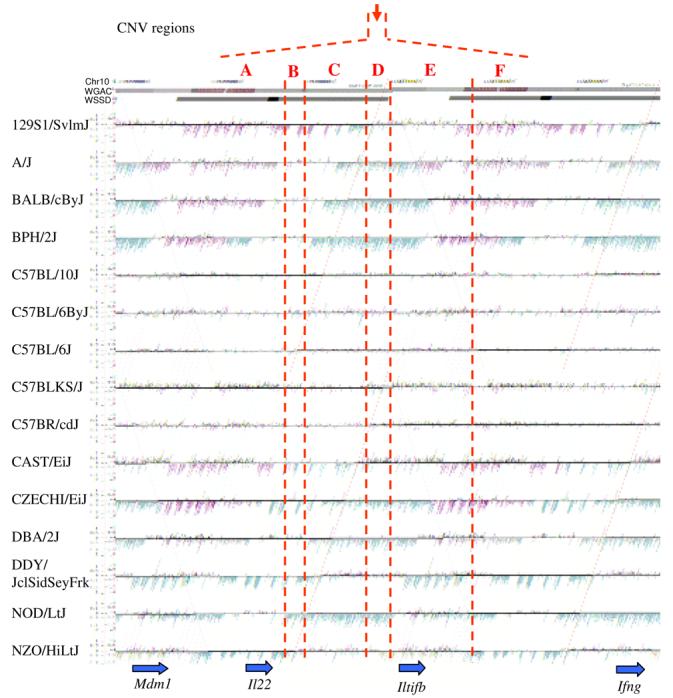
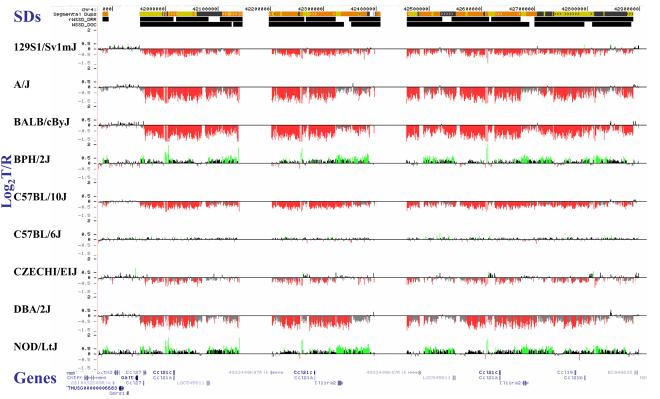
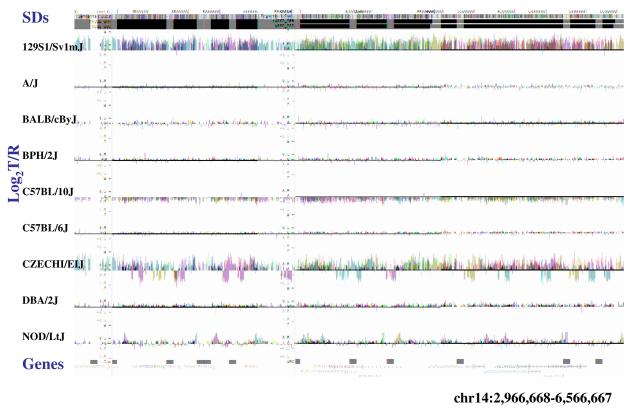
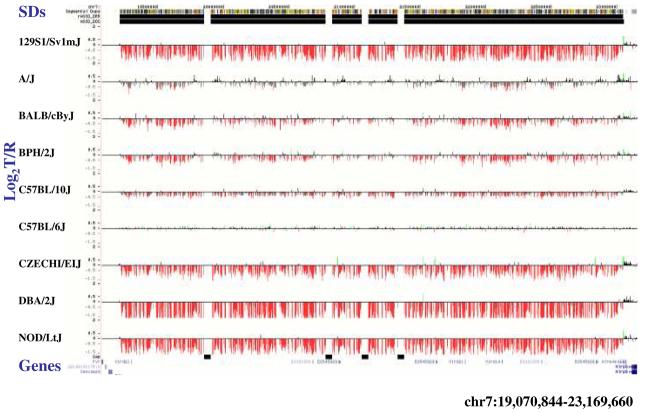
(a) Underlying array comparative genomic hybridization data are shown for four strains compared to C57BL/6J. SD and flanking regions (159 Mb) were ordered and collapsed according to chromosomal position (color). (b) An ∼170 kb segmental duplication region on chromosome 10 shown from the browser (http://mouseparalogy.gs.washington) in more detail for 15 different mouse strains. Significant (>1.5 standard deviation) decreases (red) and increases (green) are highlighted. At least six distinct regions (A-F) of copy-number variation can be discerned within the duplication block (WGAC=whole-genome assembly comparisons, WSSD=whole-genome shotgun sequence detection). Region A & E represent high-identity duplications of the interleukin 22 gene and, therefore, the arrayCGH signal represents the average differential of both regions and the arrayCGH patterns mirror one another. (c-f) Other examples of copy-number variable regions of segmental duplication depicted for nine strains, including: (c) the CCl and Il11ralpha duplication block (chr4:41,687,499-42,962,500), (d) a Spetex duplication block (chr14:2,966,668-6,566,667), (e) a vomeronasal receptor (V1r) duplication block (chr7:19,070,844-23,169,660), and (f) a Speer4d gene family duplicated region (chr5:14,842,936-15,240,435).
When comparing all 15 strains against the C57BL/6J reference, we identify in total 2,424 CNV sites (1,259 gains and 1,958 losses). 56% of these CNV events in each strain are predicted as high-confidence intervals (p>0.8)—and of these 85∼92% are novel when compared to previous reports (Supplementary Table 6, Supplementary Table 7, Table 2). Most of the variation in segmental duplications was not detected previously as probes were under-represented 10-fold when compared to unique regions and 50-fold when compared to our C57BL/6J duplication-specific microarray (Supplementary Table 8)10. Even among the confirmed sites of CNV, we observe significantly more substructure than previously reported, revealing a complex pattern of copy-number gain and loss associated with mouse segmental duplications (Fig. 4b; Fig. 1). We note that our HMM approach is particularly conservative on boundary definition and consequently over fragments genomic regions by an estimated factor of two (Supplementary Note). Nevertheless, we identified over 182 large intervals (>100 kb) of copy-number loss and gain (Fig. 1, Fig. 4). Overall, based on our survey we predict that 61.6% of the SDs are variable in copy-number with, on average, 20 Mbp of duplication for any strain showing copy-number difference when compared to C57BL/6J.
Table 2.
Mouse CNV regions mapping to segmental duplications.
| Regions | Genome content (Mb) |
Probe count |
Probe density (bp/ probe) |
CNV Loss |
CNV Gain |
All CNV (Gain or loss) |
CNV (gain and loss) |
||||||||||
|---|---|---|---|---|---|---|---|---|---|---|---|---|---|---|---|---|---|
| Avg (Mp/ strain) |
% | Non redundant space in all strains (Mp) |
% | Avg (Mp/ strain) |
% | Non redundant space in all strains (Mp) |
% | Avg (Mp/ strain) |
% | Non redundant space in all strains (Mp) |
% | Non redundant space in all strains (Mp) |
% | ||||
| SD | 97.86 | 203,307 | 481 | 12.73 | 13.0% | 38.63 | 39.5% | 6.38 | 6.5% | 26.46 | 27.0% | 19.0 | 20.5% | 56.89 | 58.1% | 8.21 | 8.4% |
| 10 kb flanking SD (unique) |
22.94 | 54,199 | 423 | 1.01 | 4.4% | 3.9 | 17.0% | 0.66 | 2.9% | 2.87 | 12.5% | 1.65 | 7.9% | 6.12 | 26.7% | 0.65 | 2.8% |
| Li_CNV (in SD) | 49.71 | 127,520 | 390 | 3.39 | 6.6% | 8.54 | 17.2% | 2.04 | 4.1% | 5.93 | 11.9% | 5.31 | 10.9% | 12.79 | 25.7% | 1.68 | 3.4% |
| Li_CNV (unique) | 37.94 | 105,692 | 359 | 0.61 | 1.6% | 1.83 | 4.8% | 0.45 | 1.2% | 1.53 | 4.0% | 1.05 | 3.0% | 3.21 | 8.5% | 0.16 | 0.4% |
| All probe regions | 159.4 | 385,206 | 414 | 14.30 | 9.0% | 44.37 | 27.8% | 7.43 | 4.7% | 30.78 | 19.3% | 21.54 | 14.4% | 66.18 | 41.5% | 8.98 | 5.6% |
SD=Segmental duplications (WGAC+WSSD combined); 10k flanking=10 kbp of unique sequence flanking SD; Li_CNV=Regions identified by Li, et al, 2006 as polymorphic, Li_CNV(unique)=unique regions that did not intersect with SD. CNV(gains&losses)=regions showing evidence of both gains and losses when compared against C57BL/6J, based on arrayCGH of 15 test strains against C57BL/6J.
We identified 353 genes embedded within SDs that showed either gain or loss (Supplementary Table 6). Of these, 194 CNV intervals are sufficiently large enough to affect the entire gene, including 31 genes showing both gains and losses in different strains with respect to C57BL/6J (Supplementary Table 6). Several of the copy-number variant genes are associated with spermatogenesis, pregnancy, and viviparity (e.g. Spetex, Xmr, Tcte, Ott, prolactin/proliferin, Il11ralpha)25,26. Other gene families associated with pheromone response show large-scale CNV between the strains (e.g. vomeronasal receptor (V2r and V1r)27 and major urinary proteins (Mup) gene families28). Similar to the human genome, immune response genes show extensive copy-number polymorphism. For example, the defensin genes (Defcr21, 22, 23, Def5b1), neuronal apoptosis inhibitory protein (Naip) gene family and killer cell lectin-like receptor family a (Klra) are all part of CNV duplication blocks associated with strain variability to infection29-31.
DISCUSSION
Although similar in proportion (∼5 %), recent mouse genomic duplications, in contrast to humans, are organized into discrete clusters of tandem duplications that are depleted for genes/transcripts and enriched for LINE and LTR retroposons. We hypothesize that the strong association with younger LINE elements, as opposed to primate Alu SINE elements, might explain some of the key differences between human and mouse duplications. For example, LINE repeat sequences preferentially map to AT-rich, gene-poor regions due the sequence preference of the RT-endonuclease32. Similar bias against genes has been observed for LTR elements33. If LINE/LTR sequences promote segmental duplication, it may explain why there is a deficiency of genes/transcripts in mice, while in humans the trend is in the opposite direction (i.e. segmental duplications associate with SINE-rich, gene-rich regions of the genome)32. In addition, we find that mouse duplicated sequences have 3 to 4 times as many paralogs when compared to human. We conservatively estimate that at least 20 Mb of segmental duplication is copy-number variable between strains (Table 2). When compared to recent surveys of copy-number variation in humans34,35, we find that different strains of mice show as much, if not more, copy-number variable DNA within the duplicated regions. We propose that the larger number of local pairwise alignments in tandem orientation within the mouse increases the potential for non-allelic homologous recombination and, thus, the mutation frequency. In this regard, it is interesting that of the 15 CNVs that intersect with Egan and colleagues, 14/15 were shown to occur recurrently within mouse strains10. Those with the highest frequency of new mutation (∼1 spontaneous mutation per 100 newborns) are composed almost entirely (77-92%) of segmental duplications (Supplementary Table 7). Further studies of the normal pattern of copy-number variation within wild outbred lines of mice and sequencing of additional murid genomes will be necessary to assess the generality of these findings.
METHODS
DNA Samples
All spleen-derived DNA samples were obtained from male individuals representing 15 inbred strains of mice (Jackson Laboratory). These included: C57BL/6J, DBA/2J, A/J, C57BL/10J, CZECHI/EiJ, CAST/EiJ, BPH/2J, BALB/cByJ, C57BLKS/J, 129S1/SvlmJ, DDY/JclSidSeyFrkJ, C57BR/cdJ, C57BL/6ByJ, NZO/HiLtJ, and NOD/L5J. The reference sample in all these experiments was C57BL/6J (Prep#37347, a G227 male individual born Oct. 4, 2005). As a control, an arrayCGH experiment was performed against a second C57BL/6J individual (Prep#37579, a G230 male individual born Sept. 27, 2006). Inbred strains were selected in an effort to sample genetic diversity36 and to include strains from the Mouse Phenome Project and NIEHS sequencing projects.
Segmental Duplication Characterization
Two independent approaches were used to detect segmental duplications: WGAC (whole-genome assembly comparison) is a BLAST-based analysis of all assembled sequence that detects self-alignments (>90% and 1 kb); WSSD (whole-genome shotgun sequence detection) is an assembly independent approach that examines the reference sequence for an increase in WGS read depth-of-coverage (WSSD-DOC) and/or increase in the divergence read ratio (WSSD-DRR). We mapped 40,782,208 sequence reads against the Build36 genome assembly as part of the mouse WSSD analysis. We estimated the duplication content of the mouse genome based on the sum of low-identity WGAC (<94%) and high-identity WGAC (>10 kb, >94%) that were confirmed by the union of WSSD-DOC and WSSD-DRR estimates. Repeat content and subfamily designation was determined using RepeatMasker. Significance was determined by permutation (randomly sampling the genome and computing an enrichment greater or equal to that observed within regions classified as segmentally duplicated. All underlying segmental duplication analysis data are available from http://mouseparalogy.gs.washington.edu and have been placed as customized tracks on the UCSC browser and the NCBI MapViewer for Build36.
Array Comparative Genomic Hybridization and CNV Detection
We designed a customized oligonucleotide microarray platform for array comparative genomic hybridization (NimbleGen). We targeted 385,000 probes to 159.4 Mb regions of the mouse genome assembly (Build36) where segmental duplications and/or CNVs were previously identified, as indicated in Table 2. Probe design and the sample hybridization were performed at NimbleGen (Madison, WI, USA) using standard tiling array protocol. We identified copy-number variant regions between mouse strains using a novel HMM (see Supplementary Note for detailed description and software availability).
Supplementary Material
ACKNOWLEDGEMENTS
We thank Dr. Lucy Rowe, Connie Birkenmeier, and Gary Churchill for providing additional information regarding the relatedness of different inbred strains of mice used in this study. We thank Anne Morrison for DNA sample preparation. We thank Tonia Brown, Kari Augustyn and Heather Mefford for assistance in preparation of this manuscript.
Footnotes
Accession number. Microarray data have been deposited in the Gene Expression Omnibus database under accession number GSE11369.
REFERENCES
- 1.Cheung J, et al. Recent segmental and gene duplications in the mouse genome. Genome Biol. 2003;4:R47. doi: 10.1186/gb-2003-4-8-r47. [DOI] [PMC free article] [PubMed] [Google Scholar]
- 2.Bailey JA, Church DM, Ventura M, Rocchi M, Eichler EE. Analysis of segmental duplications and genome assembly in the mouse. Genome Res. 2004;14:789–801. doi: 10.1101/gr.2238404. [DOI] [PMC free article] [PubMed] [Google Scholar]
- 3.Bailey JA, Eichler EE. Genome-wide detection of segmental duplication within mammalian organisms. In: Ebert J, editor. Proceedings of the 68th Cold Spring Harbor Symposium: Genome of Homo sapiens; New York: Cold Spring Harbor Press; 2003. [DOI] [PubMed] [Google Scholar]
- 4.She X, et al. Shotgun sequence assembly and recent segmental duplications within the human genome. Nature. 2004;431:927–30. doi: 10.1038/nature03062. [DOI] [PubMed] [Google Scholar]
- 5.She X, et al. A preliminary comparative analysis of primate segmental duplications shows elevated substitution rates and a great-ape expansion of intrachromosomal duplications. Genome Res. 2006;16:576–83. doi: 10.1101/gr.4949406. [DOI] [PMC free article] [PubMed] [Google Scholar]
- 6.Sainz J, et al. Segmental duplication density decrease with distance to human-mouse breaks of synteny. Eur J Hum Genet. 2006;14:216–21. doi: 10.1038/sj.ejhg.5201534. [DOI] [PubMed] [Google Scholar]
- 7.Li J, et al. Genomic segmental polymorphisms in inbred mouse strains. Nat Genet. 2004;36:952–4. doi: 10.1038/ng1417. [DOI] [PubMed] [Google Scholar]
- 8.Snijders AM, et al. Mapping segmental and sequence variations among laboratory mice using BAC array CGH. Genome Res. 2005;15:302–11. doi: 10.1101/gr.2902505. [DOI] [PMC free article] [PubMed] [Google Scholar]
- 9.Graubert TA, et al. A high-resolution map of segmental DNA copy number variation in the mouse genome. PLoS Genet. 2007;3:e3. doi: 10.1371/journal.pgen.0030003. [DOI] [PMC free article] [PubMed] [Google Scholar]
- 10.Egan CM, Sridhar S, Wigler M, Hall IM. Recurrent DNA copy number variation in the laboratory mouse. Nat Genet. 2007;39:1384–9. doi: 10.1038/ng.2007.19. [DOI] [PubMed] [Google Scholar]
- 11.Watkins-Chow DE, Pavan WJ. Genomic copy number and expression variation within the C57BL/6J inbred mouse strain. Genome Res. 2008;18:60–6. doi: 10.1101/gr.6927808. [DOI] [PMC free article] [PubMed] [Google Scholar]
- 12.Bailey JA, Eichler EE. Primate segmental duplications: crucibles of evolution, diversity and disease. Nat Rev Genet. 2006;7:552–64. doi: 10.1038/nrg1895. [DOI] [PubMed] [Google Scholar]
- 13.Nguyen DQ, Webber C, Ponting CP. Bias of selection on human copy-number variants. PLoS Genet. 2006;2:e20. doi: 10.1371/journal.pgen.0020020. [DOI] [PMC free article] [PubMed] [Google Scholar]
- 14.Armengol L, Pujana MA, Cheung J, Scherer SW, Estivill X. Enrichment of segmental duplications in regions of breaks of synteny between the human and mouse genomes suggest their involvement in evolutionary rearrangements. Hum Mol Genet. 2003;12:2201–8. doi: 10.1093/hmg/ddg223. [DOI] [PubMed] [Google Scholar]
- 15.Bailey JA, Baertsch R, Kent WJ, Haussler D, Eichler EE. Hotspots of mammalian chromosomal evolution. Genome Biol. 2004;5:R23. doi: 10.1186/gb-2004-5-4-r23. [DOI] [PMC free article] [PubMed] [Google Scholar]
- 16.Armengol L, et al. Murine segmental duplications are hot spots for chromosome and gene evolution. Genomics. 2005;86:692–700. doi: 10.1016/j.ygeno.2005.08.008. [DOI] [PubMed] [Google Scholar]
- 17.Bailey JA, et al. Recent segmental duplications in the human genome. Science. 2002;297:1003–7. doi: 10.1126/science.1072047. [DOI] [PubMed] [Google Scholar]
- 18.Waterston R. Initial sequencing and comparative analysis of the mouse genome. Nature. 2002;420:520–62. doi: 10.1038/nature01262. [DOI] [PubMed] [Google Scholar]
- 19.Bailey JA, Giu L, Eichler EE. An Alu transposition model for the origin and expansion of human segmental duplications. Am J Hum Genet. 2003;73:823–34. doi: 10.1086/378594. [DOI] [PMC free article] [PubMed] [Google Scholar]
- 20.Jurka J, Kohany O, Pavlicek A, Kapitonov VV, Jurka MV. Duplication, coclustering, and selection of human Alu retrotransposons. Proc Natl Acad Sci U S A. 2004;101:1268–72. doi: 10.1073/pnas.0308084100. [DOI] [PMC free article] [PubMed] [Google Scholar]
- 21.Sharp AJ, et al. Segmental duplications and copy-number variation in the human genome. Am J Hum Genet. 2005;77:78–88. doi: 10.1086/431652. [DOI] [PMC free article] [PubMed] [Google Scholar]
- 22.Tuzun E, et al. Fine-scale structural variation of the human genome. Nat Genet. 2005;37:727–32. doi: 10.1038/ng1562. [DOI] [PubMed] [Google Scholar]
- 23.Perry GH, et al. Hotspots for copy number variation in chimpanzees and humans. Proc Natl Acad Sci U S A. 2006;103:8006–11. doi: 10.1073/pnas.0602318103. [DOI] [PMC free article] [PubMed] [Google Scholar]
- 24.Selzer RR, et al. Analysis of chromosome breakpoints in neuroblastoma at sub-kilobase resolution using fine-tiling oligonucleotide array CGH. Genes Chromosomes Cancer. 2005;44:305–19. doi: 10.1002/gcc.20243. [DOI] [PubMed] [Google Scholar]
- 25.Reynard LN, et al. Expression analysis of the mouse multi-copy X-linked gene Xlr-related, meiosis-regulated (Xmr), reveals that Xmr encodes a spermatid-expressed cytoplasmic protein, SLX/XMR. Biol Reprod. 2007;77:329–35. doi: 10.1095/biolreprod.107.061101. [DOI] [PubMed] [Google Scholar]
- 26.Kerr SM, Taggart MH, Lee M, Cooke HJ. Ott, a mouse X-linked multigene family expressed specifically during meiosis. Hum Mol Genet. 1996;5:1139–48. doi: 10.1093/hmg/5.8.1139. [DOI] [PubMed] [Google Scholar]
- 27.Brennan PA, Zufall F. Pheromonal communication in vertebrates. Nature. 2006;444:308–15. doi: 10.1038/nature05404. [DOI] [PubMed] [Google Scholar]
- 28.Sharrow SD, Vaughn JL, Zidek L, Novotny MV, Stone MJ. Pheromone binding by polymorphic mouse major urinary proteins. Protein Sci. 2002;11:2247–56. doi: 10.1110/ps.0204202. [DOI] [PMC free article] [PubMed] [Google Scholar]
- 29.Endrizzi MG, Hadinoto V, Growney JD, Miller W, Dietrich WF. Genomic sequence analysis of the mouse Naip gene array. Genome Res. 2000;10:1095–102. doi: 10.1101/gr.10.8.1095. [DOI] [PMC free article] [PubMed] [Google Scholar]
- 30.Wright EK, et al. Naip5 affects host susceptibility to the intracellular pathogen Legionella pneumophila. Curr Biol. 2003;13:27–36. doi: 10.1016/s0960-9822(02)01359-3. [DOI] [PubMed] [Google Scholar]
- 31.Lee SH, et al. Susceptibility to mouse cytomegalovirus is associated with deletion of an activating natural killer cell receptor of the C-type lectin superfamily. Nat Genet. 2001;28:42–5. doi: 10.1038/ng0501-42. [DOI] [PubMed] [Google Scholar]
- 32.IHGSC Initial sequencing and analysis of the human genome. Nature. 2001;409:860–921. doi: 10.1038/35057062. [DOI] [PubMed] [Google Scholar]
- 33.Medstrand P, van de Lagemaat LN, Mager DL. Retroelement distributions in the human genome: variations associated with age and proximity to genes. Genome Res. 2002;12:1483–95. doi: 10.1101/gr.388902. [DOI] [PMC free article] [PubMed] [Google Scholar]
- 34.Redon R, et al. Global variation in copy number in the human genome. Nature. 2006;444:444–54. doi: 10.1038/nature05329. [DOI] [PMC free article] [PubMed] [Google Scholar]
- 35.Kidd JM, et al. Mapping and sequencing of structural variation from eight human genomes. Nature. 2008;453:56–64. doi: 10.1038/nature06862. [DOI] [PMC free article] [PubMed] [Google Scholar]
- 36.Beck JA, et al. Genealogies of mouse inbred strains. Nat Genet. 2000;24:23–5. doi: 10.1038/71641. [DOI] [PubMed] [Google Scholar]
Associated Data
This section collects any data citations, data availability statements, or supplementary materials included in this article.


