Abstract
Polymer membrane ion-selective electrodes containing lipophilic ionophores are traditionally interrogated by zero current potentiometry, which, ideally, gives information on the sample activity of ionic species. It is shown here that a discrete cathodic current pulse across an H+-selective polymeric membrane doped with the ionophore ETH 5294 may be used for the chronopotentiometric detection of pH in well buffered samples. However, a reduction in the buffer capacity leads to large deviations from the expected Nernstian response slope. This is explained by the local depletion of hydrogen ions at the sample-membrane interface as a result of the galvanostatically imposed ion flux in direction of the membrane. This depletion is found to be a function of the total acidity of the sample and can be directly monitored chronopotentiometrically in a flash titration experiment. The subsequent application of a baseline potential pulse reverses the extraction process of the current pulse, allowing one to interrogate the sample with minimal perturbation. In one protocol, total acidity is found to be proportional to the magnitude of applied current at the flash titration endpoint. More conveniently, the square root of the flash titration endpoint time observed at a fixed applied current is a linear function of the total acid concentration. This suggests that it is possible to perform rapid localized pH titrations at ion-selective electrodes without the need for volumetric titrimetry. The technique is explored here for acetic acid, MES and citric acid with promising results. Polymeric membrane electrodes on the basis of poly(vinyl chloride) plasticized with o-nitrophenyloctylether in a 1:2 mass ratio may be used for the detection of acids of up to ca. 1 mM concentration, with flash titration times on the order of a few seconds. Possible limitations of the technique are discussed, including variations of the acid diffusion coefficients and influence of electrical migration.
The accurate and rapid monitoring of solution pH is of paramount importance in environmental and industrial control and clinical diagnostics, and established pH electrodes are widely used for this purpose. Glass membrane electrodes have been most widely used over the past century, but they have some limitations1, 2 and alternative materials have been introduced, such as metal oxide electrodes3–5 for high temperature measurements, Al2O3- and Si3O4-based Ion Sensitive Field Effect Transistors (ISFETs)6–8 for miniaturization and mass fabrication purposes, and solvent polymeric membrane pH electrodes based on synthetic proton carriers2, 9–14 for bioanalytical pH measurements and food and beverage analyses. Optical sensors can also be used to measure pH,15–17 although there are additional fundamental assumptions that need to be made and their response is non-linear and the response range more narrow than their electrochemical counterparts.
Often the sample pH value does not provide sufficient information about a sample, and data on total acidity and alkalinity are required as well, for instance in beverage and food quality control,18 disease prevention19 nutritional information,20 and environmental protection.21, 22 Total alkalinity, for instance, is commonly employed in large-scale oceanographic CO2 system studies23 and for studying the effects of ocean acidification and bioerosion.24
Total acidity and total alkalinity have been widely determined with pH sensors used as endpoint detectors in titrimetric analysis, which is performed ex-situ on aliquots and causes an irreversible change of the sample composition. This is highly undesirable for continuous monitoring purposes and for microscopic samples such as proteins and nucleic acids involved in biological reactions, analyzing fluids of small organisms, and monitoring the acid content of precious radioactive preparations.25–28 Moreover, titrimetric procedures are prone to significant measurement errors with small sample volumes29, 30 because of uncontrollable parasitic diffusion of reagent from the microburet tip into the sample.31 Diffusional microtitration with controlled diffusive reagent delivery was therefore developed to improve the reliability of titrations in submicroliter volumes.29–32 Other approaches to the controlled delivery of reagents involve coulometry, where the titrant is electrochemically generated. It allows for extreme miniaturization (nanotitrations), fast response time and handling simplicity.33–35 In most cases, however, the chemical selectivity of the technique is limited. A chemically selective coulometric titration based on ion selective polymeric membrane was reported very recently,36 but coulometry either from metal electrodes or polymeric membranes still alter the bulk sample composition.
Recently, a localized titration approach that avoids alteration of the entire sample, called flash titration, was reported by the group of de Rooij.37 Here, base or acid titrant, coulometrically generated at an inert-metal electrode, neutralizes the analyte locally and the diffusional spreading of the pH change is detected at an ISFET pH sensor situated at a defined distance from the generating electrode. This technique does not require the titration of the entire sample and is rapid. However, the chemical selectivity of current devices is limited because of the use of simple metal electrodes. More traditional voltammetric techniques at platinum microelectrodes have also been reported for the measurement of total acidity.38–43 The analytical utility of this technique is based on monitoring the current induced by the turnover of hydrogen ions under mass-transport limited conditions. The method has been employed for the determination of strong and weak acids as well as monoprotic and polyprotic acids. While it avoids the need for added reagents and complete alteration of the sample composition, the chemical selectivity and hence its analytical utility may again be limited.
We explore here chemically selective, polymeric membrane-based hydrogen ion-selective electrodes ordinarily used in potentiometric sensors and containing the lipophilized Nile Blue derivative ETH 5294 (Chromoionophore I) as H+-ionophore,44–48 for the measurement of total acidity. The local diffusion layer is perturbed by a current pulse, which drives hydrogen ions from the sample in direction of the membrane. The observed potential at the same membrane gives information about the extent of hydrogen ion depletion. The basic measurement protocol for such pulsed chronopotentiometric ion-selective electrodes has been described earlier for sodium,49 calcium,50 silver,51 chloride52 and protamine-selective sensors,53 and is here adapted to a flash titration protocol to measure total acidity.
Experimental
Reagents
High molecular weight poly(vinyl chloride) (PVC), o-nitrophenyl octyl ether (o-NPOE), tetradodecylammonium tetrakis(4-chlorophenyl) borate (ETH 500), 9-(diethylamino)-5-octadecanoylimino-5H-benzo[a]phenoxazine (ETH 5294), tetrahydrofuran (THF), 2-morpholinoethanesulphonic acid (MES), citric acid, boric acid and all salts were purchased from Fluka (Milwaukee, WI). Sodium phosphate monobasic was purchased from Fisher Scientific (Fair Lawn, NJ), glacial acetic acid was obtained from Mallinckrodt Baker (Phillipsburg, NJ). Universal buffer solutions were composed of equal molar concentrations of monobasic sodium phosphate, sodium acetate and boric acid, adjusted to the desired pH with sodium hydroxide. Standard solution of sodium hydroxide was purchased from Sigma-Aldrich. (St. Louis, MO). Vinegar samples Roundy’s, IGA and Heinz brands were purchased from local supermarkets. Aqueous solutions were prepared by dissolving the appropriate compounds in Nanopure-deionized water (18.2 MΩ cm).
Membrane Preparation
Hydrogen Ion-selective membrane (~200 μm thick) was prepared by solvent casting with THF as a solvent, a membrane cocktail containing 10 wt% of the inert lipophilic salt ETH 500, 20 mmol/kg ETH 5294 and PVC and o-NPOE 1:2 by weight.
Electrodes
The membranes were cut with cork borer (6 mm diameter) from the parent membrane and incorporated onto a Philips electrode body (IS-561, Glasblaserei Moller, Zurich, Switzerland). The outer membrane area was calculated from its geometry as 20 mm2. The inner solution was in contact with an internal Ag/AgCl electrode. The external reference electrode was a double-junction Ag/AgCl electrode with saturated KCl as inner solution and a 1 M LiOAc bridge electrolyte. A high surface area coiled Pt-wire was used as a counter electrode in contact with the sample. The working electrodes were conditioned for at least 12 hours prior to experiments and kept in the conditioning solution when experiments were not underway. The inner filling and conditioning solution was 10 mM buffer solution of acetate/acetic acid (1:1) in 10 mM NaCl.
Experimental setup
A conventional three-electrode setup was used for the measurements where an internal Ag/AgCl electrode acted as the working electrode and the external reference electrode and counter electrode were immersed into the sample solution. The galvanostatic measurements were conducted with an AFCBI bipotentiostat (Pine Instruments, Grove City, PA) controlled by a PCI-MIO-16E4 interface board and LabVIEW 5.0 data acquisition software (National Instruments, Austin, TX) on a Macintosh computer. The potentials were sampled at 2 ms intervals. For fixed time experiments, the potential was calculated during the last 10% of the cathodic current pulse time, with an uptake time of 1 s and a stripping time of 15 s were used throughout the experiment unless specified otherwise. A baseline potential pulse of 0 V versus Ag/AgCl was applied as a stripping potential. For the details of potentiostatic/galvanostatic control switching system, see reference.49 All experiments were conducted at room temperature (21 – 22°C).
Calculations
Experimental transition times, which are depicted by inflection points on the V-t curve, were determined by computing the change in sign of the second derivative of the sampled data after performing a moving average smoothing operation over 20 data points. The transition time data were fit to equation 6 with the least squares fit function in Mathematica (Wolfram Research, Champaign, IL), yielding best fit values for tc, the time attributed to the non-Faradaic charging process at the beginning of the current pulse, and DHA, the diffusion coefficient of the undissociated weak acid in the aqueous phase. Algebraic transformations and curve plotting were also performed in Mathematica.
Theory
The phase boundary potential at the sample/membrane interface (x = 0) for neutral carrier-based galvanostatically controlled sensors can be described for a monovalent hydrogen ion H+ in a simplified manner by
| (1) |
where cH is the concentration of the cation in the aqueous phase boundary, [HL+] is the concentration of protonated ionophore L in the organic phase boundary, kH includes the phase transfer free energy of the ion and all the other symbols retain their conventional meanings.
In chronopotentiometric sensors of the type described here, an applied current pulse induces a defined flux of ions from the sample side in the direction of the membrane:
| (2) |
where i is the applied current and Ar is the membrane area. The hydrogen ion flux JH is here described as a one-dimensional diffusion as the predominant form of mass transport for the aqueous and organic side of the phase boundary (x = 0), respectively:
| (3) |
where DHA is the diffusion coefficient of bound hydrogen ion in the aqueous phase (shown here for the weak acid species) and Dorg is the diffusion coefficient of the protonated receptor in the membrane phase. If mass transport of the so-called free hydronium ion becomes significant, an effective diffusion coefficient may need to be used in analogy to published work.38 Solving eq 3 with the Laplace transformation gives the aqueous phase boundary concentration of the weak acid as a function of time:54
| (4) |
where c*HA is the initial (bulk) concentration of acid and tc describes the non-Faradaic charging process at the beginning of the current pulse. In analogy, the protonated receptor concentration at the phase boundary for the same experiment is given as:
| (5) |
The transition time τ at which the phase boundary concentration of weak acid reduces to zero is described by the well known Sand equation:
| (6) |
and similarly for the membrane side:
| (7) |
where LT is the total ionophore concentration in the membrane. Note that τlim in eq 7 is experimentally undesired and hence describes the upper limit for the method. It is an approximation because the total concentration of ionophore in the organic phase boundary may not remain constant in the course of the flash titration experiment as a result of transmembrane concentration gradients.
The potential change at the electrode before the transition time may be described by formulating the accumulation of the conjugate base at the membrane surface in complete analogy:
| (8) |
Equation 8 makes the simplifying assumption that the initial concentration of conjugate base is close to zero. The phase boundary potential may be predicted by inserting eqs 4, 5 and 8 with the acid dissociation constant into eq 1.
The membranes studied here do not contain added ion-exchanger sites, and the inner membrane potential may be described by the parallel extraction of anions X− from the inner solution to the membrane:
| (9) |
The membrane potential is calculated from EPB(0,t) – EPB(d,t). The depletion at the inner aqueous phase boundary may be neglected at high concentrations of electrolyte, but the boundary potential at the membrane side will change as a function of extracted anions X− in analogy to eq 5:
| (10) |
Note that the equations here treat as an approximation all ions in the membrane with the same diffusion coefficient, Dorg. After the transition time, it is assumed that the ion flux is maintained by protons from water autoprotolysis because of the very high proton selectivity of the membrane and the elevated concentration of background ions, which avoids concentration polarization at the membrane phase boundary. Consequently, pH changes at the membrane surface may be described as a flux of hydroxide ions from the membrane surface in direction of the sample bulk, which may be written in analogy to eq 8:
| (11) |
The concentration changes within the membrane phase remain to be modeled by eqs 5 and 10 if no interferences from other sample ions take place. It is expected that the produced hydroxide ions will start to deprotonate the weak acid at some distance away from the membrane surface, which is not modeled here. This process is expected to produce endpoints that are not ideally sharp since the dissociation of the acid away from the membrane surface and its association with OH− to form water may lead to a blurring of the depletion behavior at the membrane surface.
Results and Discussion
A cathodic current pulse applied across the hydrogen ion-selective membrane causes a flux of H+ from the sample side to the membrane (see pulse 1 in figure 1) while the potential is monitored simultaneously at the same membrane. The magnitude of ion flux is directly proportional to the amplitude of applied current and is therefore controlled instrumentally. A baseline potential is applied after each current pulse to expel the previously extracted ion and chemically renew the membrane (see pulse 2 in figure 1) before the next pulse. The potentials were sampled as the average values during the last 10% of each 1-s galvanostatic pulse (see figure 1D). This results in stable and reproducible potential responses that can be sampled at the end of each current pulse (see figure 1D, bottom) to describe the sensor responses.49
Fig. 1.
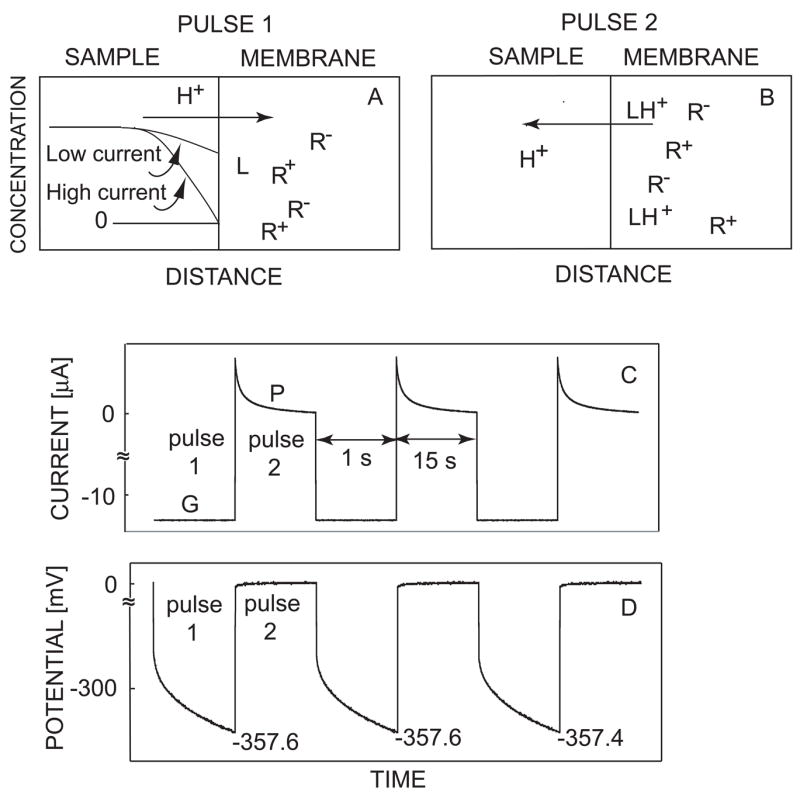
Schematic for the proposed direct total acidity sensor: (A) uptake under galvanostatic mode and (B) stripping under applied baseline potential; observed current-time (C) and potential-time (D) behavior of pulstrode during galvanostatic/potentiostatic switching experiment. Labels G and P show the time under which the galvanostatic and the potentiostatic pulses are applied, respectively.
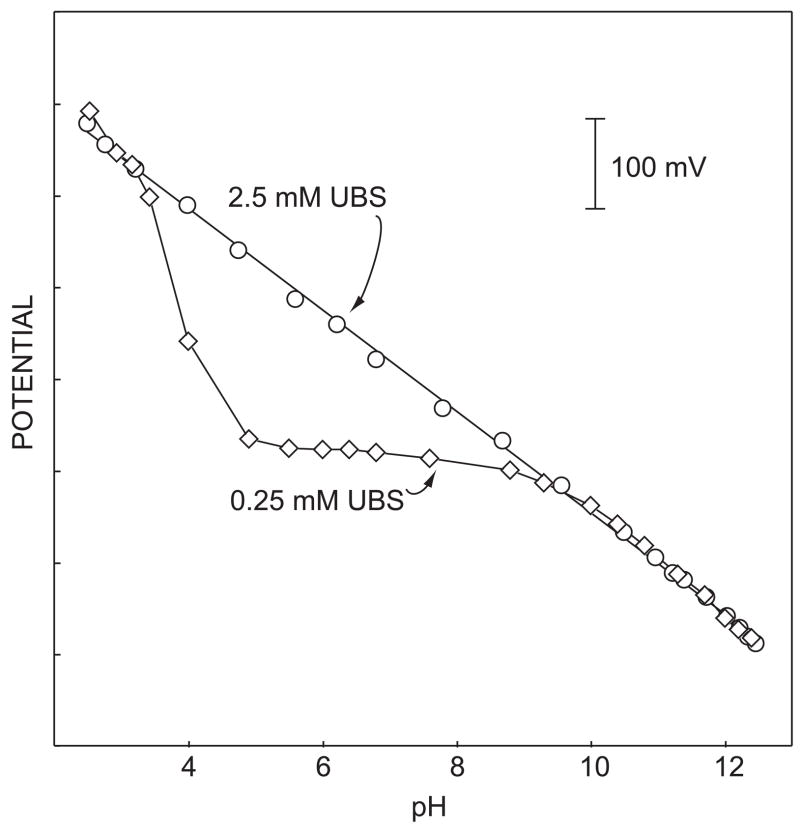
These sensors, in principle, yield response curves that are analogous to the calibration curves of classical potentiometric sensors since both share similar transduction principles. Figure 2 depicts the response of a highly selective pulsed chronopotentiometric hydrogen ion sensor containing a lipophilic hydrogen ion receptor, chromoionophore I (ETH 5294). This chromoionophore possesses an excellent selectivity for H+ and a wide practical pH measuring range. Indeed, a Nernstian pH response curve was observed in a wide pH range of 3 to 12 when measured in a 2.5 mM universal buffer solution, suggesting that these sensors may be utilized to measure pH in analogy to established pH electrodes, albeit likely with smaller levels of reproducibility because of the kinetic nature of the measurement. In solutions of lower buffer capacity (0.25 mM UBS), however, the sensor responses showed a large deviation from a Nernstian slope. Here, the electrochemically imposed ion flux appears to deplete the hydrogen ions at the sample side of membrane surface (see also figure 1). The observed membrane potential is a function of the localized sample pH, which may now be different from the sample bulk pH. Under conditions of lower buffer capacity, pulsed chronopotentiometric sensors may open interesting possibilities for ISEs since discrete local perturbations are now possible to be induced and detected at the same membrane.
Fig. 2.
Observed response curves of pulsed chronopotentiometric sensors in 2.5 and 0.25 mM Universal Buffer Solution. Solid line with a slope of −57.4 mV/pH.
Hydrogen ion transfer reactions are generally diffusion controlled, and an ion flux imposed by a cathodic current is carried by the diffusion and dissociation of weak acid at a negligiblly small concentration of free hydrogen ions. In this case, a drastic depletion of H+ in the aqueous diffusion layer of the membrane side results when the electrochemically imposed H+ flux can no longer be maintained by the diffusion of acid from the sample bulk to the membrane. When this happens, a drastic potential change is observed, akin to the endpoint in potentiometric titrations.
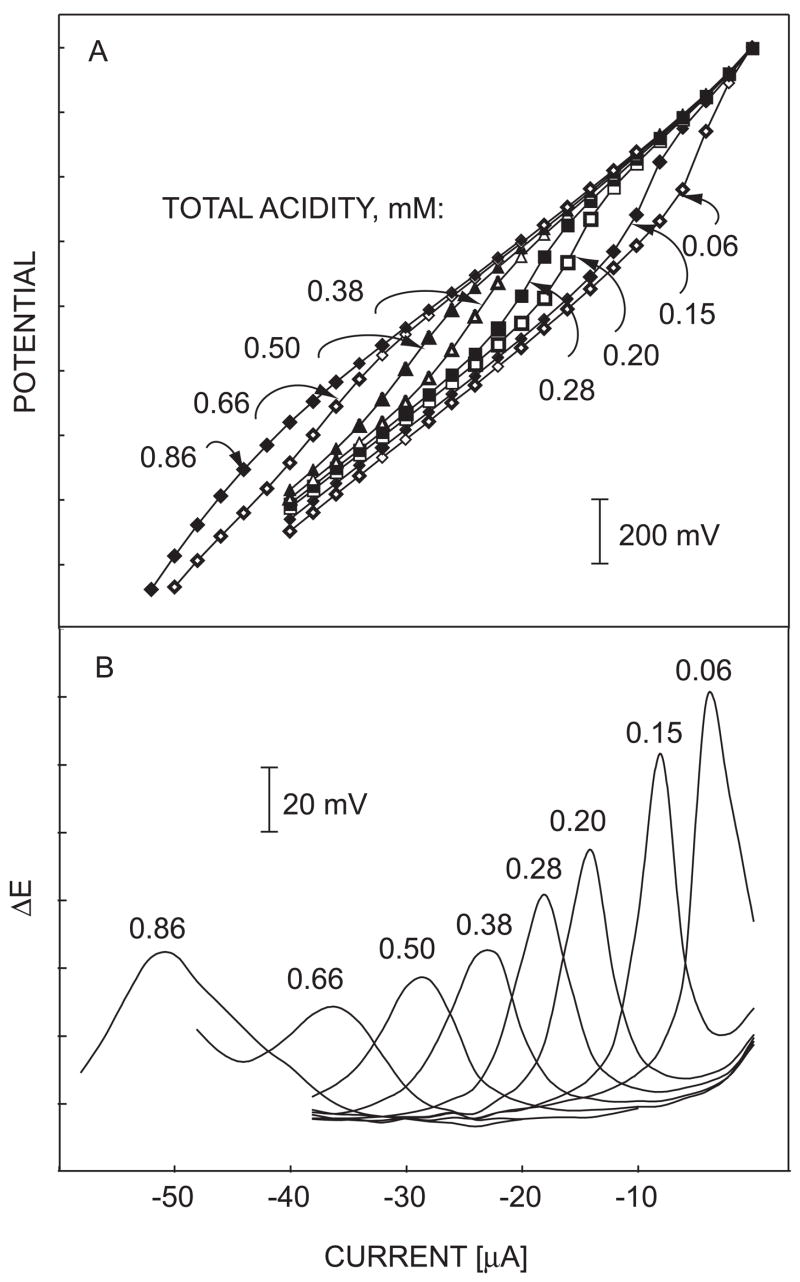
Figure 3A shows potential responses interrogated under successively increasing applied current pulses in varying concentrations of a 1:1 acetate buffer solution at pH 4.8 in a 0.01 M NaCl as a model electrolyte. The total acid concentration was varied by successive addition from a 1.0 M 1:1 acetate buffer stock solution. Each curve represents a response to a single sample composition as a function of current amplitude and is related to a localized acid-base titration curve, while each data point on the curve presents a single potential response under a discrete current pulse for the given total acidity. The observed inflection point may be understood as the end point in the localized acid-base titrations, where the electrochemical removal of hydrogen ions serves the function of the base titrant.
Fig. 3.
(A) Potential responses of the sensor under successively increasing current in varying concentrations of a 1:1 acetate buffer. The numbers on the curves denote total acidities in mM; (B) first derivatives of the chronopotentiometric responses in (A).
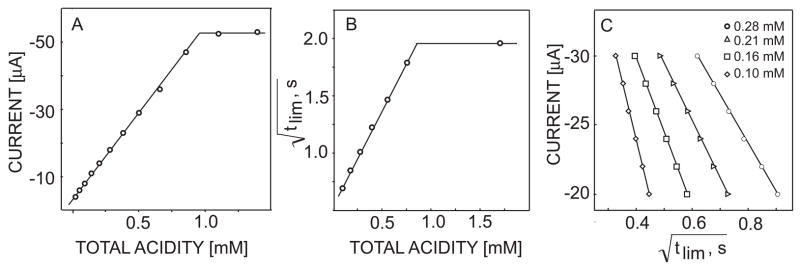
Figure 3B presents the first derivative of the pulstrode response curves shown in figure 3A. The end points for the different concentrations are clearly denoted as peaks that shift to higher current amplitude with higher acid concentration. At steady-state, the transition current amplitude is linearly related to the total acidity, cHA, if mass transport occurs predominantly by diffusion55–57 (see also equation 6). This is indeed experimentally observed in figure 4A for samples of varying total acidity up to about 1 mM.
Fig. 4.
Observed linear relationships (A) limiting (endpoint) current as a function of total acidity from the data in figure 3, (B) square root of titration endpoint as a function of total acidity from the data in figure 5 and (C) square root of endpoint time as a function of applied current for fixed total acidities. The total acid concentrations for the data in figure 5C are shown as inset.
At high total acidities the observed limiting currents at about −53 μA become independent of sample concentration and may be described by the diffusion limitation of the ionophore in the membrane phase (see eq 7). This limiting process can, in principle, be diminished by increasing the concentration of ionophore or adjusting the membrane composition to increase the diffusion coefficients in the organic phase. Indeed, membranes with a 2-fold increased ionophore concentration showed a shift of the associated peaks to higher currents while the peaks for the total acidity measurements remained essentially unchanged (see figure S1 in the supporting information).
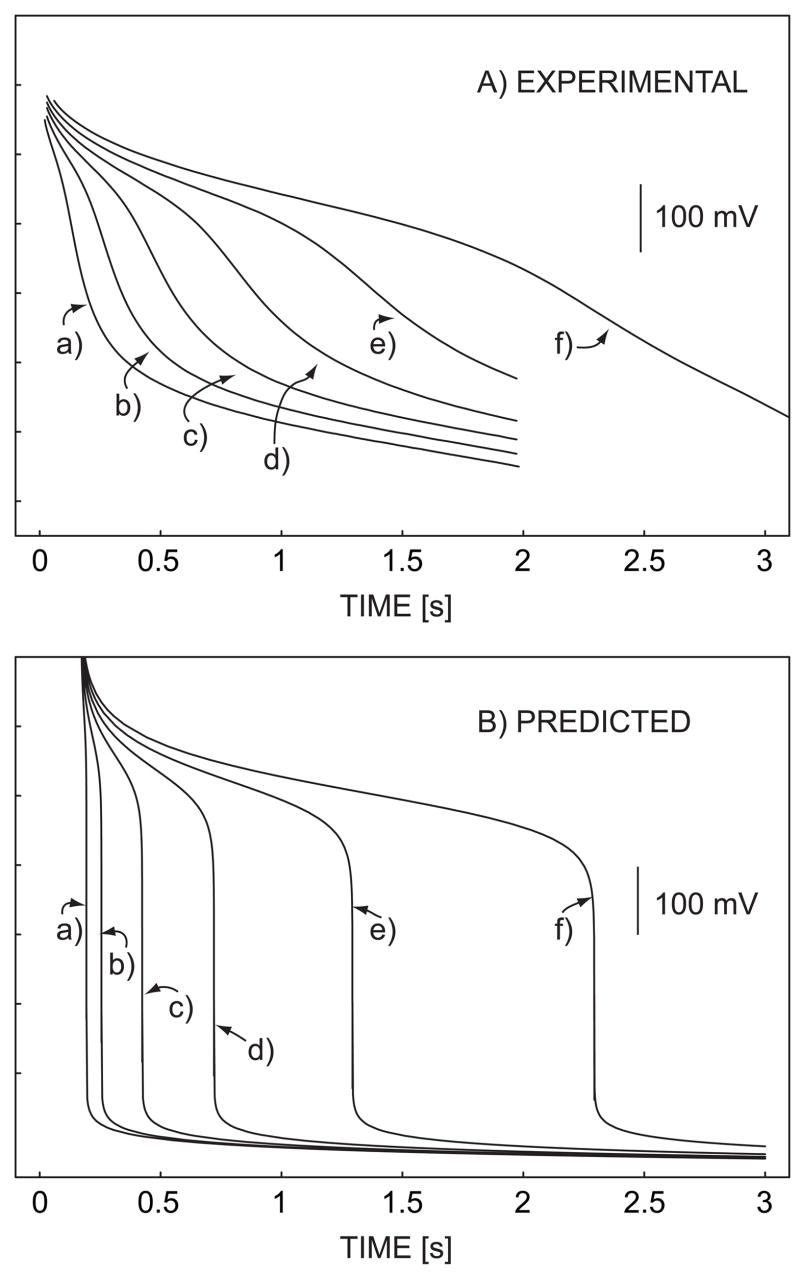
A robust and analytically more practical application of the sensor is performed by rapid flash titration. A constant current pulse applied across the hydrogen ion-selective membrane induces a defined flux of H+ from the sample side to the polymeric membrane. An increase in the diffusion layer thickness as a function of time in unstirred solution causes a concomitant increase in the acidity gradient to maintain the electrochemically imposed ion flux whereby the phase boundary concentration is now depleted at a critical time (see eq 6). Note that convective mass transport in the sample phase is here undesired since it will reduce the steady-state Nernst diffusion layer thickness at the membrane surface. This would limit the possibility to perform localized titration at long pulse times since the Nernst diffusion layer thickness is here not assumed to reach its steady state value. Figure 5 shows the experimental pulsed chronopotentiometric responses of the sensor (A) and the corresponding theoretical predictions with i = −25 μA, A = 20 mm2, tc = 0.17 s, Daq = 1.5 × 10⁻⁵ cm2 s−1, Dorg = 1.0 × 10⁻⁸ cm2 s−1, and Ka = 1.75 × 10⁻⁵ (B). If diffusion is the predominant mode of mass transport, the square root of the limiting time, tlim, approximates a linear function of the total acidity in the sample (see eq 6), which is confirmed experimentally in figure 4B. This is further confirmed by the observed linear relationship between the square root of endpoint time and the limiting current for titration of acid of a fixed concentration, see Fig. 4C. Note that the shape of the curves in Figure 5 is well predicted before the transition time, but a reduced sharpness of the experimental inflection points is observed in Figure 5B. Theory predicts a moderately basic pH around 10 after the inflexion point, at which point sodium ions are not expected to interfere based on the high ion selectivity of the membrane (log KH,Napot of ca. -13). 48
Fig. 5.
(A) experimental and (B) predicted pulsed chronopotentiometric responses of the sensor in varying concentration of acetic acid in 10 mM NaCl background. The total acid concentrations denoted are (a) 0.057, (b) 0.11, (c) 0.19, (d) 0.28, (e) 0.40 and (f) 0.55 mM.
The deviation between theory and experiment for after the transition time is somewhat puzzling, may perhaps be explained by the nature of the flash titration experiment. The hydroxide ions produced after the transition time will diffuse away from the surface where they are expected to react with undepleted weak acid, hence blurring the visible endpoint to some extent. There may be other reasons for the observed discrepancy, including the occurrence of non-uniform diffusion profiles (deviation from one dimensional diffusion behavior), but these were not yet investigated here.
The range of acid concentrations and pKa values assessable with this technique will be narrower compared to that of classical volumetric titrations. The concentration range measured in the acetic acid/acetate system investigated in this work is ca 0.01 mM to 1 mM. The faster diffusion of hydronium ions compared to weak acid species is expected to give deviations from ideal behavior at low pKa values and concentrations where dissociation of weak acid becomes relevant. Moreover, the upper pKa limit will be lower as well since titration endpoints are found to be shallower than ideally expected, see Figure 5. The reproducibility of the technique was examined at a 0.4 mM sample concentration of acetic acid in a multipulse sequence involving 3 consecutive current amplitudes (−20, −25 and −30 μA), and a relative standard deviation of 2.3% for the transition time was found (n=5). This translates into a relative concentration error of 1.2%, which is likely attractive for routine purposes.
Performing flash titration experiments at different current densities allows one to optimize analysis times and is of practical relevance, but may also be of diagnostic value. If electrical migration is significantly contributing to mass transport, the relationship shown in Fig. 4C will no longer hold. Repeated experiments at different current densities may therefore be correlated and used to evaluate whether the depletion process is predominantly diffusion controlled. Of course, if the diffusing acid species is electrically neutral, migration effects are not expected to be very significant.43 This was experimentally evaluated by varying the ionic strength of the measuring solution while keeping the pH constant (see Fig. S2 in the supporting information). The total acidity information from the chronopotentiometric sensor was found not to change between 0.5 and 150 mM NaCl background. The total change of the transition time in this entire range, 16 ms, translates into a concentration error of 5.1 μM, which may be acceptable for many analytical applications.
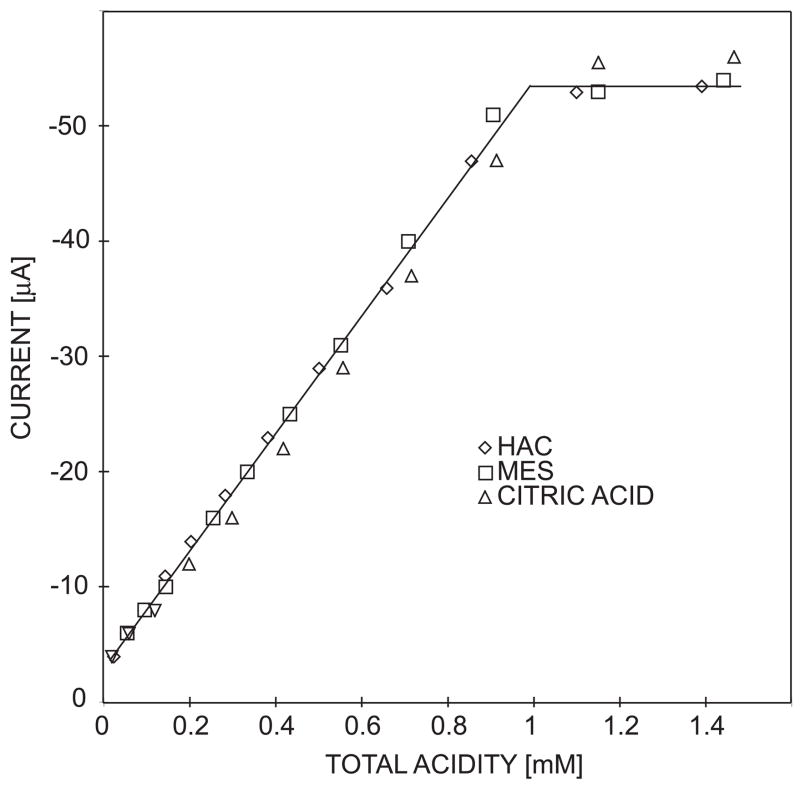
Variations in the acid diffusion coefficient are expected to influence the observed limiting current, which will also affect accuracy. Fort this purpose, the sensor response was evaluated for a number of monoprotic and polyprotic acids. Calibration curves were obtained for acetic acid (pKa = 4.76), 2-Morpholinoethanesulfonic acid, MES, (pKa = 6.15) and citric acid (pKa1 = 3.13, pKa2 = 4.76, pKa3 = 6.40) when measured in their respective 1:1 buffers (see figure 6). For citric acid the total acidity refers to the total titratable proton concentration. As can be seen from figure 6, the calibration curves obtained for the three weak acids have nearly the same slope, in spite of the slight differences in their diffusion coefficients: acetic acid, 9.7 × 10⁻⁶ cm2 s−1;43 MES, 7.4 × 10⁻⁶ cm2 s−1;58 citric acid, 6.6 × 10⁻⁶ cm2 s−1.59 The results are in agreement with earlier studies that for weak acids of pKa ≤ 6, acid dissociation is sufficiently rapid to support mass transport limited processes for voltammetric reduction of H+ at a Pt microelectrode.26, 42
Fig. 6.
Observed calibration curves for 1:1 buffers of acetic acid (HAC), 2-Morpholinoethanesulfonic acid (MES) and citric acid.
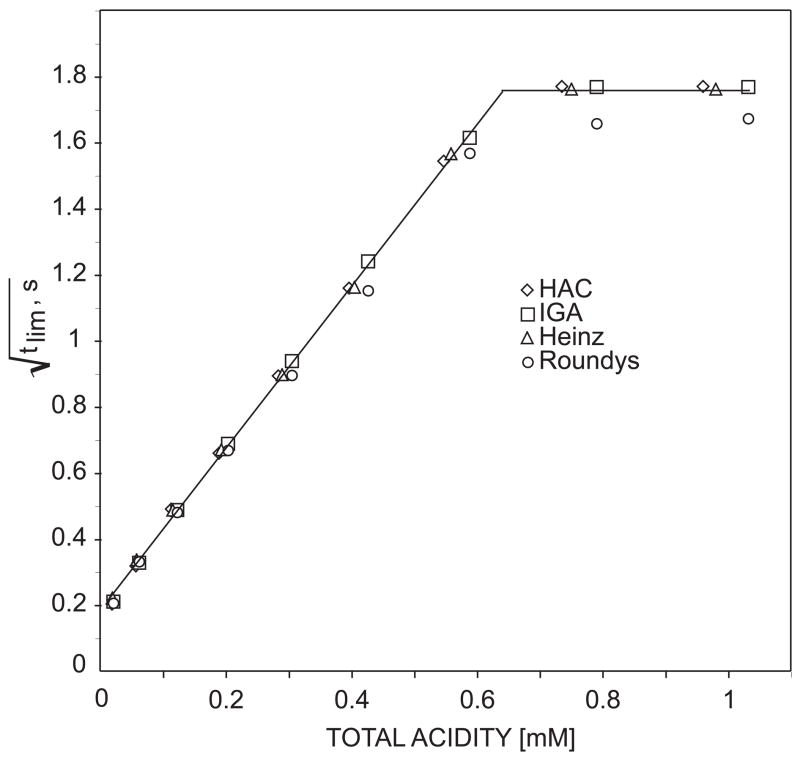
As an example of practical utility of the sensor, the total acidity in different vinegar samples was analyzed at different states of dilution in the same background electrolyte. Figure 7 presents the calibration curves of vinegar samples, IGA, Heinz and Roundy’s and standardized acetic acid. The results show the expected linear dependence of the square root of endpoint time on the total acid concentration of the samples (as determined by classical potentiometric titration using a pH glass electrode) over a wide concentration range of about 2 orders of magnitude.
Fig. 7.
Responses of the chronopotentiometric sensor to total acid concentrations in vinegar samples of different brands (IGA, Roundys, Heinz) and standard acetic acid. The acid concentrations in the samples were determined by potentiometric titration with pH glass electrode as a sensor.
Conclusions
Polymeric ion-selective membranes that essentially share the same composition as established ISEs, but are void of lipophilic ion-exchanger, can be electrochemically controlled to respond to the sample pH in analogy to ISEs. When in contact with sample solutions that have a moderate buffer capacity (weak acid concentrations of less than 1 mM), a characteristic transition time or current can be obtained chronopotentiometrically that gives information about the acid concentration in the sample. This makes it, in principle, possible to perform near-perturbation free localized flash titrations at the surface of such electrode membranes to gain information on the total acidity of the sample in a direct sensor-like fashion, with selectivities that are comparable to those of established ion-selective electrodes. Measurement errors may arise from migration effects, which can be experimentally evaluated by performing flash titrations at different current densities. Convective mass transport in the sample will place a limit on the analytically useful pulse time and the detectable concentration, and was here avoided. Acids with different diffusion coefficients are expected to show variations in the observed apparent endpoint, but these are expected to be small because they depend on the square root of the diffusion coefficient. The results presented here suggest that time resolved pulsed chronopotentiometry on ion-selective membrane may be an attractive new approach for the direct determination of total acidity. Nonetheless, the technique trades accuracy for convenience and speed, and requires calibration and careful assessment before implementation in real world applications.
Supplementary Material
Supporting Information
Additional data (transition currents for different membrane compositions, variation of background electrolyte concentration), available free of charge at http://pubs.acs.org.
Acknowledgments
The authors are grateful to the National Institutes of Health through grant R01 GM59716 for supporting this research.
Literature Cited
- 1.Buehlmann P, Pretsch E, Bakker E. Chem Rev. 1998;98:1593–1687. doi: 10.1021/cr970113+. [DOI] [PubMed] [Google Scholar]
- 2.Ammann D, Lanter F, Steiner RA, Schulthess P, Shijo Y, Simon W. Anal Chem. 1981;53:2267–2269. doi: 10.1021/ac00237a031. [DOI] [PubMed] [Google Scholar]
- 3.Mihell JA, Atkinson JK. Sens Actuators, B. 1998;B48:505–511. [Google Scholar]
- 4.Fog A, Buck RP. Sens Actuators. 1984;5:137–146. [Google Scholar]
- 5.Kreider KG, Tarlov MJ, Cline JP. Sens Actuators, B. 1995;B28:167–172. [Google Scholar]
- 6.Bergveld P. Sens Actuators, B. 2003;B88:1–20. [Google Scholar]
- 7.Woias P, Meixner L, Amandi D, Schoenberger M. Sens Actuators, B. 1995;B24:211–217. [Google Scholar]
- 8.Purushothaman S, Toumazou C, Ou C-P. Sens Actuators, B. 2006;B114:964–968. [Google Scholar]
- 9.Oesch U, Brzozka Z, Xu A, Rusterholz B, Suter G, Pham Hung V, Welti D, Ammann D, Pretsch E, Simon W. Anal Chem. 1986;58:2285–2289. [Google Scholar]
- 10.Schulthess P, Shijo Y, Pham HV, Pretsch E, Ammann D, Simon W. Anal Chim Acta. 1981;131:111–116. [Google Scholar]
- 11.Trojanowicz M, Meyerhoff ME. Anal Chem. 1989;61:787–789. [Google Scholar]
- 12.Bakker E, Xu A, Pretsch E. Anal Chim Acta. 1994;295:253–262. [Google Scholar]
- 13.Mi Y, Green C, Bakker E. Anal Chem. 1998;70:5252–5258. [Google Scholar]
- 14.Mi Y, Bakker E. J Electrochem Soc. 1997;144:L27–L28. [Google Scholar]
- 15.Sotomayor PT, Raimundo IM, Zarbin AJG, Rohwedder JJR, Neto GO, Alves OL. Sens Actuators, B. 2001;B74:157–162. [Google Scholar]
- 16.Jin Z, Su Y, Duan Y. Sens Actuators, B. 2000;B71:118–122. [Google Scholar]
- 17.Lin J, Liu D. Anal Chim Acta. 2000;408:49–55. [Google Scholar]
- 18.Paterson JR, Srivastava R, Baxter GJ, Graham AB, Lawrence JR. J Agr Food Chem. 2006;54:2891–2896. doi: 10.1021/jf058158w. [DOI] [PubMed] [Google Scholar]
- 19.Frank J, Kamal-Eldin A, Razdan A, Lundh T, Vessby B. J Agr Food Chem. 2003;51:2526–2531. doi: 10.1021/jf026127k. [DOI] [PubMed] [Google Scholar]
- 20.Palaniswamy UR, McAvoy RJ, Bible BB. J Agr Food Chem. 2001;49:3490–3493. doi: 10.1021/jf0102113. [DOI] [PubMed] [Google Scholar]
- 21.Chellam S. Environ Sci Technol. 2000;34:1813–1820. [Google Scholar]
- 22.Heal MR, Reeves NM, Cape JN. Environ Sci Technol. 2003;37:2627–2633. doi: 10.1021/es026411s. [DOI] [PubMed] [Google Scholar]
- 23.Sabine CL, Feely RA, Gruber N, Key RM, Lee K, Bullister JL, Wanninkhof R, Wong CS, Wallace DWR, Tilbrook B, Millero FJ, Peng T-H, Kozyr A, Ono T, Rios AF. Science. 2004;305:367–371. doi: 10.1126/science.1097403. [DOI] [PubMed] [Google Scholar]
- 24.Martz TR, Dickson AG, DeGrandpre MD. Anal Chem. 2006;78:1817–1826. doi: 10.1021/ac0516133. [DOI] [PubMed] [Google Scholar]
- 25.Gratzl M. Anal Chem. 1988;60:484–488. [Google Scholar]
- 26.Daniele S, Bragato C, Baldo MA, Mori G, Giannetto M. Anal Chim Acta. 2001;432:27–37. [Google Scholar]
- 27.Walsby JR. Anal Chem. 1973;45:2445–2446. [Google Scholar]
- 28.Spokane RB, Brill RV, Gill SJ. Anal Biochem. 1980;109:449–453. doi: 10.1016/0003-2697(80)90676-4. [DOI] [PubMed] [Google Scholar]
- 29.Gratzl M, Yi C. Anal Chem. 1993;65:2085–2088. [Google Scholar]
- 30.Gratzl M. Anal Chem. 1988;60:2147–2152. [Google Scholar]
- 31.Yi C, Gratzl M. Anal Chem. 1994;66:1976–1982. [Google Scholar]
- 32.Yi C, Huang D, Gratzl M. Anal Chem. 1996;68:1580–1584. doi: 10.1021/ac950636m. [DOI] [PubMed] [Google Scholar]
- 33.Van der Schoot B, Bergveld P. Sens Actuators. 1985;8:11–22. [Google Scholar]
- 34.Guenat OT, Morf WE, van der Schoot BH, de Rooij NF. Anal Chim Acta. 1998;361:261–272. [Google Scholar]
- 35.Guenat OT, Van der Schoot BH, Morf WE, De Rooij NF. Anal Chem. 2000;72:1585–1590. doi: 10.1021/ac990488q. [DOI] [PubMed] [Google Scholar]
- 36.Bhakthavatsalam V, Shvarev A, Bakker E. Analyst. 2006;131:895–900. doi: 10.1039/b602906j. [DOI] [PubMed] [Google Scholar]
- 37.van der Schoot B, van der Wal P, de Rooij N, West S. Sens Actuators, B. 2005;B105:88–95. [Google Scholar]
- 38.Jaworski A, Donten M, Stojek Z, Osteryoung JG. Anal Chem. 1999;71:167–173. doi: 10.1021/ac980425s. [DOI] [PubMed] [Google Scholar]
- 39.Roberts JM, Linse P, Osteryoung JG. Langmuir. 1998;14:204–213. [Google Scholar]
- 40.Stojek Z, Ciszkowska M, Osteryoung JG. Anal Chem. 1994;66:1507–1512. [Google Scholar]
- 41.Daniele S, Bragato C, Baldo MA. Electrochim Acta. 2006;52:54–61. [Google Scholar]
- 42.Daniele S, Lavagnini I, Baldo MA, Magno F. Anal Chem. 1998;70:285–294. [Google Scholar]
- 43.Ciszkowska M, Stojek Z, Morris SE, Osteryoung JG. Anal Chem. 1992;64:2372–2377. [Google Scholar]
- 44.Morf WE, Seiler K, Rusterholz B, Simon W. Anal Chem. 1990;62:738–742. [Google Scholar]
- 45.Cosofret VV, Nahir TM, Lindner E, Buck RP. J Electroanal Chem. 1992;327:137–146. [Google Scholar]
- 46.Bakker E, Lerchi M, Rosatzin T, Rusterholz B, Simon W. Anal Chim Acta. 1993;278:211–225. [Google Scholar]
- 47.Bakker E, Pretsch E. Anal Chem. 1998;70:295–302. doi: 10.1021/ac970903j. [DOI] [PubMed] [Google Scholar]
- 48.Long R, Bakker E. Electroanalysis. 2003;15:1261–1269. [Google Scholar]
- 49.Shvarev A, Bakker E. Anal Chem. 2003;75:4541–4550. doi: 10.1021/ac034409t. [DOI] [PubMed] [Google Scholar]
- 50.Makarychev-Mikhailov S, Shvarev A, Bakker E. Anal Chem. 2006;78:2744–2751. doi: 10.1021/ac052211y. [DOI] [PubMed] [Google Scholar]
- 51.Makarychev-Mikhailov S, Shvarev A, Bakker E. J Amer Chem Soc. 2004;126:10548–10549. doi: 10.1021/ja047728q. [DOI] [PubMed] [Google Scholar]
- 52.Gemene KL, Shvarev A, Bakker E. Anal Chim Acta. 2007;583:190–196. doi: 10.1016/j.aca.2006.09.042. [DOI] [PMC free article] [PubMed] [Google Scholar]
- 53.Shvarev A, Bakker E. Anal Chem. 2005;77:5221–5228. doi: 10.1021/ac050101l. [DOI] [PubMed] [Google Scholar]
- 54.Bard AJ, Faulkner LR. Electrochemical Methods: Fundamentals and Applications. Vol. 7. Wiley; 2001. p. 255. [Google Scholar]
- 55.Shvarev A, Bakker E. Anal Chem. 2003;75:4541–4550. doi: 10.1021/ac034409t. [DOI] [PubMed] [Google Scholar]
- 56.Qian Q, Wilson GS, Bowman-James K, Girault HH. Anal Chem. 2001;73:497–503. doi: 10.1021/ac000806h. [DOI] [PubMed] [Google Scholar]
- 57.Xie Y, Liu TZ, Osteryoung JG. Anal Chem. 1996;68:4124–4129. doi: 10.1021/ac960410z. [DOI] [PubMed] [Google Scholar]
- 58.Deschamps JR, Flippen-Anderson JL, George C. Acta Cryst. 2002;E58:m167–m168. [Google Scholar]
- 59.Muller GTA, Stokes RH. Trans Faraday Soc. 1957;53:642–645. [Google Scholar]
Associated Data
This section collects any data citations, data availability statements, or supplementary materials included in this article.
Supplementary Materials
Supporting Information
Additional data (transition currents for different membrane compositions, variation of background electrolyte concentration), available free of charge at http://pubs.acs.org.


