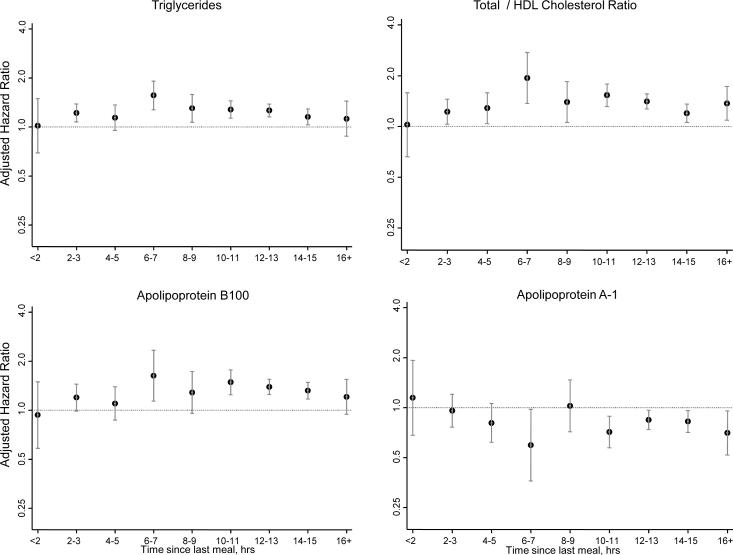
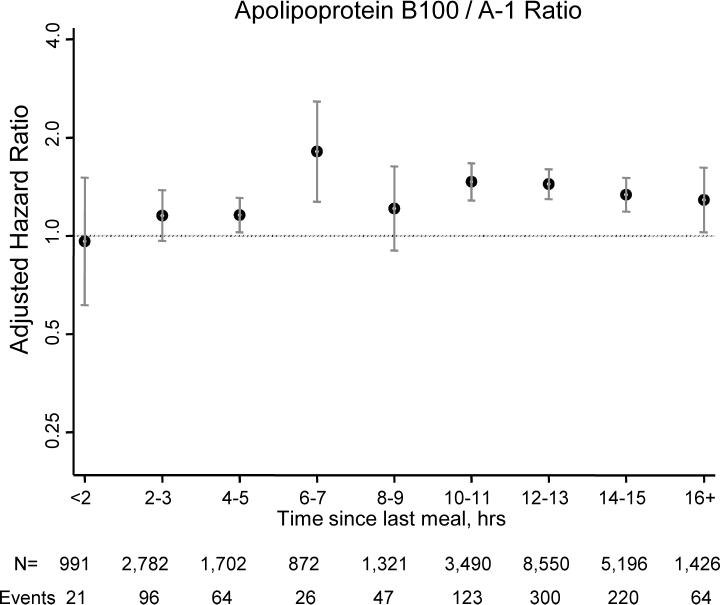
Figure 2.
Hazard ratios and 95% confidence intervals (shown on a log-scale) for 1-standard deviation increment of lipids and apolipoproteins, adjusted for age, randomized treatment assignment, smoking status, menopausal status, postmenopausal hormone use, blood pressure, diabetes, and body mass index.


