

Abstract
Molecular imaging is a powerful tool for investigating disease processes and potential therapies in both in vivo and in vitro systems. However, high resolution molecular imaging has been limited to relatively shallow penetration depths that can be accessed with microscopy. Optical coherence tomography (OCT) is an optical analogue to ultrasound with relatively good penetration depth (1-2 mm) and resolution (∼1-10 μm). We have developed and characterized photothermal OCT as a molecular contrast mechanism that allows for high resolution molecular imaging at deeper penetration depths than microscopy. Our photothermal system consists of an amplitude-modulated heating beam that spatially overlaps with the focused spot of the sample arm of a spectral-domain OCT microscope. Validation experiments in tissuelike phantoms containing gold nanospheres that absorb at 532 nm revealed a sensitivity of 14 ppm nanospheres (weight/weight) in a tissuelike environment. The nanospheres were then conjugated to anti-EGFR, and molecular targeting was confirmed in cells that overexpress EGFR (MDA-MB-468) and cells that express low levels of EGFR (MDA-MB-435). Molecular imaging in three-dimensional tissue constructs was confirmed with a significantly lower photothermal signal (p < 0.0001) from the constructs composed of cells that express low levels of EGFR compared to the overexpressing cell constructs (300% signal increase). This technique could potentially augment confocal and multiphoton microscopy as a method for deep-tissue, depth-resolved molecular imaging with relatively high resolution and target sensitivity, without photobleaching or cytotoxicity.
Molecular imaging is a powerful tool for investigating biological signaling, disease processes, and potential therapies in both in vivo and in vitro systems. Microscopy, including confocal and multiphoton microscopy, has been the standard for high resolution molecular imaging in live cells and tissues. However, these microscopy techniques suffer from relatively shallow imaging depths. Magnetic resonance imaging (MRI) and positron emission tomography (PET) have been the standard for functional imaging deep within the body with the caveat of relatively poor resolution. Optical coherence tomography (OCT) fills a niche between high resolution microscopy techniques and whole body imaging techniques with relatively good resolution (∼1-10 μm) and penetration depths (∼1-2 mm) in tissue. Molecular imaging in this regime would be a powerful tool for scientists and clinicians. Two examples with potentially high impact are imaging the effects of antiangiogenic treatment in age-related macular degeneration, and whole-tumor imaging of molecular microenvironments.
OCT is intrinsically insensitive to incoherent scattering processes such as fluorescence and spontaneous Raman scattering, which are central to optical molecular imaging, because OCT depends on coherent detection of scattered light. Molecular contrast OCT has been achieved using dyes,1-3 proteins,4 iron oxide particles,5 and intrinsic tissue molecules1,6 as contrast agents. Gold nanoparticles are also attractive contrast agents because they are biocompatible, do not exhibit photobleaching or cytotoxicity, and are tunable through a broad range of wavelengths including the visible and near-infrared regions. Gold nanoparticles currently under development for molecular contrast OCT include highly scattering gold nanoshells,7,8 gold nanocages,9 and gold nanorods.10 Most of these nanoparticle-based molecular OCT techniques rely on increased scattering from the nanoparticle as the source of contrast and thus suffer from limited contrast over a highly scattering tissue background. To our knowledge, imaging of a molecular target with the combined high resolution and deep imaging depth of OCT has yet to be demonstrated.
Photothermal imaging provides one potential method for increasing the molecular contrast of OCT over a highly scattering background and is the focus of this work. In photothermal imaging, strong optical absorption of a small metal particle at its plasmon resonance results in a change in temperature around the particle (photothermal effect). This temperature change leads to a variation in the local index of refraction that can be optically detected with an amplitude-modulated heating beam that spatially overlaps with the focus position of the sample arm of an interferometer. Previous work has shown that photothermal interference contrast images of gold nanoparticles from a modified DIC microscope are insensitive to a highly scattering background.11 We have applied this concept to OCT with the added benefits of depth-resolution and increased imaging depth. Our photothermal OCT system has a measured sensitivity of 14 ppm (weight/weight), and we have used this system to measure epidermal growth factor receptor (EGFR) expression from live monolayers of cells and in three-dimensional tissue constructs.
The photothermal OCT system shown in Figure 1 consists of a diode pumped solid-state frequency doubled Nd:YAG as the heating source (Coherent, Verdi) and a common-path spectral domain (SDOCT) system. The SDOCT system operates at a 20 kHz A-scan rate with a super luminescent diode light source (Superlum) centered at 840 nm with full width at half-maximum bandwidth of 52 nm (6 μm axial resolution). Sample arm light is coupled into a 30 mm focal length lens and laterally scanned across the sample (20 μm imaging spot size on the sample). The interferogram is detected using a custom-made spectrometer with a 1024 pixel line-scan CCD camera (Atmel, Aviiva). The system is driven by high-performance software that controls the lateral scanner and performs data acquisition, rescaling from wavelength to wavenumber, Fourier Transform, two-dimensional B-scan display and data archiving in real time (Bioptigen, Inc.). The signal to noise ratio (SNR) measured at 200 μm from the zero-path length difference location is 93 dB for a 50 μs integration time and 200 μW incident on the sample. The focused spot of the pump beam overlaps with the focused spot of the imaging beam (20 μm pump beam spot size on the sample) and is amplitude-modulated with a chopper (Thorlabs).
Figure 1.
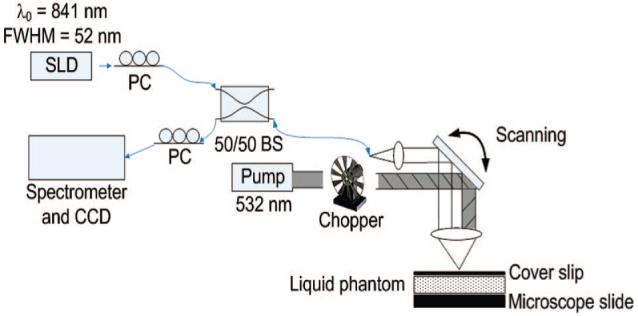
Schematic of the photothermal OCT setup. PC, polarization controller; SLD, super luminescent diode; BS, beam splitter.
Analytical expressions (derived from the equation of heat conduction) for the photothermal signal from gold nanoparticles detected interferometrically in a modified DIC microscope have previously been published.11 The peak-to-peak phase shift near the heated gold nanoparticle is given by
| (1) |
Where ∂n/∂T is the variation of the refractive index per unit of temperature for the medium (∼10-4 K-1 for water at room temperature),12 κ is the thermal conductivity of the medium (0.19 W K-1 m-1 for water), is the intensity of the heating beam at the nanoparticle position, λ is the imaging wavelength, N is the number of nanoparticles in the focal spot, and σ is the absorption cross section of the nanoparticle at the heating wavelength (1.1 × 10⁻¹⁴ m2 for 60 nm diameter gold nanospheres in water). All calculations and experiments are at I = 8 kW/cm2 and ω = 25 Hz unless otherwise stated, and at these settings, ΔϕPP ∼4 × 10⁻⁴ radian for one nanosphere. Analytical expressions for temperature variations due to photothermal imaging were also derived by Cognet et al.13 For our system, the theoretical maximum instantaneous temperature change on the nanosphere surface is 24 K (12 K average temperature change), and this temperature change falls off exponentially with distance from the heat source (5 K 100 nm from the sphere surface).
Photothermal signals are measured as oscillations in the phase of the OCT interferogram, occurring at the same frequency as the pump beam amplitude modulation. Thus, the sensitivity of the measurement is defined by the phase sensitivity of the OCT system. To improve phase sensitivity, all data was collected in a common path geometry14 with the top surface of a coverslip (placed directly on the sample) serving as the reference reflection (Figure 1). In this configuration, the phase sensitivity (defined as the standard deviation of the phase difference between the top and bottom of a coverslip) over 1000 points with 1 ms integration time for each point was 1 mrad, which corresponds to a displacement sensitivity of 45 picometers.14 Given the expected phase oscillations for one nanosphere (∼4 × 10⁻⁴ radian) and our phase sensitivity (1 mrad), we would expect to be sensitive to ∼3 nanospheres in the focal volume (∼4 ppm nanospheres in water, weight/weight).
The sensitivity of the photothermal OCT system was tested with liquid phantoms consisting of polystyrene spheres (Polysciences, Inc.), water, and 60 nm diameter gold nanospheres (532 nm absorption peak, Ted Pella Inc.). The 1.55 μm diameter polystyrene spheres were added at a concentration yielding μs = 100 cm-1 (g = 0.92), representative of tissue scattering properties.15 The liquid phantom was sandwiched between a coverslip and microscope slide (∼ 120 μm liquid depth). The pump beam was amplitude modulated at 25 Hz and M-mode (no scanning) data was collected over 1000 lines with a 1 ms integration time for each line. The characteristic phase oscillations can be seen in a phantom with 84 ppm nanospheres (Figure 2a). The phase as a function of time was fit to a 5th order polynomial, and this polynomial was subtracted from the phase vs time data to remove low frequency noise before Fourier-transforming the data (Figure 2b). The photothermal signal (Figure 2b) was defined as the height of the 25 Hz peak in the Fourier transformed phase at the microscope slide surface, minus the background (mean of the Fourier transformed phase from 27-50 Hz). A total of 10 measurements were collected at each nanoparticle concentration ranging from 0 to 84 ppm with the pump beam intensity fixed. A linear relationship was found between the photothermal signal and the nanoparticle concentration, as expected (Figure 2c, eq 1). The sensitivity of our photothermal system at 8 kW/cm2 pump power was 14 ppm (0 versus 14 ppm, p = 0.006), which is in qualitative agreement with the theoretical calculations. The photothermal signal increased linearly with increasing pump power, as expected (Figure 1d, eq 1). Pump beam intensities did not exceed the maximum permissible exposure levels in skin specified in the ANSI Z136.1-2007 Standard for the Safety Use of Lasers.16 These phantom studies indicate that the photothermal technique can successfully discriminate an absorbing target (gold nanospheres) over a tissuelike scattering background.
Figure 2.

Phase of the tissuelike phantom (polystyrene spheres with μs = 100 cm-1) with 84 ppm nanospheres and 25 Hz pump frequency (a). The definition of the photothermal signal (b) in the Fourier transformed phase is the peak at 25 Hz minus the background (27-50 Hz). The photothermal signal is linearly dependent on the nanoparticle concentration (c) in the scattering phantom with a pump beam intensity of 8 kW/cm2, and the sensitivity of the system is 14 ppm (0 versus 14 ppm, p = 0.006). The photothermal signal is linearly dependent on the pump laser intensity (d) in the tissuelike phantom with 70 ppm nanospheres. All error bars are standard error of N = 10 measurements.
The gold nanospheres were then conjugated to anti-EGFR mAb using established protocols.17 Briefly, 0.5 mL of 60 nm diameter Au colloid was diluted with 62.5 μL 20 mM HEPES buffer and 15 μL anti-EGFR mAb (E2156, Sigma) was diluted in 20 mM HEPES buffer. Using 100 nM K2CO3, the pH values of the colloid and antibody solutions were then adjusted to 7.0 ± 0.2. The colloid and antibody solutions were then mixed at room temperature for 20 min using an oscillator (190 cycles/min), allowing conjugation. Antibody-NP conjugation was verified by removing 100 μL of the resulting solution and mixing it with 5 μL of 10% NaCl. A consequential color change indicates incomplete antibody coverage of the NPs which has led to NP aggregation.18 Next, 100 μL of 1% polyethylene glycol (PEG) compound (Sigma P2263) was added to the remainder of the conjugated NP suspension. After 10 min of interaction, the solution was centrifuged (6000 RPM for 15 min) and resuspended in 0.5 mL of phosphate buffered saline twice to ensure complete removal of the excess PEG.
Molecular targeting of the antibody-conjugated nanospheres was confirmed in cells that overexpress EGFR (MDA-MB-468)19 and cells that express low levels of EGFR (MDA-MB-435).20 Cells (Duke Cell Culture Facility) were maintained at 37 °C, in a 5% CO2 atmosphere and grown in supplemented alpha modified Eagle’s medium21 with 1% penicillin streptomycin. For cell monolayer experiments, 80 000 cells were suspended in 1 mL of media, plated to 2.0 mL chambered coverglasses (Laboratory-Tek), and incubated for 12-16 h. The media was then exchanged with a mixture of 0.5 mL antibody-conjugated nanosphere suspension (2.35 × 10¹⁰ nanospheres/mL) and 0.5 mL fresh media. After 20 min of incubation, the media was removed and fresh media was used to rinse the cells twice. Fresh media was added once more and imaging was conducted immediately afterward. Molecular imaging with this protocol has previously been verified.17
Dark field microspectroscopy was used as an independent verification of molecular targeting.17 The dark field epiillumination microscope was comprised of an inverted microscope (Axiovert 200, Carl Zeiss, Inc.), color camera (CoolSnap cf, Photometrics), and a line-imaging spectrometer (SpectraPro 2150i, Acton Research).
Dark field images, scattering spectra, and photothermal signals were collected from EGFR overexpressing cells (MDA-MB-468) labeled with antibody-conjugated nanospheres (Figure 3a-d), cells that express low levels of EGFR (MDA-MB-435) labeled with antibody-conjugated nanospheres (Figure 3e-h), and EGFR overexpressing cells that were not labeled (Figure 3i-l). The dark field images confirm the presence of nanospheres on the membrane surface of the EGFR+/nanosphere+ group that are not present in the two controls (EGFR-/nanosphere+ and EGFR+/nanosphere-). Microspectroscopy confirms a 566.2 ± 3.5 nm scattering peak (calculated from a Gaussian fit to the measured spectra) in the EGFR+/nanosphere+ group (N = 7 cells), that is not present in the two controls (N = 6 cells for EGFR-/Nanosphere+, N = 7 cells for EGFR+/Nanosphere-), further confirming molecular specificity. This scattering peak agrees with previous studies of A431 cells labeled with identical anti-EGFR conjugated nanospheres (564.8 ± 5 nm).17
Figure 3.

EGFR expression and nanoparticle labeling was confirmed in EGFR+/nanosphere+ cells (a-d), with controls EGFR-/nanosphere+ (e-h) and EGFR+/nanosphere-(i-l) with dark field microscopy (panels a, e, i) and microspectroscopy (panels b, f, j).17 The phase as a function of time in the photothermal system is plotted for the experimental (panel c) and control groups (panels g, k) and the Fourier Transform of the phase confirms oscillations at 25 Hz (the pump laser modulation frequency) (panels d, h, l). In three repeated experiments, the photothermal signal from overexpressing cell monolayers was at least 9 dB higher than the highest signal from the cells that express low levels of EGFR. The repeated experiments were performed at pump powers of 7.5-8.5 kW/cm2. Scale bar is 10 μm.
The cells were then transported to the photothermal OCT system, and the media was replaced with saline (due to the phenol red in the media, which could interfere with the photothermal experiments) and a coverslip was placed on top of the cells (for a reference reflection). Representative photothermal signals measured through the cell monolayer (on the coverslip surface to which the cells adhere) are shown in Figure 3 (c, g, k). The photothermal signal from the EGFR+/nanosphere+ cell shows oscillations of ∼40 mrad at the same frequency (25 Hz) as the pump beam amplitude modulation, and the two controls show smaller oscillations at the same frequency (Figure 3 d, h, l). In three repeated experiments (with pump powers ranging from 7.5-8.5 kW/cm2), the photothermal signal from EGFR overexpressing cell monolayers was at least 9 dB higher than the highest signal from the cells that express low levels of EGFR. Trypan blue exclusion confirmed the viability of the cells after each experiment. Note that the background signals obtained from the control groups were not present unless the pump and imaging beams were incident on a cell (i.e., the background signal is due to photothermal effects of the cell and not the coverslips or saline). Previous papers have shown photothermal signals from unlabeled cells.22
Three-dimensional cell constructs containing MDA-MB-468 cells or MDA-MB-435 cells were grown to demonstrate photothermal imaging in thick samples. The three-dimensional cell constructs were created by mixing 3% low-gelling point agrose (Sigma-Aldrich Co.) with a cell suspension in media (100 × 106 cells/mL) to obtain a homogeneous cell distribution, and then the mixture was poured into 24-well inserts (6.5 mm diameter, Transwell, Fisher Scientific) at 2-3 mm thickness for gelation at room temperature. After gelation, the cell constructs were topically labeled with antibody-conjugated nanospheres in the same manner as the monolayer experiment, except 10% DMSO was added to the antibody-conjugated nanosphere suspension to allow the solution to penetrate the three-dimensional construct, and incubated for 30 min.20 After two washes with saline, a coverslip was placed on the construct for photothermal OCT imaging. Images were acquired with 1000 sequential A-scans (1 ms integration time for each A-scan) at each of 110 lateral positions across the top of the construct. The scan length in the lateral dimension was 1 mm.
Confocal images of a three-dimensional construct in the en face orientation (images of the x-y plane) were acquired after applying a live-dead fluorescence stain (Invitrogen) without nanosphere labeling. Live cells in green and dead cells in red show a fairly homogeneous distribution of cells in the x-y plane, with good cell viability (Figure 4a). The phase as a function of time due to the photothermal effect in a representative pixel of an MDA-MB-468 cell construct labeled with anti-EGFR nanospheres (Figure 4b) shows the characteristic 25 Hz frequency component (Figure 4c). The OCT magnitude image (taken in the transverse, or x-z plane) shows a map of the scatterers in the construct, the photothermal image shows the location and concentration of the nanospheres in the construct, and the overlay shows the combination of scatterers and nanospheres (Figure 4d). Note that the photothermal signal from the constructs is greater than the cell monolayer. This is likely due to increased water content and cells in the focal volume for the three-dimensional construct compared to the monolayer.
Figure 4.

A confocal image of a three-dimensional construct in the en face orientation (images of the x-y plane) acquired after applying a live (green) dead (red) fluorescence stain (a) indicates good cell viability and relatively homogeneous cell distribution. Representative photothermal OCT data from a three-dimensional cell construct containing MDA-MB-468 cells (EGFR+) labeled with antibody-conjugated nanospheres (nanosphere+). The phase as a function of time (b) from a representative pixel shows the characteristic 25 Hz frequency component (c). The OCT intensity image, photothermal image, and overlay of intensity/photothermal images of the three-dimensional construct are also shown (d) in the transverse (x-z) plane. Pump power 8.5 kW/cm2.
Representative images of the EGFR+/nanosphere+, EGFR-/nanosphere+ and EGFR+/nanosphere- constructs are shown in Figure 5a-c, respectively. In each of the experimental and two control groups, n = 17 images were collected from two constructs (for a total of 51 images from 6 constructs). Nonparametric Wilcoxon rank sum tests were performed to determine whether the photothermal signals of experimental (EGFR+/nanosphere+) and control (EGFR-/nanosphere+ and EGFR+/nanosphere-) samples were significantly different, with a Bonferroni correction for the n = 2 comparisons. Images of the EGFR+/nanosphere+ construct had significantly higher photothermal signals (p < 0.0001 for EGFR+/nanosphere+ versus EGFR-/nanosphere+ and EGFR+/nanosphere+ versus EGFR+/nanosphere-) than the two controls (Figure 5d). There was no significant difference between the two controls (p > 0.05). These results verify molecular imaging of a targeted molecule (EGFR) using photothermal OCT with a topically applied contrast agent (antibody-conjugated nanospheres).
Figure 5.

Images of EGFR expression in three-dimensional cell constructs containing EGFR+ cells (MDA-MB-468) with and without antibody-conjugated nanospheres (a and c, respectively) and EGFR-cells (MDA-MB-435) with antibody-conjugated nanospheres (b). There was a significant increase in the photothermal signal from EGFR overexpressing cell constructs labeled with antibody conjugated nanospheres (d) compared to the two controls (EGFR+/Nanosphere- and EGFR-/Nanosphere+). N = 17 images for each group, (*, p < 0.0001). Pump power 8.5 kW/cm2.
We have demonstrated a molecular OCT imaging technique based on phase-sensitive photothermal detection of an absorbing nanoparticle. Target sensitivity was empirically measured at 14 ppm (weight/weight) in tissuelike phantoms, verifying the ability of this technique to detect a photothermal target over a highly scattering background. Molecular targeting was confirmed in cell monolayer with dark field imaging, microspectroscopy, and photothermal signals. Molecular imaging was confirmed with a 300% increase in the photothermal signal of EGFR overexpressing cell constructs compared to constructs composed of cells that express low levels of EGFR and nonlabeled controls (p < 0.0001). The use of nanoparticles as contrast agents for molecularly targeted photothermal OCT is attractive for several reasons. Unlike organic fluorophores, metal particles are not subject to photobleaching or cytotoxicity. The wide range of shapes (such as nanorods, nanocubes, nanoshells, etc.) and sizes of nanoparticles allows for the plasmon resonance of these particles to be tuned throughout the visible and near-infrared wavelength regions. This tunability allows the user to select the optimal photothermal pump wavelength for their particular application and also allows for multiple molecules to be differentiated based on multiple target absorption peaks. The added benefits of coherent detection allows for high resolution molecular images to be collected at deeper depths than traditional microscopy techniques and also allows for additional function measurements such as blood flow velocity23 and collagen content.24 In the future, this technique could augment standard fluorescence microscopy as a method for deep-tissue, depth-resolved molecular imaging with relatively high resolution and target sensitivity.
Acknowledgment
The authors thank Rae Luan, Stacy Chiles, Julie Ostrander, and Bryce Davis for help with cell culture, and funding from the NIH (R21 EB006338) and NSF (CBET-0651622). M.S. acknowledges support from the NIH National Research Service Award (F32 CA130309) from the NCI.
References
- (1).Applegate BE, Izatt JA. Opt. Exp. 2006;14(20):9142–9155. doi: 10.1364/oe.14.009142. [DOI] [PubMed] [Google Scholar]
- (2).Xu C, Ye J, Marks DL, Boppart SA. Opt. Lett. 2004;29(14):1647–1649. doi: 10.1364/ol.29.001647. [DOI] [PubMed] [Google Scholar]
- (3).Vinegoni C, Bredfeldt J, Marks D, Boppart S. Opt. Express. 2004;12(2):331–341. doi: 10.1364/opex.12.000331. [DOI] [PubMed] [Google Scholar]
- (4).Yang C, Choma MA, Lamb LE, Simon JD, Izatt JA. Opt. Lett. 2004;29(12):1396–1398. doi: 10.1364/ol.29.001396. [DOI] [PubMed] [Google Scholar]
- (5).Oldenburg AL, Gunther JR, Boppart SA. Opt. Lett. 2005;30(7):747–9. doi: 10.1364/ol.30.000747. [DOI] [PubMed] [Google Scholar]
- (6).Faber DJ, Mik EG, Aalders MCG, van Leeuwen TG. Opt. Lett. 2003;28(16):1436–1438. doi: 10.1364/ol.28.001436. [DOI] [PubMed] [Google Scholar]
- (7).Agrawal A, Huang S, Wei Haw Lin A, Lee MH, Barton JK, Drezek RA, Pfefer TJ. J. Biomed. Opt. 2006;11(4):041121. doi: 10.1117/1.2339071. [DOI] [PubMed] [Google Scholar]
- (8).Adler DC, Huang S-W, Huber R, Fujimoto JG. Opt. Express. 2008;16(7):4376–4393. doi: 10.1364/oe.16.004376. [DOI] [PubMed] [Google Scholar]
- (9).Cang H, Sun T, Li ZY, Chen J, Wiley BJ, Xia Y, Li X. Opt. Lett. 2005;30(22):3048–50. doi: 10.1364/ol.30.003048. [DOI] [PubMed] [Google Scholar]
- (10).Oldenburg AL, Hansen MN, Zweifel DA, Wei A, Boppart SA. Opt. Express. 2006;14:15. doi: 10.1364/oe.14.006724. [DOI] [PubMed] [Google Scholar]
- (11).Boyer D, Tamarat P, Maali A, Lounis B, Orrit M. Science. 2002;297(5584):1160–3. doi: 10.1126/science.1073765. [DOI] [PubMed] [Google Scholar]
- (12).Tilton LW, Taylor JK. J. Res. Natl. Bur. Stand. 1938;20:419–425. [Google Scholar]
- (13).Cognet L, Tardin C, Boyer D, Choquet D, Tamarat P, Lounis B. Proc. Natl. Acad. Sci. U.S.A. 2003;100(20):11350–5. doi: 10.1073/pnas.1534635100. [DOI] [PMC free article] [PubMed] [Google Scholar]
- (14).Choma MA, Ellerbee AK, Yang C, Creazzo TL, Izatt JA. Opt. Lett. 2005;30(10):1162–4. doi: 10.1364/ol.30.001162. [DOI] [PubMed] [Google Scholar]
- (15).Collier T, Follen M, Malpica A, Richards-Kortum R. Appl. Opt. 2005;44(11):2072–81. doi: 10.1364/ao.44.002072. [DOI] [PubMed] [Google Scholar]
- (16).American National Standards Institute . ANSI Z136.1-2007 American national standard for safe use of lasers. Laser Institute of America; Orlando, FL: 2007. I. [Google Scholar]
- (17).Curry AC, Crow M, Wax A. J. Biomed. Opt. 2008;13(1):014022. doi: 10.1117/1.2837450. [DOI] [PubMed] [Google Scholar]
- (18).Sato K, Hosokawa K, Maeda M. J. Am. Chem. Soc. 2003;125(27):8102–3. doi: 10.1021/ja034876s. [DOI] [PubMed] [Google Scholar]
- (19).Bailey KE, Costantini DL, Cai Z, Scollard DA, Chen Z, Reilly RM, Vallis KA. J. Nucl. Med. 2007;48(9):1562–70. doi: 10.2967/jnumed.107.044073. [DOI] [PubMed] [Google Scholar]
- (20).Aaron J, Nitin N, Travis K, Kumar S, Collier T, Park SY, Jose-Yacaman M, Coghlan L, Follen M, Richards-Kortum R, Sokolov K. J. Biomed. Opt. 2007;12(3):034007. doi: 10.1117/1.2737351. [DOI] [PubMed] [Google Scholar]
- (21).Seewaldt VL, Johnson BS, Parker MB, Collins SJ, Swisshelm K. Cell Growth Differ. 1995;6(9):1077–88. [PubMed] [Google Scholar]
- (22).Zharov VP, Galanzha EI, Tuchin VV. J. Biomed. Opt. 2005;10(5):051502. doi: 10.1117/1.2070167. [DOI] [PubMed] [Google Scholar]
- (23).Yazdanfar S, Kulkarni MD, Izatt JA. Opt. Exp. 1997;1(13):424–31. doi: 10.1364/oe.1.000424. [DOI] [PubMed] [Google Scholar]
- (24).Applegate BE, Yang C, Rollins AM, Izatt JA. Opt. Lett. 2004;29(19):2252–4. doi: 10.1364/ol.29.002252. [DOI] [PubMed] [Google Scholar]