

Abstract
Inflammatory bowel disease (IBD) is a chronic disorder caused by multiple factors in a genetically susceptible host. Significant advances in the study of genetic susceptibility have highlighted the importance of the innate immune system in this disease. We previously completed a genomewide linkage study and found a significant locus (IBD6) on chromosome 19p. We were interested in identifying the causal variant in IBD6. We performed a two-stage association mapping study. In stage one, 1530 SNPs were selected from the HapMap database and genotyped in 761 patients with IBD. Among the SNPs that passed the threshold for replication, 26 were successfully genotyped in 754 additional patients (stage two). One intronic variant, rs273506 located in the MAST3 gene was found to be associated in both stages (pooled P=2×10⁻⁴). We identified four MAST3 coding variants, including a non-synonymous SNP rs8108738, correlated to rs273506 and associated to IBD. To test whether MAST3 was expressed in cells of interest, we performed expression assays which showed abundant expression of MAST3 in antigen presenting cells and in lymphocytes. The knockdown of MAST3 specifically decreased TLR4 dependent NF-κB activity. Our findings are additional proof of the pivotal role played by modulators of NF-κB activity in IBD pathogenesis.
Keywords: MAST3, Inflammatory Bowel Disease, TLR4, NF-κB
INTRODUCTION
Inflammatory bowel disease (IBD) is a term describing two complex diseases: Crohn’s disease (CD) and ulcerative colitis (UC). Both CD and UC are common chronic autoimmune diseases of the gastrointestinal tract but they differ in terms of localization and extent of the inflammation. IBD primarily affects people living in industrialized countries. A recent epidemiological survey of IBD in the US reports prevalence rates of 201 per 100000 and 238 per 100000 for CD and UC, respectively 1. The precise causes are still unknown but different environmental factors, ranging from geographic location to lifestyle, hygiene and gut flora, have been proposed 2. In addition, familial clustering and twin studies have clearly shown that inherited factors contribute to disease predisposition. The first gene discovered to be unequivocally associated with CD was CARD15 3; 4. Shortly after, the IBD5 locus was also associated 5. In the last year, more than ten new loci have been associated with susceptibility to or protection from IBD 6–12. However, the contribution of each of these loci is predicted to be small and thus, all the genes discovered to date do not entirely explain the genetic risk for IBD.
To elucidate the genetic basis for CD and UC, we previously performed a genomewide linkage study that identified a significant linkage region (LOD score 4.6) on chromosome 19p, subsequently designated as the IBD6 locus 13. Stratifying the families based on phenotype (i.e., CD vs UC vs combined IBD) and age of diagnosis (early vs late) found evidence of linkage in all subgroups; strongly suggesting that the 19p locus is a general risk factor for IBD. Supporting evidence for this locus was also found in two independent genomewide linkage studies 14; 15. The IBD6 locus extends 28.5Mb and contains 638 known genes, many of which are involved in immunity and inflammation such as ICAM1, ICAM3 and IL12RB1 16. Our previous attempts, using candidates gene approaches 17; 18, to identify the causal gene within this locus resulted in the identification of the variant A1011S in MYO9B as a risk factor for UC. However, this A1011S variant could only account for a relative risk to siblings (λs) of 1.02, and unlike the original findings, was subphenotype specific, and therefore could not explain entirely the observed linkage signal.
To further refine the region containing the major IBD risk factor within the IBD6 locus, we used a systematic high density association mapping approach to analyze the variation in this region. To optimize the statistical power, our experiment was designed in two stages. Specifically, in the first stage, we typed 1530 SNPs selected to tag the common variants in the 28.5 Mb region identified in CEU HapMap dataset. Approximately, ~1800 samples (trios and cases/controls) were genotyped in this screening stage. In the second stage we replicated the most associated SNPs from the initial screen in ~2000 independent samples (trios and cases/controls). These two stages led to the identification of a single significantly replicated variant: rs273506 (combined P= 1.8 × 10⁻⁴). This variant is located in the intronic region of the microtubule-associated serine/threonine-protein kinase gene 3 (MAST3, NM_015016). We subsequently typed the known coding variants within MAST3 and identified one missense, S861G, and three synonymous mutations that are significantly associated in IBD (P<5×10⁻³). Combining these association results with the linkage disequilibrium (LD) and correlation patterns in this region indicate that the association signal is limited to a ~60kb region immediately surrounding the MAST3 gene, suggesting a role for MAST3 in IBD susceptibility.
RESULTS
Two-stage association study identifies rs273506
Our goal was to identify the gene(s) responsible for the IBD6 linkage peak discovered in previous studies. Since candidate gene studies failed to do so, we embarked upon a comprehensive unbiased two-staged association mapping study to search for the specific gene that is responsible for the IBD risk factor in this region. In the first stage, a modest nominal P-value of 0.02 was used as threshold for significance in order to optimize the chance of identifying the association signal. In a second stage, the SNPs that passed this threshold were genotyped in an independent cohort to separate the true and false positives.
In order to tag the common variation in IBD6, we first selected 1530 SNPs that we genotyped in 761 IBD patients and parental or matched controls (see Table 1). A systematic quality control (QC) analysis of the data was performed resulting in a final dataset of 371 trios and 271 independent cases/203 matched controls. A total of 1238 SNPs with an average genotyping call rate of 98.5% passed the QC thresholds (see Supplementary Table 1). Primary testing was done using the IBD phenotype (CD and UC) because our previous linkage study indicated that the IBD6 locus contains a general IBD risk factor 13. In a secondary analysis, we tested association with the CD phenotype since this subgroup was sufficiently large (see Table 1). We found 26 SNPs associated with IBD and 33 with CD, for a total 37 non-redundant SNPs significantly identified through association testing (see Table 2 and Supplementary Table 3).
Table 1.
Study Cohorts
| Trios | Independent cases | Controls | Total samples | ||
|---|---|---|---|---|---|
| Screen | CD | 366 | 241 | 236 | 1575 |
| UC | 45 | 87 | 236 | 458 | |
| IBD* | 433 | 328 | 236 | 1863 | |
|
| |||||
| Replication | CD | 269 | 176 | 344 | 1327 |
| UC | 132 | 177 | 344 | 917 | |
| IBD | 401 | 353 | 344 | 1900 | |
The IBD screen cohort also contains indeterminate colitis (see methods for details).
Table 2.
Top Association Results
| Screening
|
Replication
|
Combined3 |
|||
|---|---|---|---|---|---|
| Marker | Position | cohort1 | P-value2 | P-value2 | P-value2 |
| rs11880212 | 334057 | IBD | 0.012 | 0.1065 | 0.0039 |
| rs12980274 | 360977 | CD | 0.013 | 0.1172 | 0.4424 |
| rs9304882 | 1140482 | CD | 0.002 | N.T. | N.T. |
| rs8111699 | 1160714 | CD | 0.005 | N.T. | N.T. |
| rs6510605 | 1325641 | CD | 0.016 | 0.4700 | 0.4544 |
| rs10404242 | 2010585 | IBD | 0.009 | N.T. | N.T. |
| rs611481 | 3659636 | CD | 0.005 | 0.4131 | 0.0395 |
| rs9973235 | 4798713 | CD | 0.019 | N.T. | N.T. |
| rs1564759 | 5406263 | CD | 0.01 | 0.1034 | 0.4594 |
| rs551244 | 5912883 | IBD | 0.011 | 0.2218 | 0.1036 |
| rs1982082 | 6273442 | IBD | 0.018 | N.T. | N.T. |
| rs11881691 | 8656274 | IBD | 0.005 | 0.4017 | 0.0318 |
| rs8101955 | 13300130 | IBD | 0.003 | N.T. | N.T. |
| rs11879128 | 13442369 | CD | 0.019 | N.T. | N.T. |
| rs892143 | 15506620 | IBD | 0.003 | N.T. | N.T. |
| rs390017 | 16267034 | IBD | 0.014 | 0.1570 | 0.0070 |
| rs2227356 | 16864405 | IBD | 0.001 | 0.1118 | 0.1193 |
| rs8170 | 17250704 | CD | 0.012 | 0.3974 | 0.0757 |
| rs3826700 | 17287501 | IBD | 0.015 | 0.2322 | 0.0165 |
| rs7255307 | 17461244 | CD | 0.005 | 0.3314 | 0.1546 |
| rs1078000 | 17482508 | CD | 0.007 | 0.2466 | 0.1865 |
| rs7254755 | 17577582 | CD | 0.016 | N.T. | N.T. |
| rs36692 | 17767839 | CD | 0.0008 | 0.4530 | 0.0619 |
| rs36690 | 17771483 | CD | 0.008 | N.T. | N.T. |
| rs273506 | 18082647 | IBD | 0.005 | 0.0237 | 0.0002 |
| rs7258722 | 18669915 | IBD | 0.011 | 0.4370 | 0.0153 |
| rs258575 | 19973264 | CD | 0.002 | 0.3153 | 0.0648 |
| rs918442 | 20385941 | IBD | 0.007 | 0.4830 | 0.0312 |
| rs11085397 | 20841228 | CD | 0.014 | 0.0368 | 0.0110 |
| rs11666981 | 22517408 | CD | 0.016 | 0.2885 | 0.0947 |
| rs431270 | 23260806 | CD | 0.017 | N.T. | N.T. |
| rs167153 | 23269553 | IBD | 0.003 | 0.1125 | 0.0013 |
| rs1020075 | 23332057 | IBD | 0.011 | 0.3326 | 0.0124 |
| rs638080 | 23384048 | IBD | 0.011 | 0.2512 | 0.0725 |
| rs629359 | 23414347 | IBD | 0.007 | 0.2117 | 0.0717 |
| rs584460 | 23438251 | IBD | 0.013 | 0.3294 | 0.0607 |
| rs2640201 | 23505118 | CD | 0.014 | 0.1888 | 0.0425 |
Cohort in which the SNP is most associated in screen; replication and combined values correspond to cohorts of the same phenotype
P-value of the Z score.
The total number of post QC samples for the combined cohort is 682 trios, 585 independent cases and 505 controls.
N.T.= Not tested due to assay or quality control failure.
We then performed a replication study using 401 trios as well as 353 independent cases and 344 controls (see Table 1). We successfully typed 26 of the top SNPs (see Table 2 and Supplementary Table 2). A single marker, rs273506 had significant association values in both the IBD screening (stage 1) (P=0.005) and replication (stage 2) (P=0.02) cohorts. To better evaluate the significance and strength of the signal, we merged the screen and replication cohorts (total number of post-QC samples: 682 trios, 582 independent cases and 505 controls) and obtained a combined P-value of 1.8 × 10⁻⁴ and an odds ratio (OR) of 1.23 [95% Confidence Interval (CI): 1.10, 1.38]. The SNP rs273506 is a G/A variant where the A allele has a frequency of 47% (in the stage 1 cohort) and is associated with the IBD phenotype. The rs273506 SNP is located in the second intron of the MAST3 gene (Figure 1).
Figure 1. Association and LD analyses in the MAST3 Region.
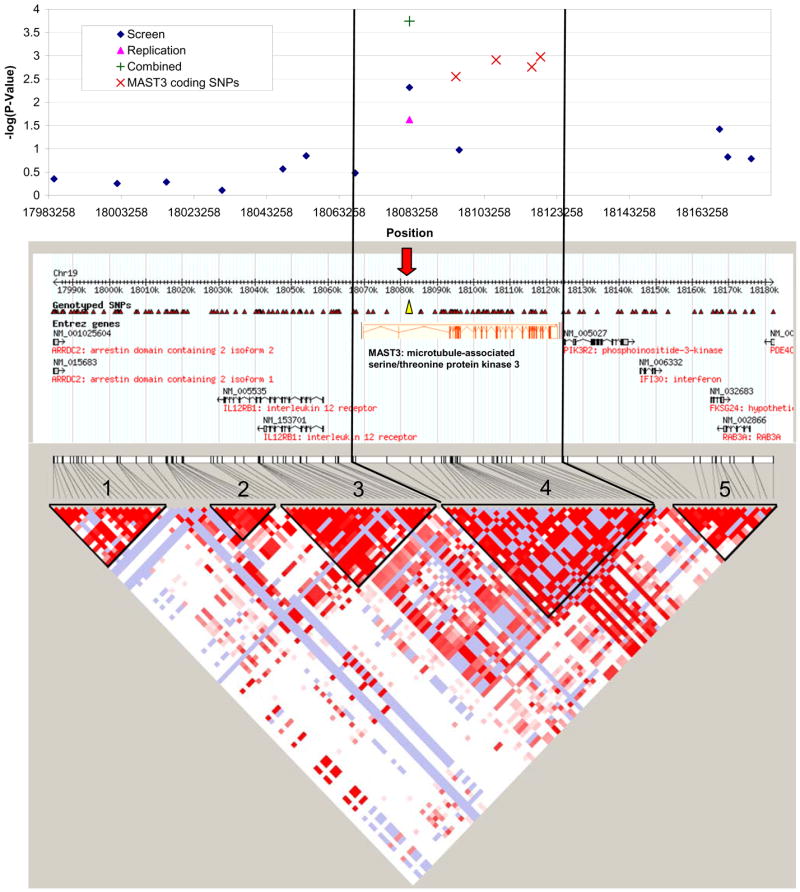
The upper panel summarizes the association results from the screen and replication studies. The most significantly associated SNP (screen and replication) is rs273506, located in the second intron of the MAST3 gene as indicated in the middle panel by the yellow triangle and the red arrow. In an attempt to identify the causal variant, we then genotyped coding SNPs in MAST3 and found that one missense and three synonymous SNPs were also significantly associated (as indicated by X symbols in the upper panel). In the lower panel, it can be seen that these associated SNPs are all found in a region of strong LD (depicted as D′) and that the association does not extend beyond this region (as depicted by haplotype block 4 delimited by rs273504 and rs3736328).
MAST3 gene as IBD susceptibility gene
Given that the association identified in the screen and replicated in an independent cohort was located within MAST3, we were interested in testing the known coding variants within this gene. Specifically, we identified all five MAST3 coding variants found within the CEU HapMap dataset: four synonymous and one non-synonymous. Four of these SNPs are on the same haplotype (r2=1) and are correlated to the associated SNP rs273506 (r2>0.7) in the HapMap dataset. One SNP, rs541225, is not correlated to rs273506 or to the other MAST3 coding SNP (r2<0.1) and thus was not typed. The four remaining MAST3 coding SNPs were genotyped in our cohorts (total number of post-QC samples: 610 trios, 1105 independent cases and 713 controls) and the correlation is consistent with the HapMap data. Of the SNPs genotyped, there are three synonymous variants, rs740691 (H174H), rs2270623 (I536I) and rs2072490 (G1045G) and one non-synonymous, rs8108738 (S861G). All coding SNPs are significantly associated (P<0.005 see Table 3). Being on the same haplotype, the IBD risk conferred by each of these coding variants, as measured by the OR, is approximately the same (1.18 (95% CI [1.04, 1.34]).
Table 3.
Association Results for MAST3 Coding SNPs1
| Marker | MAF2 | Position | Location | AA3 variant | Z score | P-value | OR [95% CI] |
|---|---|---|---|---|---|---|---|
| rs740691 | 0.475 | 18095441 | exon 7 | H174H | 2.99 | 0.003 | 1.18 [1.04,1.34] |
| rs2270623 | 0.469 | 18106512 | exon 15 | I536I | 3.03 | 0.002 | 1.17 [1.06,1.30] |
| rs8108738 | 0.468 | 18116359 | exon 22 | S861G | 3.13 | 0.002 | 1.19 [1.05,1.34] |
| rs2072490 | 0.468 | 18118750 | exon 25 | G1045G | 3.27 | 0.001 | 1.18 [1.04,1.34] |
The total number of post QC samples for the MAST3 coding SNPs is 610 trios, 1105 independent cases and 713 controls.
MAF= minor allele frequency in founders
AA= amino acid
Although this association mapping identified coding variants in MAST3 that are associated to IBD, it is formally possible that they are simply in linkage disequilibrium (LD) with causal variation outside of the MAST3 region. Therefore, we examined the LD and correlation patterns in this region (Figure 1 and 2). MAST3 falls within a region of tight LD containing no other gene (LD block #4 on Figure 1). The significant association results of our screening stage are all located in a 60kb region surrounding rs273506 and implicate MAST3 and not the surrounding genes (Figure 1 upper panel).
Figure 2. MAST3 Correlation Neighbourhood.

Since correlation to a given allele can extend beyond haplotype block boundaries defined by D’, we examined the correlation neighbourhood surrounding the top associated SNPs. Specifically, we determined the correlation (r2) between the significantly associated SNPs and all of the SNPs in the HapMap CEU population. All SNPs correlated at an r2 ≥ 0.1 with rs273506 or rs8108738 are plotted, with similar results obtained for rs740691, rs2270623 and rs2072490 (data not shown). The region defined by the SNPs that are correlated with the associated SNPs at an r2 ≥ 0.5 is emphasized by the black vertical lines (delimiting SNPs are rs273504 and rs2267922). This illustrates that not only are the associated SNPs all located within the MAST3 gene but that all other known but untyped SNPs correlated with these define a correlation neighbourhood limited to MAST3 as well as PIK3R2. These results along with the association results (Table 2, 3 and Figure 1) implicate MAST3 rather than the flanking genes.
Furthermore, the region defined by all the HapMap SNPs correlated to rs273506 by an r2 of 0.5 or greater, contains MAST3 and the PIK3R2 gene (see the correlation neighbourhood depicted in Figure 2). However, the region representing the SNPs correlated by an r2 of 0.7 or higher is restricted to the MAST3 gene, and thus favours the MAST3 gene over the PIK3R2 gene, which encodes a regulatory subunit of the phosphatidylinositol 3-kinase (PI3K). In our screening phase we typed SNPs tagging the variation in the PIK3R2 region and these perfectly tagged (r2=1) two of the three PIK3R2 SNPs present in the HapMap database, including the only known non-synonymous coding SNP (rs1011320), and none were significant. Taken together, these results indicate that a variant in the MAST3 gene is responsible for the association signal detected from SNP rs273506 and that the S861G variant is the most likely candidate.
IL12RB1, located 10kb upstream of MAST3, encodes one of the subunit of the receptor for IL12 and IL23. IL23R has been associated to ileal CD 6 and is a subunit of the receptor of a major cytokine involved in the differentiation of T-helper cells into TH17 cells 19. We were particularly interested in examining the relationship of IL12RB1 to the associated variants in MAST3. In the screening stage of the present study, we typed two SNPs located in IL12RB1 but none of them had significant association results. Altogether the two typed SNPs correlate to 76% of the HapMap intronic and exonic SNPs with an r2>0.7 (average r2=0.975), suggesting absence of association between IL12RB1 and IBD. Furthermore, our associated SNP, rs273506 is very weakly correlated to SNPs in this gene. In fact, the highest r2 does not reach 0.4 (Figure 2). All these findings and the MAST3 association results point to MAST3 as the susceptibility gene.
MAST3 belongs to the MAST kinase family. The MAST3 gene is 53.9 kb long and is encoded by 27 exons. MAST3 encodes an open reading frame of 1309 amino acids. Alignments of the MAST3 human amino acid sequence with the mouse ortholog sequence demonstrate 91% identity 20. The MAST3 protein is a four alpha-helix bundle composed of different domains including a protein kinase domain and a PDZ domain (a common structural domain of signaling proteins designated by an acronym from the first letter of three proteins: PSD95, DlgA and zo-1) that mediates binding to PTEN (Figure 3) 21. Four other members of this family are known: MAST1, MAST2, MAST4 and a mastlike protein, MASTL 22–24. MAST1, 2, 3 and 4 have similar structure and share the PDZ and kinase domains whereas MASTL is a shorter protein lacking the PDZ domain. The four other members of the MAST family have amino acid sequence identity to MAST3 ranging from 45% for MASTL to 73% for MAST2. However, specific domains have higher identity. The MAST3 protein kinase domain has 89%, 89%, 90% identity with the corresponding MAST1, MAST2 and MAST4 protein kinase domain, respectively. The MAST3 PDZ domain identity 73%, 78%, 76% with MAST1, MAST2 and MAST4 is 73%, 78%, 76%, respectively. The associated synonymous SNP I536I is located within the kinase domain. The non-synonymous SNP S861G is not located within any UniProt predicted domains, but might be located in a yet unknown domain or interfere with protein folding (Figure 3).
Figure 3. Schematic Representation of the MAST3 Protein.
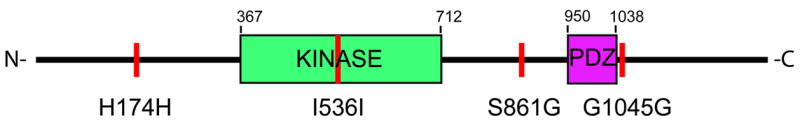
The 1309 amino acids MAST3 protein contains two main functional domains: the kinase domain (in green) and the PDZ domain (in purple). The associated variants are represented by vertical red lines. The numbers indicate the amino acid delimitations as predicted by UniProt (http://www.ebi.ac.uk/uniprot/).
MAST3 regulates TLR4-mediated NF-kB pathway specifically
We next determined the expression of MAST3 in a panel of epithelial and immune cell lines by quantitative real time PCR (qPCR). As shown in Figure 4A, MAST3 is abundantly expressed in human embryonic kidney 293 cells (HEK293) and monocyte-like THP-1 cells. To further investigate the role of MAST3 in immunity, its expression was assessed in different human immune cells via qPCR. Here, it was found that MAST3 is constitutively expressed in CD4+ and CD8+ T cells and CD19+ B cells (Figure 4B). Specifically, CD4+ cells were found to have 35 fold higher amounts of MAST3 than placental control and CD8+ cells were found to have 65 fold higher amounts. We observed the same patterns of expression in primary murine immune cells (see Supplementary Figure 1).
Figure 4. MAST3 mRNA Expression in Human Cell Lines and Primary Immune Cells.
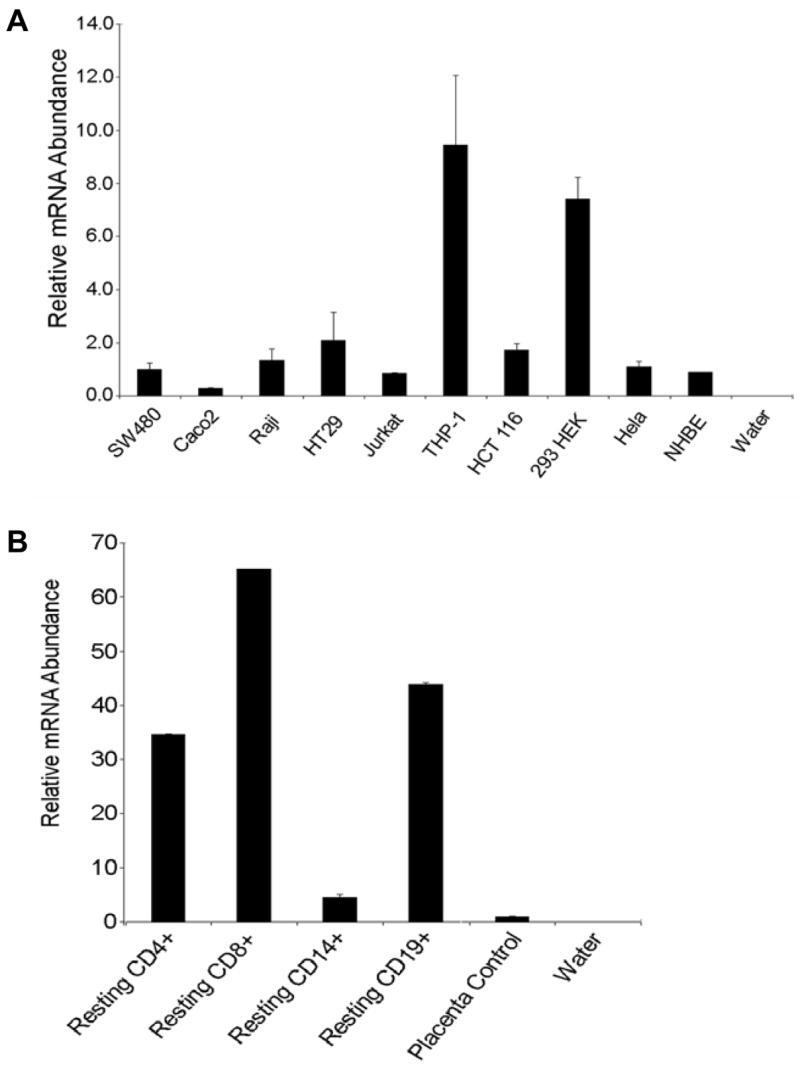
A. Real time RT-PCR was used to assess the expression of endogenous MAST3 gene expression in human cell lines. THP-1, a monocyte cell line, and HEK293, a kidney epithelial cell line, both showed high levels of MAST3 gene expression (7–9 folds higher than SW480 reference cells). B. Real time RT-PCR was used to assess the expression of endogenous MAST3 gene in human immune cell populations. MAST3 expression was highest in CD4+, CD8+ T cells and CD19+ B cells. Error bars represent the standard deviation between triplicates.
Previous knockdown studies have shown that MAST2 is involved in the TLR4-mediated NF-kB pathway 25; 26. The expression of MAST3 in HEK293 cells and availability of TLR reporter cells permitted us to examine if MAST3 also contributed to innate immune signaling pathways. To examine the potential role of MAST3, stable TLR4 and TLR5 HEK293 cell lines were used to assess NF-κB activity after alteration of MAST3 expression. The knockdown of MAST3 did not affect TLR5-mediated NF-kB activity upon stimulation with flagellin, but decreased the TLR4 NF-kB activation significantly following stimulation with lipopolysaccharides (LPS) (Figure 5). These results indicate that MAST3 regulates the NF-kB activity specifically through the TLR4 pathway. Recent studies have highlighted that impairment of the regulation of host-organism interactions may contribute to the development of Crohn’s disease and ulcerative colitis. Here we provide genetic and functional evidence that MAST3 is a genetic susceptibility factor that may contribute to the pathogenesis of IBD.
Figure 5. MAST3 Knockdown attenuates LPS-Mediated NF-κB Activation.
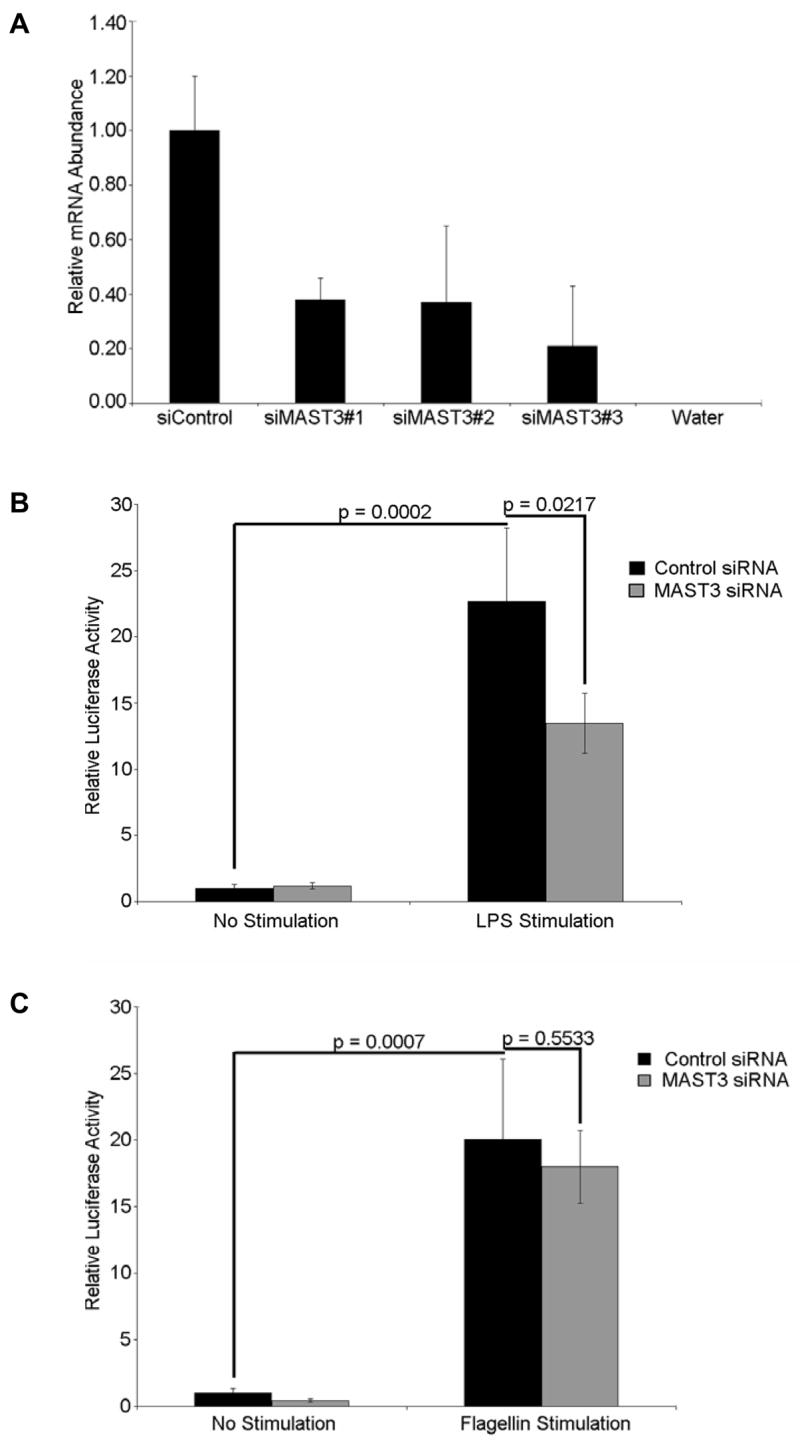
A. MAST3 siRNA knockdown efficiency in HEK293 cells was assessed using three MAST3-specific oligos and corresponding negative control. Of the three MAST3 siRNAs, siMAST3#3 was selected for further experiments. B. MAST3 expression was knocked down in TLR4 HEK293 cells, LPS-mediated NF-κB activation was significantly reduced when compared to LPS stimulated cells transfected with a non-specific siRNA (P-value = 0.0217). C. Conversely, when MAST3 expression was knocked down in TLR5 HEK293 cells, flagellin-mediated NF-κB activation was comparable to NF-κB activity in flagellin stimulated cells transfected with a non-specific siRNA (P-value = 0.553). Error bars represent the standard deviation between three samples taken from three individual cell pellets.
DISCUSSION
The IBD6 locus on chromosome 19p was identified via genomewide linkage as a susceptibility locus common to the different form of IBD. In this study we aimed to identify specific risk factors responsible for the linkage signal in this region. As discussed in a recent meta-analysis on Crohn’s disease 27, the high linkage in regions such as 5q and 6p are result of the combined effect of several genes. The identification of one modest impact gene in this specific study combined to the previous identification of MYO9B led us to believe that the 19p region also contains several susceptibility genes for IBD such as MAST3.
We report here the results of our two-stage association mapping study performed on a combined cohort of more than 1500 IBD cases and their respective parental or matched controls. A single SNP, rs273506, located in the second intron of the MAST3 gene, was found to be associated in the screening and replication IBD cohorts with a combined P-value of 1.8×10⁻⁴. Through LD and correlation patterns, we confirmed that the association signal was coming from MAST3 and not one of the flanking genes such as IL12RB1, a gene involved in the same immune pathway as IL23R which as been associated to IBD 6.
Further analysis of the genetic variation in MAST3 identified four associated coding SNPs including one non-synonymous variant, S861G, and three synonymous coding SNPs (H174H, I536I, G1045G). The strength of the risk conferred by each of these coding variants of the MAST3 gene (OR of ~1.18 with 95% CI [1.04, 1.34]) is in the same range as the OR of other common SNPs that have been recently associated to IBD 5; 7; 8; 10; 11. Consistent with the fact that they are on the same haplotype, all MAST3 coding SNPs typed have the same OR. The SNP S861G, being non synonymous, seems the most likely of the variants tested in MAST3 to have a functional consequence although regulatory SNPs in non-coding region have been shown to influence gene expression 28. Thus we can not formally exclude the possibility that another variant than S861G is the actual causal variant.
Sequence identity analyses as well as functional assays have shown that MAST3 is a kinase 21. Kinases are implicated in numerous cell processes several of which are important in regulation of immune responses. The MAST family is a relatively unknown branch of the kinases. The expression of the MAST family members is diverse; MAST2 and MAST4 are almost ubiquitous whereas MAST1 is most expressed in the brain and MASTL, in B lymphocytes29. Here we show that MAST3 is mostly expressed in antigen presenting cells and lymphocytes. The MAST proteins contain a serine/threonine kinase domain and a PDZ protein interaction domain, not found in MASTL, which modulates interaction with different substrates. Not much is known about the protein interactions of MAST3, but PTEN, a regulator of cell growth and apoptosis, has been shown be a substrate 21. Valiente et al. showed via transfection and co-immunoprecipitation that MAST3 binds PTEN through its PDZ domain and by doing so increases PTEN stability, which in turn facilitates its phosphorylation by MAST3 and other kinases 21.
Although little is known about MAST3 function, studies of the other family members can provide some insight. For example, the MAST2 protein has been shown to be involved in pathways important for inflammation as it regulates IL-12 p40 synthesis and NF-κB activation 25; 26. NF-κB is a transcription factor known to activate the expression of many genes, including cytokines and cytokine subunits such as IL-12 p40, involved in the development of immune cells and the activation of inflammatory processes. IL-12 p40 is a subunit of IL-12, a cytokine involved in the differentiation of Th1 cells and the production of other inflammatory cytokines such as INFγ and TNF-α. IL-12 p40 is also a subunit of IL23, a cytokine involved in the proliferation of Th17 cells which in turn activates myeloid cells and NK cells to produce inflammatory cytokines, including IL6, TNFα and IL17, that drive intestinal inflammation 30. A genomewide association study on IBD identified a strong association to the IL23R gene 6 highlighting the role of the IL23 axis in immune diseases. Given the high sequence identity within functional domains of the MAST family members and the role of MAST2 in inflammation, MAST3 is likely to be involved in similar pathways. Previous studies have reported that MAST2 is expressed in epithelial cells and antigen presenting cells 25. Consequently, we examined the expression of MAST3 in a panel of cell lines and found the highest expression of MAST3 in HEK293 cells and THP-1 monocytes. Further expression analysis revealed that MAST3 is also expressed in primary murine and human immune cells (CD4+ and CD8+ T cells, CD19+ B cells). We next tested the influence of MAST3 on the specific activation of NF-κB via TLR4 and TLR5 signaling and found that MAST3 is involved in the regulation of NF-κB activation via TLR4 but not TLR5 signaling pathways. Members of the Toll family of transmembrane receptors (TLRs) recognize diverse structures associated with pathogenic organisms and can trigger an immune response. Deregulation of the immune response to commensal microbial gut flora is one of the potential causes of IBD. TLR4 responds to LPS, a major component of gram-negative bacteria cell wall. The interaction of LPS with TLR4 results in the recruitment of adaptor protein MyD88 and phosphorylation of IRAK and TRAF6 which leads to the phosphorylation of IKKs and the release of NF-κB from its inhibitor, IκB 31. A variant of TLR4, 299G, was recently found to be associated to IBD and CD 32. Decreases in airway responsiveness to inhaled LPS, NF-κB activation and IL1 expression are among the biological consequences of this variant 33. The MAST2 protein has been shown to play a role in the NF-κB pathway through the binding and stabilization of TRAF6 25. We hypothesize that the MAST3 kinase is similarly involved in the stabilization and/or phosphorylation of one the components of the TLR4 cascade downstream of LPS binding to TLR4 receptor and upstream of NF-κB activation and thus regulating NF-κB activity. It is likely that MAST3 functions at a crossroad defining the nature of the mucosal immune system’s encounters with luminal bacteria. Additional functional analyses will be needed to identify MAST3 targets in this cascade. Elucidation of MAST3’s role in regulating protein interactions in intestinal inflammation will help to define the complex molecular events that contribute to IBD. Our findings add to the growing list of genes (e.g. CARD15, MST1, etc.) that indicate a pivotal role for modulators of NF-κB activity, and more broadly genes of the innate immune response to microflora (e.g. ATG16L1, IRGM etc.), in IBD pathogenesis.
MATERIALS AND METHODS
DNA samples
Samples used here have been the subject of multiple other studies 6; 11; 13; 18. The screening cohort consists of 1863 samples (see Table 1) collected in Canada and Italy. The Canadian samples were collected by the Quebec IBD Genetics Consortium and at the Mount Sinai Hospital IBD Center (University of Toronto). Italian samples come from a population enrolled at San Giovanni Rotondo ‘CSS’ Hospital. The replication cohort consists of 1900 samples from the NIDDK IBD Genetics Consortium (IBDGC). The additional MAST3 SNPs were genotyped on the replication cohort, part of the screen cohort (Italian and Quebec samples) and on additional Italian samples (total samples before QC: 3894). IBDGC cohorts were ascertained through Baltimore, Chicago, Los Angeles, Montreal, Pittsburgh, and Toronto Genetics Research Centers. In all populations considered, the diagnosis of IBD and classification as CD, UC or indeterminate colitis (part of the IBD cohort but not studied independently as a subphenotype) was confirmed by established criteria of clinical, radiological and endoscopic analysis, and from histology reports. A review of the patient’s chart, as well as an interview with the patient, was done to complete the phenotypic data. Written informed consent was obtained from all participants and ethics approval was granted in each of the participating institutions.
SNP selection
In order to select an appropriate set of SNPs to capture the common variation within the IBD6 region, SNP genotype information was downloaded from HapMap data phase I CEU (release 16a from March 1, 2005). To maximize the power, only SNPs with minor allele frequency greater than 10% were included in the study. A total of 1530 tag SNPs were selected using Tagger (ver.0.9.5) to be correlated with non-genotyped SNPs with a minimal r2 of 0.7 (aggressive tagging). Additionally, three IBD5 SNPs (rs1007602, rs11739135, rs17622208), two CARD15 (rs2066844, rs2066845) (used as positive controls) and one chromosome X (rs2106416 used as a gender control) were also selected for inclusion in the genotyping. Three positive control SNPs were successfully genotyped and all were significantly associated (see supplementary Table 1). In line with other IBD association studies the CARD15 SNP, rs2066844, was the most associated SNP in our CD cohort.
Genotyping methods
For the screening stage, samples were genotyped on the Illumina BeadLab system (GoldenGate assay) at The Broad Institute Center for Genotyping and Analysis using a method previously described 34. The genotyping for the replication stage and MAST3 coding SNPs was performed using primer extension chemistry and mass spectrometric analysis (iPlexGold assay, Sequenom) in the Laboratory of Genetics and Genomic Medicine of Inflammation in Montreal (www.inflammgen.org).
Quality control
Quality Control (QC) was performed on both screening and replication data (Supplementary Tables 1 and 2). Looking at the data distribution, we selected parameters thresholds that would optimize the quality of the data while keeping as many SNPs and samples as possible. During the QC of the screening data, SNPs with less than 75% of genotype calls were removed first to prevent weak assays from influencing the other QC parameters. At this point, one monomorphic SNP was also removed. We removed samples and SNPs with less than 90% and 80% of genotype calls, respectively. Finally, we evaluated the relationship between all samples using the Identity by State tests implemented in Plink (version v0.99q) and removed individuals that did not correspond to their pedigree data suggesting sample mix up or contamination. These analyses resulted in a final high quality dataset, used for subsequent association analysis, consisting of 1238 SNPs, 371 trios, 271 cases and 203 controls. Average call rate per individual and per SNP is 98.5%.
For the replication stage, we eliminated the SNPs with less than 85% of genotype calls and sample with less than 90% genotype calls. Then, we removed all the samples that were common with the screening samples to obtain a true independent replication dataset consisting of 311 trios, 311 cases and 302 controls and genotyping results for 26 SNPs. Average call rate per individual and per SNP for this dataset is 98.9% and 99.0%, respectively.
Association testing
Association in trios was assessed by the transmission disequilibrium test (TDT) 35 and in cases/controls by a standard chi-squared (χ2) test carried out on a 2×2 contingency table. To combine data from trios and cases/controls, the number of risk alleles transmitted in trios or found in cases was reformatted as a mean or expected count (ET and EC), observed count (OT and OC), and variance (varT and varC). A combined Z-score was then calculated by summation as Z=[(OT+OC)-(ET+EC)]/√(varT+varC) 17. For the association result of the screening stage, the nominal two-tailed P-values were derived as the P-value corresponding to the standard normal cumulative distribution of a Z-score. Nominal associations (P<0.02) in the IBD and CD cohorts were pursued in a replication phase to ensure the elimination of false positives. For the replication results a one-tailed test was used. The association scores of the additional coding and intronic SNPs of MAST3 are the results of a two-tailed test.
Cell cultures
Cell lines were maintained under normal conditions (37°C, 5% CO2) in standard culture media (DMEM containing 10% FCS+Fe+2 and 50 μg/mL gentamicin for adherent cell lines; IMDM containing 10% FCS+Fe+2, 100 μM β-mercaptoethanol, and 50 μg/mL gentamicin for suspension cell lines).
MAST3 Expression in Human Cells
RNA from cell lines was extracted using RNeasy columns (Qiagen, Valencia, CA), according to the manufacturer’s directions. 0.5 μg mRNA was used to prepare first strand cDNA using Bio-Rad’s iScript enzyme (Hercules, CA). Real-time Reverse Transcriptase (RT) PCR was performed using the IQ SYBR Green Supermix (Bio-Rad) according to the recommended protocol, with the following primers: MAST3 Forward: 5′-CTGTCGCCATTGTCGGTCC-3′, MAST3 Reverse: 5′-ATAGCCGGAAGATGGGAGAGA-3′, GAPDH Forward: 5′-GGAGCCAAACGGGTCATCATCTC-3′, and GAPDH reverse: 5′-GAGGGGCCATCCACAGTCTTCT-3′. Amplicons were visualized on a 2% agarose gel to confirm correct band sizes. Samples were run in duplicate. All data were normalized to MAST3 expression in SW480 cells and to GAPDH expression. In order to determine MAST3 expression in human immune cells, a commercially available cDNA panel (Human Blood Fractions) was obtained from Clontech (Mountain View, CA). Quantitative PCR for MAST3 was performed as above. All data were normalized to MAST3 expression in the placenta control and to GAPDH expression.
MAST3 Expression in Mouse Immune Cells
Purified immune cell populations were isolated from the spleens of six week old C57BL/6 mice using magnetic beads (Miltentyi, Aubrun, CA) (one liver for each cell type) according to the manufacturer’s instructions; RNA from lung was also prepared as a reference control. Purity of the isolated cells was confirmed by FACS analysis (see supplemental data) and RNA was extracted as described above. Murine-specific MAST3 primers are as follows: MAST3 Mm Forward: 5′-AGGCTGCATCTATCAGAGCG -3′, MAST3 Mm Reverse: 5′-AGGCTCCTCATCGAAGCTCA-3′. Amplicons were visualized on a 2% agarose gel to confirm correct band sizes. Samples were run in duplicate. All data were normalized to cDNA from mouse lung and GAPDH expression.
Transfection and Reporter Assays
Three separate siRNAs specific for MAST3, along with corresponding negative controls, were obtained from Invitrogen (Carlsbad, CA). One day before transfection, 4 × 10⁵ HEK293 cells in 1 ml of DMEM medium were plated per well in 12-well plates. The cells were transiently transfected with 1 uL of 20 nM siRNA against MAST3 or corresponding siRNA controls using Transfectin according to the manufacturer’s instructions. Three days later, the cells were rinsed in ice-cold PBS and harvested for reverse transcriptase qPCR as described above. All data was normalized to cDNA from cells transfected with control siRNA oligos and GAPDH expression. Of the three MAST3-specific siRNAs, one was chosen for further experiments (siMAST3#3).
TLR4 and TLR5 HEK293 stable cell lines were kindly provided by Dr. Douglas Golenbock (University of Massachusetts Medical School, MA). Those cells were maintained at 37°C and 5 % CO2 in DMEM supplemented with 10 % fetal calf serum and 50 μg/mL gentamicin. One day before transfection, 4 × 10⁵ cells in 1 ml of DMEM medium were plated per well in 12-well plates. The cells were transiently transfected with 1 uL of 20 nM siRNA against MAST3 as selected previously (forward sequence: GCUGAGGAUGAUACCAGCUACUUUG, or medium GC negative control siRNA) with 25 ng of NF-κB-luc and 0.1 ng of renilla-luc by using Transfectin according to the manufacturer’s instructions. Three days later, cells were rinsed in ice-cold PBS and harvested for qPCR and reporter assays. Stimulation was done using 100 ng/ml LPS or 0.1 ng/ml Flagellin for another 6 hours. Reporter luciferase activity was measured by a standard protocol as supplied by the manufacturer (Dual Luciferase Reporter Assay System, Promega, Madison, WI) from three biological samples (i.e. three individual cell pellets). qPCR was performed to assess MAST3 expression as described above. Samples were run in duplicate. All data was normalized to cDNA from cells transfected with control siRNA oligos and to GAPDH expression.
Supplementary Material
MAST3 Expression in Primary Mouse Immune Cells. A. Purified murine immune cell populations were obtained as described in Materials and Methods, and real time RT-PCR was used to assess endogenous MAST3 gene expression. CD4+, CD8+, CD19+, and B220+ cells all showed strong MAST3 expression (6 to 14 fold higher than reference RNA). B. FACS plots show overall purity of isolated murine immune cell fractions. Errors bars represent the standard deviation of two separate RT experiments using aliquots of the same samples.
All Association Results for the Screening Stage
Supplementary Table 1: Quality Control Steps and Results from the Screening Stage
Supplementary Table 2: Quality Control Steps and Results from the Replication Stage
Supplementary Information is available at the Genes & Immunity’s website
Acknowledgments
This project was funded by grants from the National Institute of Diabetes and Digestive and Kidney Diseases DK062432 to JDR and AI062773 to RJX. The Broad Institute Center for Genotyping and Analysis is supported by grant U54 RR020278 from the National Center for Research Resources. C. Labbé is the recipient of a Fond de Recherche en Santé du Québec studentship award. The authors would like to thank Marcia Budarf, Marie-Pierre Lévesque and Jing Lian for their help in the review of the manuscript.
Footnotes
Competing interests
The authors have declared that no competing interest exists.
References
- 1.Kappelman MD, Rifas-Shiman SL, Kleinman K, Ollendorf D, Bousvaros A, Grand RJ, et al. The prevalence and geographic distribution of Crohn’s disease and ulcerative colitis in the United States. Clin Gastroenterol Hepatol. 2007;5(12):1424–1429. doi: 10.1016/j.cgh.2007.07.012. [DOI] [PubMed] [Google Scholar]
- 2.Baumgart DC, Carding SR. Inflammatory bowel disease: cause and immunobiology. Lancet. 2007;369(9573):1627–1640. doi: 10.1016/S0140-6736(07)60750-8. [DOI] [PubMed] [Google Scholar]
- 3.Hugot JP, Chamaillard M, Zouali H, Lesage S, Cezard JP, Belaiche J, et al. Association of NOD2 leucine-rich repeat variants with susceptibility to Crohn’s disease. Nature. 2001;411(6837):599–603. doi: 10.1038/35079107. [DOI] [PubMed] [Google Scholar]
- 4.Ogura Y, Bonen DK, Inohara N, Nicolae DL, Chen FF, Ramos R, et al. A frameshift mutation in NOD2 associated with susceptibility to Crohn’s disease. Nature. 2001;411(6837):603–606. doi: 10.1038/35079114. [DOI] [PubMed] [Google Scholar]
- 5.Rioux JD, Daly MJ, Silverberg MS, Lindblad K, Steinhart H, Cohen Z, et al. Genetic variation in the 5q31 cytokine gene cluster confers susceptibility to Crohn disease. Nat Genet. 2001;29(2):223–228. doi: 10.1038/ng1001-223. [DOI] [PubMed] [Google Scholar]
- 6.Duerr RH, Taylor KD, Brant SR, Rioux JD, Silverberg MS, Daly MJ, et al. A genome-wide association study identifies IL23R as an inflammatory bowel disease gene. Science. 2006;314(5804):1461–1463. doi: 10.1126/science.1135245. [DOI] [PMC free article] [PubMed] [Google Scholar]
- 7.Franke A, Hampe J, Rosenstiel P, Becker C, Wagner F, Hasler R, et al. Systematic association mapping identifies NELL1 as a novel IBD disease gene. PLoS ONE. 2007;2(1):e691. doi: 10.1371/journal.pone.0000691. [DOI] [PMC free article] [PubMed] [Google Scholar]
- 8.Hampe J, Franke A, Rosenstiel P, Till A, Teuber M, Huse K, et al. A genome-wide association scan of nonsynonymous SNPs identifies a susceptibility variant for Crohn disease in ATG16L1. Nat Genet. 2007;39(2):207–211. doi: 10.1038/ng1954. [DOI] [PubMed] [Google Scholar]
- 9.Libioulle C, Louis E, Hansoul S, Sandor C, Farnir F, Franchimont D, et al. Novel Crohn disease locus identified by genome-wide association maps to a gene desert on 5p13.1 and modulates expression of PTGER4. PLoS Genet. 2007;3(4):e58. doi: 10.1371/journal.pgen.0030058. [DOI] [PMC free article] [PubMed] [Google Scholar]
- 10.Parkes M, Barrett JC, Prescott NJ, Tremelling M, Anderson CA, Fisher SA, et al. Sequence variants in the autophagy gene IRGM and multiple other replicating loci contribute to Crohn’s disease susceptibility. Nat Genet. 2007;39(7):830–832. doi: 10.1038/ng2061. [DOI] [PMC free article] [PubMed] [Google Scholar]
- 11.Rioux JD, Xavier RJ, Taylor KD, Silverberg MS, Goyette P, Huett A, et al. Genome-wide association study identifies new susceptibility loci for Crohn disease and implicates autophagy in disease pathogenesis. Nat Genet. 2007;39(5):596–604. doi: 10.1038/ng2032. [DOI] [PMC free article] [PubMed] [Google Scholar]
- 12.WTCCC. Genome-wide association study of 14,000 cases of seven common diseases and 3,000 shared controls. Nature. 2007;447(7145):661–678. doi: 10.1038/nature05911. [DOI] [PMC free article] [PubMed] [Google Scholar]
- 13.Rioux JD, Silverberg MS, Daly MJ, Steinhart AH, McLeod RS, Griffiths AM, et al. Genomewide search in Canadian families with inflammatory bowel disease reveals two novel susceptibility loci. Am J Hum Genet. 2000;66(6):1863–1870. doi: 10.1086/302913. [DOI] [PMC free article] [PubMed] [Google Scholar]
- 14.Cho JH, Nicolae DL, Gold LH, Fields CT, LaBuda MC, Rohal PM, et al. Identification of novel susceptibility loci for inflammatory bowel disease on chromosomes 1p, 3q, and 4q: evidence for epistasis between 1p and IBD1. Proc Natl Acad Sci U S A. 1998;95(13):7502–7507. doi: 10.1073/pnas.95.13.7502. [DOI] [PMC free article] [PubMed] [Google Scholar]
- 15.Ma Y, Ohmen JD, Li Z, Bentley LG, McElree C, Pressman S, et al. A genome-wide search identifies potential new susceptibility loci for Crohn’s disease. Inflamm Bowel Dis. 1999;5(4):271–278. doi: 10.1097/00054725-199911000-00005. [DOI] [PubMed] [Google Scholar]
- 16.Grimwood J, Gordon LA, Olsen A, Terry A, Schmutz J, Lamerdin J, et al. The DNA sequence and biology of human chromosome 19. Nature. 2004;428(6982):529–535. doi: 10.1038/nature02399. [DOI] [PubMed] [Google Scholar]
- 17.Tello-Ruiz MK, Curley C, DelMonte T, Giallourakis C, Kirby A, Miller K, et al. Haplotype-based association analysis of 56 functional candidate genes in the IBD6 locus on chromosome 19. Eur J Hum Genet. 2006;14(6):780–790. doi: 10.1038/sj.ejhg.5201612. [DOI] [PubMed] [Google Scholar]
- 18.van Bodegraven AA, Curley CR, Hunt KA, Monsuur AJ, Linskens RK, Onnie CM, et al. Genetic variation in myosin IXB is associated with ulcerative colitis. Gastroenterology. 2006;131(6):1768–1774. doi: 10.1053/j.gastro.2006.09.011. [DOI] [PubMed] [Google Scholar]
- 19.Steinman L. A brief history of T(H)17, the first major revision in the T(H)1/T(H)2 hypothesis of T cell-mediated tissue damage. Nat Med. 2007;13(2):139–145. doi: 10.1038/nm1551. [DOI] [PubMed] [Google Scholar]
- 20.NCBI. HomoloGene. 2008 http://www.ncbi.nlm.nih.gov/sites/entrez?db=homologene.
- 21.Valiente M, Andres-Pons A, Gomar B, Torres J, Gil A, Tapparel C, et al. Binding of PTEN to specific PDZ domains contributes to PTEN protein stability and phosphorylation by microtubule-associated serine/threonine kinases. J Biol Chem. 2005;280(32):28936–28943. doi: 10.1074/jbc.M504761200. [DOI] [PubMed] [Google Scholar]
- 22.Lumeng C, Phelps S, Crawford GE, Walden PD, Barald K, Chamberlain JS. Interactions between beta 2-syntrophin and a family of microtubule-associated serine/threonine kinases. Nat Neurosci. 1999;2(7):611–617. doi: 10.1038/10165. [DOI] [PubMed] [Google Scholar]
- 23.Sun L, Gu S, Li X, Sun Y, Zheng D, Yu K, et al. Identification of a novel human MAST4 gene, a new member of the microtubule associated serine-threonine kinase family. Mol Biol (Mosk) 2006;40(5):808–815. [PubMed] [Google Scholar]
- 24.Walden PD, Cowan NJ. A novel 205-kilodalton testis-specific serine/threonine protein kinase associated with microtubules of the spermatid manchette. Mol Cell Biol. 1993;13(12):7625–7635. doi: 10.1128/mcb.13.12.7625. [DOI] [PMC free article] [PubMed] [Google Scholar]
- 25.Xiong H, Li H, Chen Y, Zhao J, Unkeless JC. Interaction of TRAF6 with MAST205 regulates NF-kappaB activation and MAST205 stability. J Biol Chem. 2004;279(42):43675–43683. doi: 10.1074/jbc.M404328200. [DOI] [PubMed] [Google Scholar]
- 26.Zhou H, Xiong H, Li H, Plevy SE, Walden PD, Sassaroli M, et al. Microtubule-associated serine/threonine kinase-205 kDa and Fc gamma receptor control IL-12 p40 synthesis and NF-kappa B activation. J Immunol. 2004;172(4):2559–2568. doi: 10.4049/jimmunol.172.4.2559. [DOI] [PubMed] [Google Scholar]
- 27.Barrett JC, Hansoul S, Nicolae DL, Cho JH, Duerr RH, Rioux JD, et al. Genome-wide association defines more than thirty distinct susceptibility loci for Crohn’s disease. Nature Genetics. 2008 doi: 10.1038/NG.175. in press. [DOI] [PMC free article] [PubMed] [Google Scholar]
- 28.Dixon AL, Liang L, Moffatt MF, Chen W, Heath S, Wong KC, et al. A genome-wide association study of global gene expression. Nat Genet. 2007;39(10):1202–1207. doi: 10.1038/ng2109. [DOI] [PubMed] [Google Scholar]
- 29.Su AI, Cooke MP, Ching KA, Hakak Y, Walker JR, Wiltshire T, et al. Large-scale analysis of the human and mouse transcriptomes. Proc Natl Acad Sci U S A. 2002;99(7):4465–4470. doi: 10.1073/pnas.012025199. [DOI] [PMC free article] [PubMed] [Google Scholar]
- 30.McGovern D, Powrie F. The IL23 axis plays a key role in the pathogenesis of IBD. Gut. 2007;56(10):1333–1336. doi: 10.1136/gut.2006.115402. [DOI] [PMC free article] [PubMed] [Google Scholar]
- 31.Gay NJ, Gangloff M. Structure and function of Toll receptors and their ligands. Annu Rev Biochem. 2007;76:141–165. doi: 10.1146/annurev.biochem.76.060305.151318. [DOI] [PubMed] [Google Scholar]
- 32.De Jager PL, Franchimont D, Waliszewska A, Bitton A, Cohen A, Langelier D, et al. The role of the Toll receptor pathway in susceptibility to inflammatory bowel diseases. Genes Immun. 2007;8(5):387–397. doi: 10.1038/sj.gene.6364398. [DOI] [PubMed] [Google Scholar]
- 33.Arbour NC, Lorenz E, Schutte BC, Zabner J, Kline JN, Jones M, et al. TLR4 mutations are associated with endotoxin hyporesponsiveness in humans. Nat Genet. 2000;25(2):187–191. doi: 10.1038/76048. [DOI] [PubMed] [Google Scholar]
- 34.Shen R, Fan JB, Campbell D, Chang W, Chen J, Doucet D, et al. High-throughput SNP genotyping on universal bead arrays. Mutat Res. 2005;573(1–2):70–82. doi: 10.1016/j.mrfmmm.2004.07.022. [DOI] [PubMed] [Google Scholar]
- 35.Spielman RS, McGinnis RE, Ewens WJ. Transmission test for linkage disequilibrium: the insulin gene region and insulin-dependent diabetes mellitus (IDDM) Am J Hum Genet. 1993;52(3):506–516. [PMC free article] [PubMed] [Google Scholar]
Associated Data
This section collects any data citations, data availability statements, or supplementary materials included in this article.
Supplementary Materials
MAST3 Expression in Primary Mouse Immune Cells. A. Purified murine immune cell populations were obtained as described in Materials and Methods, and real time RT-PCR was used to assess endogenous MAST3 gene expression. CD4+, CD8+, CD19+, and B220+ cells all showed strong MAST3 expression (6 to 14 fold higher than reference RNA). B. FACS plots show overall purity of isolated murine immune cell fractions. Errors bars represent the standard deviation of two separate RT experiments using aliquots of the same samples.
All Association Results for the Screening Stage
Supplementary Table 1: Quality Control Steps and Results from the Screening Stage
Supplementary Table 2: Quality Control Steps and Results from the Replication Stage
Supplementary Information is available at the Genes & Immunity’s website