Abstract
The proteins responsible for reduced glutathione (GSH) export under both basal conditions and in cells undergoing apoptosis have not yet been identified, although recent studies implicate some members of the multidrug resistance-associated protein family (MRP/ABCC) in this process. To examine the role of MRP1 in GSH release, the present study measured basal and apoptotic GSH efflux in HEK293 cells stably transfected with human MRP1. MRP1-overexpressing cells had lower intracellular GSH levels and higher levels of GSH release, under both basal conditions and after apoptosis was induced with either Fas antibody or staurosporine. Despite the enhanced GSH efflux in MRP1-overexpressing cells, intracellular GSH levels were not further depleted when cells were treated with Fas antibody or staurosporine, suggesting an increase in GSH synthesis. MRP1-overexpressing cells were also less susceptible to apoptosis, suggesting that the stable intracellular GSH levels may have protected cells from death. Overall, these results demonstrate that basal and apoptotic GSH release are markedly enhanced in cells overexpressing MRP1, suggesting that MRP1 plays a key role in these processes. The enhanced GSH release, with a concurrent decrease of intracellular GSH, appears to be necessary for the progression of apoptosis.
Keywords: Glutathione, Multidrug resistance-associated proteins, MRP1, apoptosis
Introduction
Glutathione (GSH) is involved in a number of biochemical processes and its levels in various cellular compartments are tightly controlled. The two primary mechanisms by which cells regulate intracellular GSH levels are by altering the rate of its biosynthesis and the rate of GSH export from cells. Interestingly, cells undergoing apoptosis release large quantities of GSH into the extracellular space by a transport-mediated process [1-6]. The significance of GSH release to the apoptotic process, and the transport mechanisms remain poorly defined. Because of the protective role of GSH, it has been hypothesized that GSH depletion increases reactive oxygen species which can act as second messengers to activate apoptotic pathways, or it may lead to a change in the redox state of proteins whose catalytic activity may be required for apoptosis to proceed [7, 8].
The proteins responsible for GSH export remain largely unknown, although there is growing evidence that some of the multidrug resistance-associated proteins (MRP/ABCC) are involved in this process [4, 9-19]. Among the MRPs, MRP1 is the best characterized [4, 9, 10]. MRP1 is expressed in all mammalian cells that have been examined, making it a likely candidate for the major GSH transporter, and several studies have shown that MRP1-overexpression is associated with lower levels of intracellular GSH and higher levels of extracellular GSH [11-15]. In addition, Mrp1-/- mice have higher GSH levels in tissues that normally express this protein, whereas GSH levels are unchanged in tissues that do not normally express Mrp1 [16, 17]. The MRP proteins are also thought to be involved in apoptotic GSH release, but this is also not well defined. Other studies have associated increased cytotoxicity in cells overexpressing MRP1 to loss of intracellular GSH [18, 19].
In addition to the MRPs, the rat organic anion transporting polypeptide 1 and 2 (Oatp1/Slc21a1 and Oatp2/Slc21a5) have also been shown to accept GSH as a substrate [20, 21], and human OATP8 has been implicated in GSH transport [22-24]; however, recent studies failed to confirm the latter findings [4,25]. Based largely on the use of pharmacological inhibitors and indirect GSH detection methods, Franco and colleagues [23,24] concluded that cellular GSH export in Jurkat T cells is mediated by the OATP proteins. In contrast, Hammond et al. [4] used RNAi in the same cell model and a comparison with a different lymphocyte cell line to demonstrate that the MRP proteins rather than the OATP proteins are responsible for GSH export. The latter study demonstrated that decreasing MRP1 expression in Jurkat cells leads to a decrease in both basal and apoptotic GSH release, suggesting that MRP1 is a major player in both these processes [4].
To further characterize the role of MRP1 in basal and apoptotic GSH export, the present study assessed GSH export in HEK293 cells stably overexpressing human MRP1. The results suggest that MRP1 is a major contributor to GSH export in this cell model.
Materials and methods
Materials
Fas antibody clone CH-11 was purchased from MBL International Corporation (Woburn, MA). Fluorescent caspase 3 substrate Ac-DEVD-AMC was from Calbiochem (San Diego, CA), Annexin V-APC was from BD Pharmingen (San Jose, CA), calcein-AM was from Molecular Probes-Invitrogen (Carlsbad, CA) and [3H]LTC4 from PerkinElmer (Waltham, MA). All other chemicals and reagents were purchased from Sigma-Aldrich (St. Louis, MO).
Cell culture and transfection
HEK293 cells were obtained from the American Type Culture Collection (ATCC, Manassas, VA) and cultured in Dulbecco’s modified Eagle’s medium supplemented with 10% fetal bovine serum (Mediatech, Herndon, VA) and 5 mg/mL penicillin/streptomycin (Gibco, Grand Island, NY), and incubated at 37°C in a 5% CO2 atmosphere. Human MRP1 cloned into the pcDNA3.1 vector (Invitrogen, Carlsbad, CA) was kindly provided by Dr. Susan Cole, Queen’s University, Ontario, Canada. HEK293 cells were transfected with MRP1 using Fugene 6 transfection reagent (Roche, Notley, NJ). Stable cell lines were created by culturing transfectants in 800 μg/ml G418 (Invitrogen, Carlsbad, CA) for 3 weeks. Expression of MRP1 in the G418 resistant clones was determined by real time quantitative RT-PCR, and by immunoblot and functional analyses. For all experiments, 0.5 × 10⁶ cells were plated per well of a 6-well plate. When confluent, cells were washed once with KH buffer (Krebs-Henseleit Buffer: 118 mM NaCl, 4.7 mM KCl, 1.2 mM KH2PO4, 25 mM NaHCO3, 0.6 mM MgSO4, 1.25 mM CaCl2 and 10 mM Hepes/Tris; pH 7.5) and all experiments were performed in KH buffer containing 0.5 mM acivicin, an inhibitor of γ-glutamyl transpeptidase activity.
mRNA expression
Total RNA was isolated using the RNeasy Mini Kit and the RNase-Free DNase set (Qiagen, Valencia, CA). Oligonucleotide primers were designed using Primer Express 1.5 (Applied Biosystems, Foster City, CA) as previously described [4]. PCR analysis was performed using iScript One-Step RT-PCR kit with SYBR Green (Bio-Rad, Hercules, CA) and the Roto-Gene 3000 real time light cycler (Corbett Research, Phenix Corporation, Hayward, CA). Total RNA (10-100 ng) was used, and the data are presented relative to human β-actin.
MRP1 protein expression
Whole cell lysates were collected as previously described [26]. Briefly, cells were washed once in PBS and collected in 1X phosphate buffered saline solution (Invitrogen, Carlsbad, CA) containing 10 mM EDTA, 1mM phenylmethanesulfonylfluoride (PMSF) and 1:100 dilution of mammalian protease inhibitor cocktail (Sigma, St. Louis, MO). After centrifugation at 10,000 x g at 4°C for 10 min, pellets were frozen overnight at -80°C. Pellets were thawed on ice and lysed in 1X PBS solution containing 10 mM EDTA, 25 mM Tris-HCl, pH 7.4, 300 mM NaCl, 1 mM CaCl2, 1% Triton X-100, 1 mM PMSF, and 1:100 dilution of mammalian protease inhibitor cocktail by passing through a 25-gauge needle. The lysate was centrifuged at 10,000 x g for 5 min. The concentration of the supernatant (whole cell lysate) was determined using Bio Rad’s DC protein assay. Protein (10 μg) was run on a 4-20 % Tris-HCl Ready Gel (Bio-Rad, Hercules, CA) using a tank blotting system from Bio-Rad and detected using chemiluminescence (Perkin Elmer, Boston, MA). MRP1 primary antibody, MRPr1 (Axxora, San Diego, CA), was diluted in tris-buffered saline Tween-20 (TBST) containing 1% low fat powered milk and 1 % bovine serum albumin at a 1:200 dilution. The secondary antibody was horseradish peroxidase-conjugated goat anti-rat IgG (1:15000).
GSH release
Cells were preincubated for 20 min at 37°C in KH buffer containing 0.5 mM acivicin to inhibit γ-glutamyl transpeptidase activity. The culture medium was collected to analyze for extracellular GSH at different times of incubation. Cells were lysed with 5% perchloric acid containing 1 mM EDTA, centrifuged at 18,000 x g for 5 min and the resulting supernatant was analyzed for intracellular GSH using an enzymatic assay containing 5,5’-dithio-bis(2-nitrobenzoic acid) and glutathione reductase [27]. The pellet was dissolved in 1 M NaOH and used for protein analysis using the Lowry protein assay [28]. Results are expressed either as nmol GSH/mg protein or as the ratio of extracellular to intracellular GSH.
Calcein release activity
Cells were incubated with 1 μM calcein-AM at 4°C for 1 h, washed with KH buffer, and resuspended in KH buffer plus 0.5 mM acivicin. Calcein in the extracellular buffer was analyzed by removing 200 μl of the medium at different times of incubation, and this was placed in a 96-well plate. For intracellular calcein, cells were lysed with KH buffer plus 2% Triton X-100, centrifuged for 5 min at 18,000 x g and the supernatant added to the 96 well plate. Samples were analyzed on a SPECRTAmax Gemini XS spectrofluorometer (Molecular Devices Corporation, Sunnyvale, CA) at 37°C, excitation 485; emission 530. Cells without calcein were measured to detect background fluorescence. Protein was analyzed using the DC protein assay (Bio-Rad, Hercules, CA). The calcein release data were expressed as average fluorescence/mg protein and then converted to percent of calcein released (supernatant) from total calcein made by cells (supernatant + cell lysate).
Membrane vesicle preparation
Plasma membrane vesicles were prepared from transfected HEK293 cells using sucrose gradients as previously described [29, 30]. Briefly, cells were collected into a transport buffer solution containing 250 mM sucrose, 10 mM Hepes/Tris pH 7.5, 20 mM KCl, 0.20 mM CaCl2, homogenized 20-25 times with a B pestle of a Dounce homogenizer on ice, and centrifuged at 800 x g. The supernatant was layered onto sucrose gradients made up of 32 % and 16 % sucrose solutions, and centrifuged at 100,000 x g. The discrete band formed at the 16-32 % interface was collected and centrifuged further at 100,000 x g. The resulting pellet was resuspended in the transport buffer described above and quantified using the DC protein assay (Bio-Rad, Hercules, CA).
Vesicle transport assay
ATP dependent transport of [3H]LTC4 was measured by rapid filtration through nitrocellulose filters (Millipore, Billerica, MA). Vesicles (8 μg) were incubated with 5 mM ATP or similar concentration of NaCl with 10 mM MgCl2, 100 μg/ml creatine phosphokinase, 10 mM phosphocreatine, and 50 nM [3H]LTC4 (20 nCi) in transport buffer at 37 °C. Final incubation volume was 100 μl. After incubation, the reaction was stopped with 900 μl of an ice-cold buffer containing 300 mM sucrose, 10 mM Hepes/Tris pH 7.5, and 20 mM KCl, filtered through the nitrocellulose filters, and further washed with 4 ml of this wash buffer. After addition of 4 ml of OptiFluor (Perkin Elmer, Boston, MA), radioactivity associated with the filters was determined by liquid scintillation counting using a Beckman Coulter scintillation counter LS6500 (Fullerton, CA).
Plasma membrane integrity
Plasma membrane integrity was assessed by two methods: lactate dehydrogenase (LDH) release [31], and by propidium iodide exclusion as measured by flow cytometry. LDH release was expressed as a percentage of total LDH activity (lysed untreated cells), which was measured in cells lysed with 0.5% Triton X-100.
Phosphatidylserine externalization
At specified timepoints after treatment, cells were stained with Annexin V-APC and propidium iodide in KH buffer containing 2.5 mM CaCl2. Cells were analyzed for propidium iodide exclusion and increases in Annexin V-APC staining using a Becton Dickinson FACSCalibur flow cytometer (Franklin Lakes, NJ) at the University of Rochester Flow Cytometry Core. Data were analyzed using Cell Quest software, gating out propidium iodide positive cells and including Annexin V positive cells for phosphatidylserine externalization.
Caspase 3-like activity
The caspase 3-like activity assay is based on one provided by BD PharMingen. Briefly, cells were placed in cell lysis buffer (10 mM Tris-HCl, 10 mM NaH2PO4/NaHPO4 pH 7.5, 130 mM NaCl, 1% Triton X-100, and 10 mM sodium pyrophosphate) and frozen at -80°C until activity assay. Cell lysates were thawed and centrifuged at 18,000 x g for 15 min at 4°C. The supernatants were then combined with 1X HEPES buffer (20 mM HEPES pH 7.5, 10% glycerol, and 2 mM DTT) and 30 μM Ac-DEVD-AMC. Caspase 3-like activity was measured as a change in fluorescence over 20 min using a SPECRTAmax Gemini XS spectrofluorometer (Molecular Devices Corporation, Sunnyvale, CA) at 37°C.
DNA fragmentation
Cells were analyzed for a subG1 population which corresponds to cells with fragmented DNA using flow cytometry. At appropriate times, treated cells were trypsinized and centrifuged at 200 x g for 7 min. The supernatant was removed and cells fixed in 70% ethanol and stored at 4°C, until staining. For staining, cells were centrifuged at 200 x g for 7 min, the supernatant removed and the pellet resuspended in 1 mg/ml RNase A in 1 X PBS. Cells were vortexed and incubated for 30 min at room temperature. After the incubation period, cells were centrifuged again at 200 x g for 7 min and resuspended in 20 μg/ml PI solution. Flow cytometry was performed on a Becton Dickinson FACSCalibur flow cytometer (Franklin Lakes, NJ) at the University of Rochester Flow Cytometry Core.
Statistical analysis
Statistical analysis was performed using Statview 5 (SAS Institute Inc., Cary, NC). Data were analyzed using one-way ANOVA and Fisher’s PLSD posthoc analyses. In all cases p values of less than 0.05 were considered statistically significant.
Results
HEK293 cells overexpressing MRP1 demonstrate increased transport of LTC4 and calcein
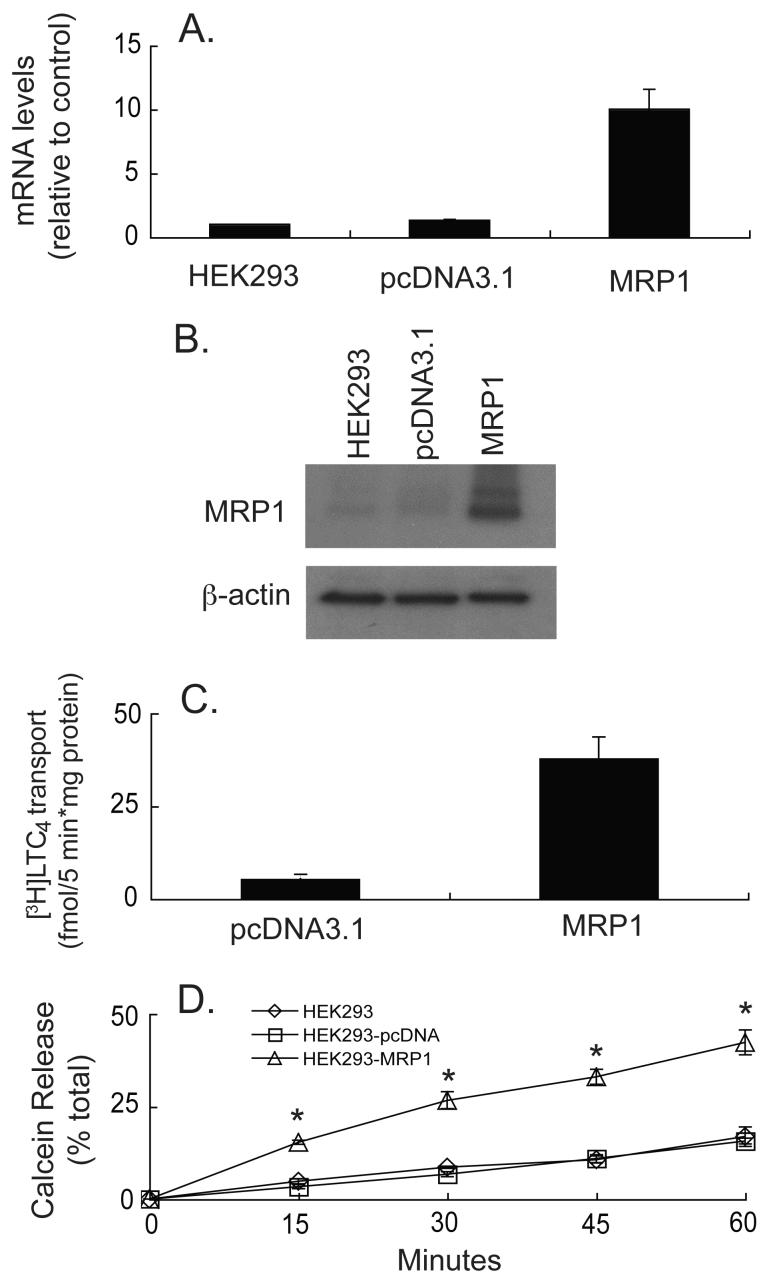
HEK293 cells and the empty vector transfected cells contained low levels of MRP1 mRNA and protein (Figure 1). Several MRP1-overexpressing clones were obtained and tested, including one in which MRP1 expression was approximately 10-fold higher than in control cells (Figure 1A). Protein expression, as determined by western blotting, corroborated the RNA data (Figure 1B).
Fig. 1.
MRP1 mRNA and protein expression, and functional activity in transfected HEK293 cells. (A) Real time RT-PCR was performed on HEK293 cells transfected with human MRP1 together with vector-transfected (pcDNA3.1) or parental cells (HEK293). MRP1 levels were normalized to human β-actin and data are expressed as fold change relative to control (HEK293 cells). Values are means ± SE, n = 6. (B) Western blot for human MRP1 protein expression (10 μg of protein was loaded for each sample). Blotting for human β-actin was done to ensure consistent protein loading. Blot is representative example of three experiments. (C) Membrane vesicles (8 μg protein) isolated from vector-transfected or MRP1-overexpressing HEK293 cells were incubated with 50 nM [3H]LTC4 with or without 5 mM ATP for 5 min. The ATP dependent uptake of [3H]LTC4 was determined. Data represent means ± SE, n = 3. * Significantly different from vector-transfected cells, P < 0.05. (D) Parental, vector-transfected, and cells transfected with MRP1 were incubated for 1 hour with 1 μM calcein-AM at 4°C and percent of total calcein release was determined over 60 min. Values are means ± SE, n = 3. * Significantly different from control cells, P < 0.05.
To test whether the expressed MRP1 protein was functional, transport activity of LTC4 and calcein were determined. LTC4 is a glutathione S-conjugate and a substrate for MRP1 [32-34], and previous studies have shown that calcein is a substrate for the MRP transporters [35, 36]. Membrane vesicles from the MRP1-overexpressing cells exhibited increased [3H]LTC4 transport activity (Figure 1C) indicating the presence of functional transporters. Of significance, calcein release in the MRP1-overexpressing cells was enhanced approximately 2 to 3 fold, indicating the presence of functional transporters at the plasma membrane (Figure 1D). Total calcein (intracellular + extracellular) was constant throughout the experiment and was similar among the different transfectants (data not shown), indicating that the changes in calcein export observed were not due to insufficient loading of calcein-AM.
MRP1-overexpressing HEK293 cells have lower intracellular GSH levels and higher basal GSH export rates
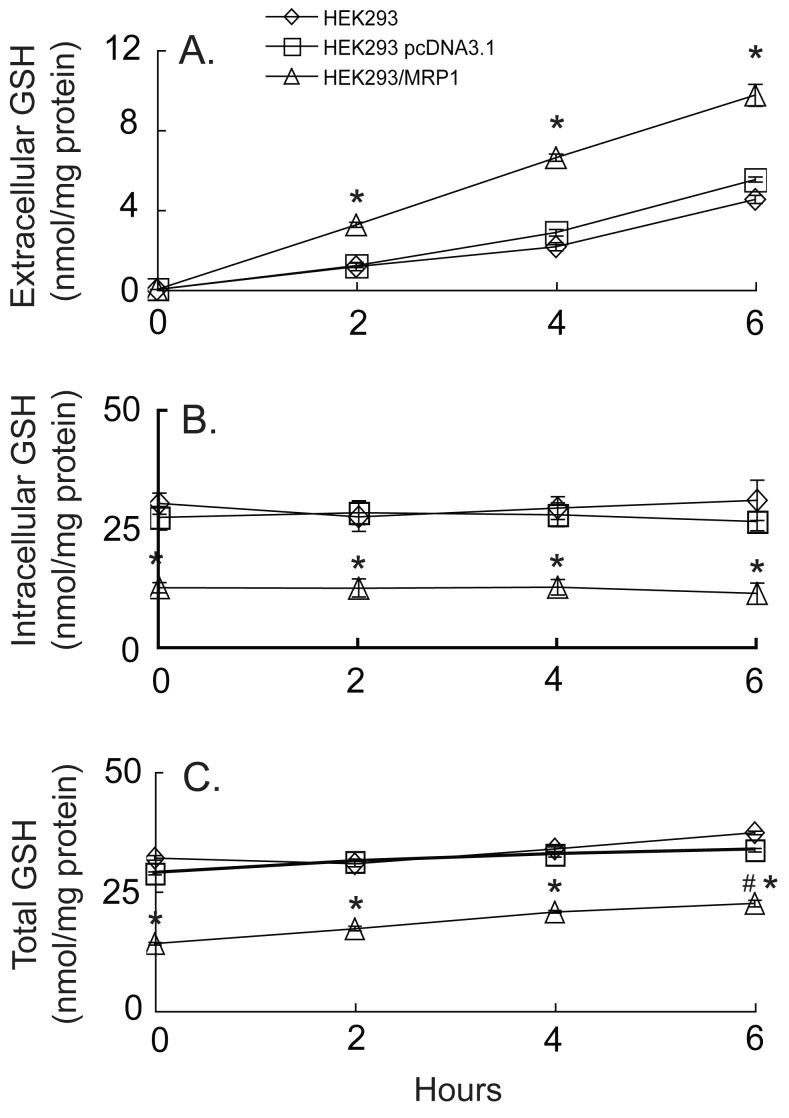
The parental and empty vector-transfected cells released GSH relatively slowly over time, consistent with the low basal MRP1 expression in these cells, whereas MRP1-overexpressing cells released GSH at twice the rate of control cells (Figure 2A). LDH release was low for all cells suggesting that GSH release was not due to a compromised plasma membrane (data not shown). HEK293-MRP1 cells also had less than half of the intracellular GSH found in the control cells (Figure 2B). Despite the high rate of GSH efflux, the intracellular levels in the MRP1-overexpressing cells remained constant over the 6 hours (Figure 2B), suggesting that the GSH synthesis rate may be increased. Indeed, total GSH (i.e. extracellular plus intracellular) significantly increased over time in the HEK293-MRP1 cells, but remained relatively constant in the other cells (Figure 2C).
Fig. 2.
HEK293 cells overexpressing MRP1 release significantly greater quantities of GSH when compared to parental or vector-transfected cells. Extracellular (A), intracellular (B), and total (i.e., extracellular plus intracellular) (C) GSH levels were measured in parental, vector-transfected or MRP1-overexpressing cells over 6 h. Values are means ± SE, n = 3-6. * Significantly different from control cells, P < 0.05. # Significantly different from time 0, P < 0.05.
Staurosporine and Fas antibody/cycloheximide (CHX) enhance GSH release, and this is especially prominent in the MRP1-transfected cells
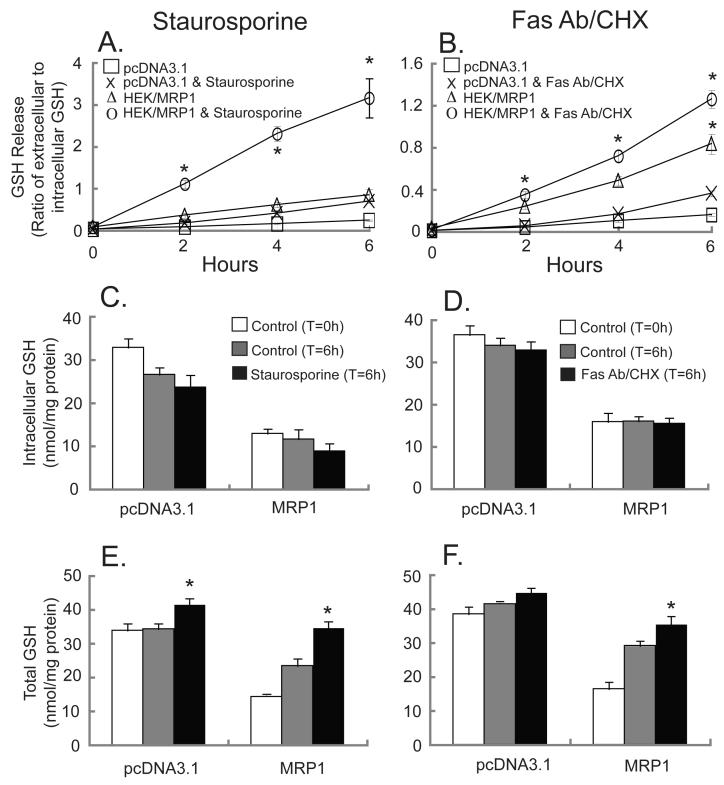
When treated with staurosporine or Fas antibody/cycloheximide (CHX), GSH release was increased in both the control and in the MRP1-overexpressing cells (Figures 3A and 3B, respectively). At these doses of staurosporine and Fas antibody/CHX intracellular GSH levels were unaffected, although there was a downward trend (Figures 3C and 3D). However, both apoptotic stimuli increased the total amount of GSH (i.e., intracellular plus extracellular GSH) in both vector- and MRP1-transfected cell lines, with the most striking increase observed in HEK293-MRP1 cells (Figures 3E and 3F). As previously noted in figure 2, intracellular GSH levels in the HEK293-MRP1 cells were less than half of those of the vector-transfected cells without apoptotic stimuli (Figures 3C and 3D). At six hours after the apoptotic stimulus, total GSH (i.e. intracellular plus extracellular) in the MRP1-overexpressing cells was significantly higher, and both staurosporine and Fas antibody/CHX increased total GSH to such an extent that the levels were almost comparable to the GSH concentrations in the vector-transfected cells (Figures 3E and 3F).
Fig. 3.
Staurosporine or Fas Antibody/CHX significantly enhances GSH release from MRP1-overexpressing HEK293 cells. GSH release was measured in pcDNA3.1-, and MRP1-transfected cells (A, B). Cells were untreated (□,Δ) or treated with 10 μM staurosporine (x,○) (A,C,E) or with 0.5 μg/ml Fas Antibody & 50 μg/ml CHX (x,○) (B,D,F) for up to 6 h. Intracellular GSH (C,D) and total GSH (E,F) at time 0 (white bars) or at 6 hours (grey or black bars), from either untreated cells (grey bars) or cells treated with 10 μM staurosporine (C,E) or 0.5 μg/ml Fas Antibody & 50 μg/ml CHX (D,F) (black bars). Values are means ± SE, n = 3-6. * Significantly different from control cells at 6 h, P < 0.05.
When treated with staurosporine or Fas antibody/CHX, caspase 3-like activity, DNA fragmentation, and phosphatidylserine externalization are elevated in vector-transfected cells, but to a lesser extent in the MRP1-overexpressing cells
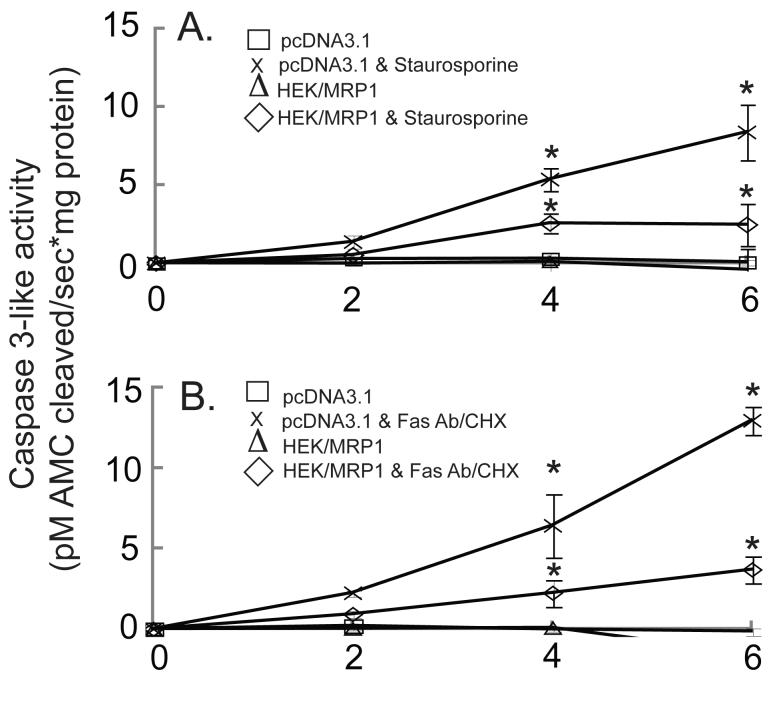
To determine whether the enhanced GSH release observed in the HEK293-MRP1 cells was associated with altered susceptibility to apoptosis, different apoptotic endpoints were measured. Staurosporine and Fas antibody/CHX increased caspase 3-like activity in vector- and MRP1-transfected cells, but the level of caspase 3 activation in the HEK293-MRP1 cells was approximately half of that observed in the vector-transfected cells (Figure 4). Another MRP1 clone with comparable levels of MRP1 mRNA and protein was also examined for GSH levels and caspase 3 activation giving similar results (data not shown). The reason for the decreased caspase activation despite the enhanced GSH release and the lower intracellular GSH levels in the HEK293-MRP1 cells is unclear, but may be due to an enhanced rate of GSH synthesis observed in the HEK293-MRP1 cells, as suggested by the increase in total GSH (Figures 2 and 3).
Fig. 4.
Activation of caspase 3-like proteases in MRP1-overexpressing cells treated with staurosporine or Fas Antibody/CHX is significantly lower than in vector- transfected HEK293 cells. pcDNA3.1- and MRP1-transfected HEK293 cells were untreated (□,Δ) or treated with 10 μM staurosporine (x,◇) (A), or treated with 0.5 μg/ml Fas Antibody & 50 μg/ml CHX (x,◇) (B), for up to 6 h. Values are means ± SE, n = 3-5. * Significantly different from control cells, P < 0.05.
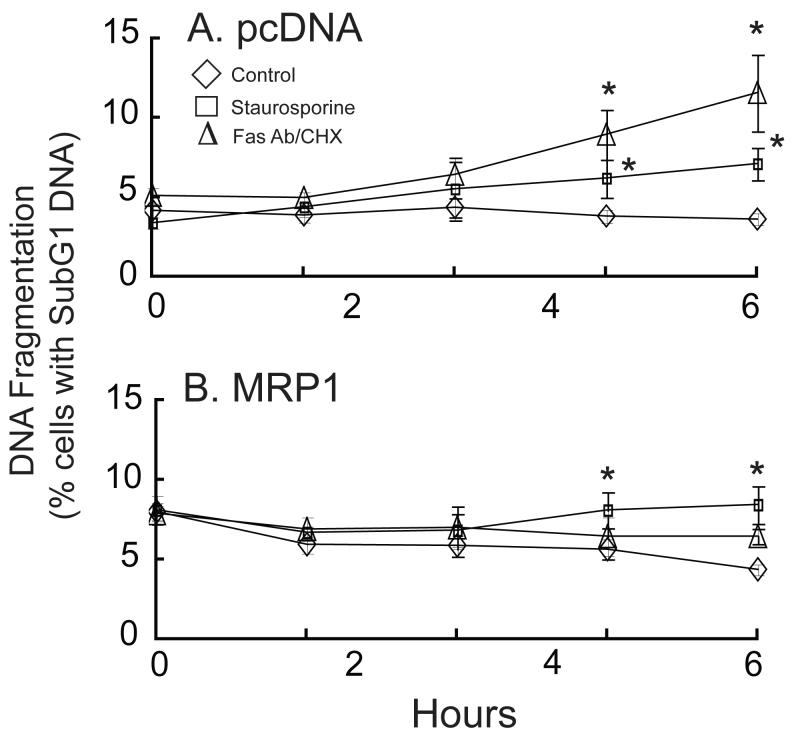
DNA fragmentation, a late marker of apoptosis, was determined by measuring the percentage of cells with subG1 DNA content. In agreement with the caspase 3 activity data, the percentage of cells with subG1 DNA content increased in the vector-transfected cells treated with staurosporine or Fas antibody/CHX (Figure 5A), but a smaller effect was noted in the MRP1-overexpressing cells (Figure 5B). The percentage of cells with subG1 DNA at time zero was higher in the MRP1-overexpressing cells (Figure 5B), but the significance of this is unknown. Because of this high percentage of MRP1-transfected cells with subG1 DNA at time zero, the difference in subG1 content between untreated and treated cells is less in the HEK293-MRP1 cells when compared to the vector-transfected cells (Figure 5).
Fig. 5.
Staurosporine and Fas antibody/CHX significantly increase the percentage of cells with subG1 DNA content in vector-transfected cells, and to a lesser extent in MRP1-transfected cells. pcDNA3.1 (A) and pcDNA3.1/MRP1-(B) transfected cells were untreated (◇) or treated with 10 μM staurosporine (□) or with 0.5 μg/ml Fas Antibody & 50 μg/ml CHX (Δ) for up to 12 h. Values are means ± SE, n = 4. * Significantly different from untreated cells, P < 0.05.
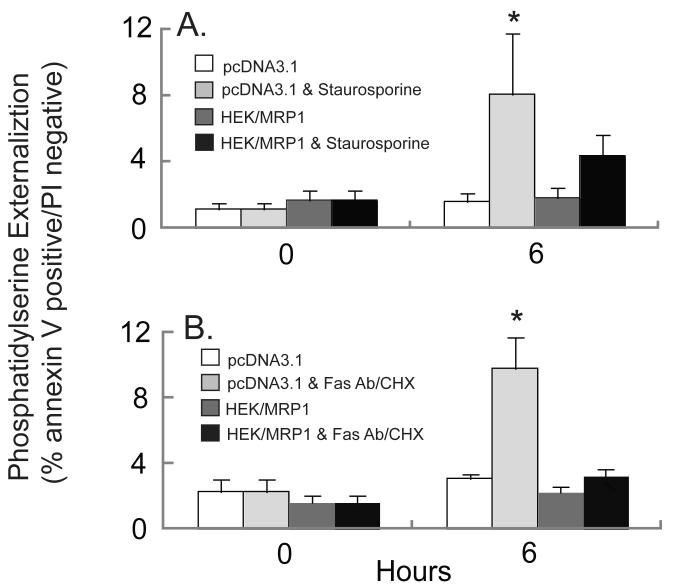
To determine the effect of MRP1 expression on phosphatidylserine externalization during apoptosis, HEK293-MRP1 and vector-transfected HEK293 cells were treated with staurosporine or Fas antibody/CHX, and phosphatidylserine on the extracellular membrane was assessed by labeling with fluorescently tagged Annexin V. Cells were also stained with propidium iodide to determine plasma membrane integrity. Staurosporine and Fas antibody/CHX significantly increased phosphatidylserine externalization in vector-transfected cells, but no significant increase in phosphatidylserine externalization was observed in the MRP1-overexpressing cells (Figure 6). These data corroborate the results obtained from the caspase 3 activity and DNA fragmentation assays, and collectively suggest that the MRP1-overexpressing cells exhibit decreased sensitivity to apoptosis.
Fig. 6.
Staurosporine-induced or Fas antibody/CHX-mediated increase in phosphatidylserine externalization is lower in MRP1-overexpressing cells. pcDNA3.1 transfected cells were untreated (white bars) or treated with apoptotic inducing agent (light grey bars). HEK293-MRP1 cells were untreated (dark grey bars) or treated with apoptosis inducing agent (black bars). Cells were analyzed for the percentage that were Annexin V positive and propidium iodide negative when treated with 10 μM staurosporine (A) or with 0.5 μg/ml Fas Antibody & 50 μg/ml CHX (B) for up to 6 h. Values are means ± SE, n = 3-5. * Significantly different from control cells, P < 0.05.
Vincristine stimulates GSH export in HEK293-MRP1 cells
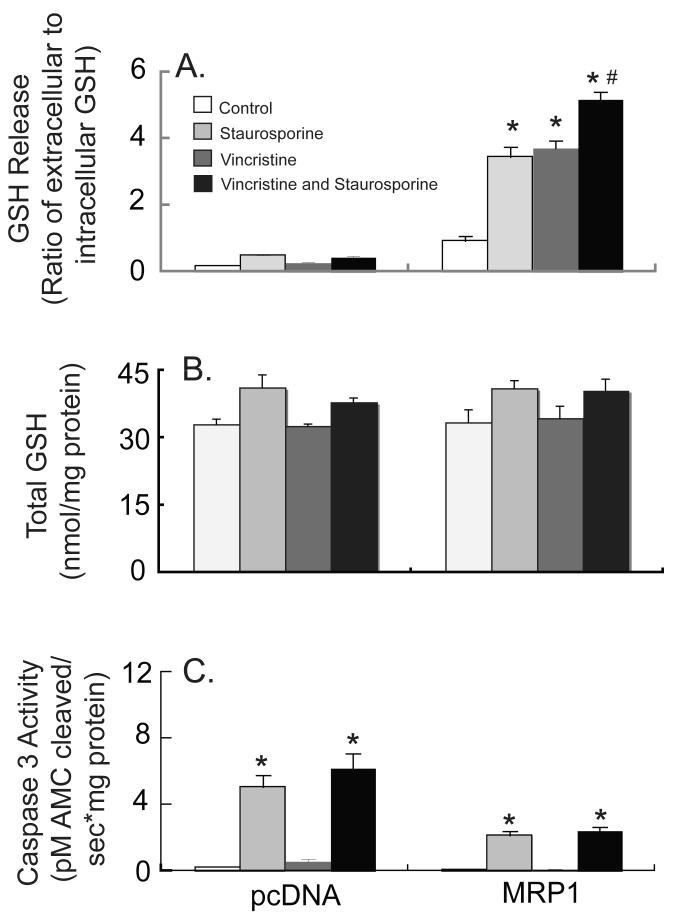
Vincristine, a compound known to be co-transported with GSH via the MRP proteins [37, 38], was used to further enhance GSH release in these cells. Vincristine significantly increased both basal and apoptotic GSH release in HEK293-MRP1 cells, but not in the vector-transfected cells (Figure 7A). In addition, vincristine by itself or in combination with staurosporine or Fas antibody/CHX did not further increase caspase 3 activity in the vector-transfected cells (Figure 7C). Total GSH (i.e., intracellular plus extracellular GSH) was unaffected (Figure 7B). Thus, in agreement with the results presented above, the HEK293-MRP1 cells are relatively resistant to apoptosis.
Fig. 7.
Vincristine enhances basal and staurosporine-induced GSH release in MRP1-overexpressing HEK293 cells. pcDNA3.1-, and MRP1-transfected HEK293 cells were untreated (vehicle), treated with 10 μM staurosporine, 50 μM vincristine, or both staurosporine and vincristine for 6 h. GSH release (A) and caspase 3-like activity (B) were measured. Values are means ± SE, n = 3. * Significantly different from control cells, P < 0.05. # Significantly different from staurosporine-only treatment, P < 0.05.
Discussion
The present study demonstrates that MRP1 is an effective mediator of both basal and apoptotic GSH export. Basal GSH efflux increased significantly in the MRP1-overexpressing cells, implicating MRP1 as an important mediator of basal GSH release, and extending previous observations in other cell lines [13, 15, 39]. Because of the enhanced basal GSH export in the HEK293-MRP1 cells, steady state intracellular GSH levels were significantly lower in these cells (Figures 2A and 2B). Interestingly, when placed in KH buffer, intracellular GSH levels did not decrease over time in the HEK293-MRP1 cells despite the enhanced efflux, which is corroborated by the increase in total GSH over time, suggesting increased GSH synthesis. Because GSH synthesis is regulated via feedback inhibition [40], the high GSH export rate in the HEK293-MRP1 cells may stimulate GSH synthesis in an attempt to replenish and maintain intracellular levels. An upregulation of GSH synthesis was also previously noted in Fly-eco fibrosarcoma cells overexpressing MRP1 [41].
Enhanced GSH release during apoptotic cell death has been previously observed [3, 4, 6], and recent work from our laboratory has implicated the MRP transporters, and in particular MRP1, in this process [4]. To further examine the role of MRP1 in apoptotic GSH release, HEK293-MRP1 cells were treated with staurosporine or Fas antibody/CHX to induce apoptosis. The results indicate that the MRP1 overexpressing cells had significantly higher levels of GSH release, supporting the role of MRP1 in GSH export during apoptosis.
Paradoxically, despite the high GSH export and low intracellular GSH levels in the MRP1-overexpressing cells, these cells were more resistant to apoptosis. It is now well established that enhanced GSH release, with a concurrent depletion of intracellular GSH levels, is important for the progression of apoptosis [2, 4, 42]. Stimulating GSH release in baby hamster kidney-21 (BHK) cells overexpressing MRP1 with verapamil enhances phosphatidylserine externalization and caspase activation [19], whereas inhibiting GSH export reduces or slows down the appearance of apoptotic endpoints [2, 4]. The present results demonstrate that HEK293-MRP1 cells had approximately 50% of the caspase 3 activity as the vector-transfected cells (Figure 4). Further stimulation of GSH export with vincristine, a compound co-transported with GSH by the MRPs [37, 38], did not increase caspase activation in HEK293-MRP1 cells (Figure 7). In addition to low caspase activation, DNA fragmentation and phosphatidylserine externalization were significantly lower in the HEK293-MRP1 cells compared with vector-transfected cells (Figures 5 and 6). Because effector caspases, such as caspase 3, are involved in the activation of downstream proteins in the apoptotic pathways, it is not surprising that other apoptotic endpoints were not altered. For instance, ICAD, an inhibitor of caspase activated DNase (CAD), is cleaved by caspase 3 thus releasing CAD which migrates to the nucleus and cleaves DNA [43, 44]. The increase in DNA fragmentation is a later event compared to the activation of caspase 3 as observed in the vector-transfected cells (Figure 5A) and is lower in the MRP1-overexpressing cells (Figure 5B).
These data suggest that enhanced GSH release on its own is not sufficient to increase apoptosis in HEK293 cells overexpressing MRP1, but that a concurrent decrease in intracellular levels is also required. These findings provide insight into previous studies that reported that treatment of cells with compounds that stimulate GSH release is sufficient to induce cell death [18, 19]. Intracellular GSH levels were not depleted in the HEK293-MRP1 cells treated with staurosporine or Fas antibody/CHX despite elevated GSH release. This significant increase in total GSH over time in the MRP1-overexpressing cells (Figures 3 and 7) suggests that there is an increase in GSH synthesis as the cells try to compensate for the loss of GSH. An increase in GSH synthesis has been observed in the highly metastatic B16 melanoma F10 (B16-F10) cell line when treated with agents that deplete GSH in an effort to induce cell death [45]. B16-F10 cells have high levels of intracellular GSH, and when stimulated to release GSH using verapamil or Bcl-2 antisense oligonucleotides they exhibit an increase in γglutamylcysteine synthetase (γ-GCS) activity and GSH levels [45]. One possible explanation for the increase in GSH synthesis is that the loss of GSH increases the amount of reactive oxygen species in the cells which have been suggested to induce transcription of both the heavy and light subunits of γ-GCS by the transcription factor Nrf2 [46, 47]. Additionally, if cells use reactive oxygen species or changes in the redox state of proteins as signaling mechanisms in apoptotic pathways, an increase in the de novo synthesis of reduced GSH may prevent or attenuate these signals, slowing the progression of apoptosis and providing resistance to cell death.
Additionally, apoptotic endpoints measured in the vector-transfected HEK293 cells were not as high or did not occur as rapidly as previously observed in Jurkat cells when treated with Fas antibody or staurosporine [4]. Jurkat cells release a significantly greater quantity of GSH with a concurrent depletion of intracellular GSH when treated with either apoptotic agents [4]. Therefore, longer treatment of the vector-transfected HEK293 cells with the apoptotic agents may result in greater loss of intracellular GSH release and increased apoptosis.
Overall, the present results provide additional direct evidence that MRP1 is an effective mediator of GSH release under basal conditions, and during both death receptor-mediated and chemically-induced apoptosis. In addition, the results indicate that enhanced cellular GSH release with a concurrent decrease of intracellular GSH appears to be necessary for the progression of apoptosis.
Acknowledgements
This work was supported in part by National Institutes of Health (NIH) Grants DK48823 and DK067214, and National Institute of Environmental Health Sciences Center Grant ES01247 and Training Grant ES07026. We thank Suzanne Krance for all her advice on this project.
References
- [1].Ghibelli L, Coppola S, Rotilio G, Lafavia E, Maresca V, Ciriolo MR. Nonoxidative loss of glutathione in apoptosis via GSH extrusion. Biochem Biophys Res Commun. 1995;216:313–320. doi: 10.1006/bbrc.1995.2626. [DOI] [PubMed] [Google Scholar]
- [2].Ghibelli L, Fanelli C, Rotilio G, Lafavia E, Coppola S, Colussi C, Civitareale P, Ciriolo MR. Rescue of cells from apoptosis by inhibition of active GSH extrusion. Faseb J. 1998;12:479–486. doi: 10.1096/fasebj.12.6.479. [DOI] [PubMed] [Google Scholar]
- [3].Hammond CL, Madejczyk MS, Ballatori N. Activation of plasma membrane reduced glutathione transport in death receptor apoptosis of HepG2 cells. Toxicol Appl Pharmacol. 2004;195:12–22. doi: 10.1016/j.taap.2003.10.008. [DOI] [PubMed] [Google Scholar]
- [4].Hammond CL, Marchan R, Krance SM, Ballatori N. Glutathione export during apoptosis requires functional multidrug resistance-associated proteins. J Biol Chem. 2007;282:14337–14347. doi: 10.1074/jbc.M611019200. [DOI] [PubMed] [Google Scholar]
- [5].He YY, Huang JL, Ramirez DC, Chignell CF. Role of reduced glutathione efflux in apoptosis of immortalized human keratinocytes induced by UVA. J Biol Chem. 2003;278:8058–8064. doi: 10.1074/jbc.M207781200. [DOI] [PubMed] [Google Scholar]
- [6].van den Dobbelsteen DJ, Nobel CS, Schlegel J, Cotgreave IA, Orrenius S, Slater AF. Rapid and specific efflux of reduced glutathione during apoptosis induced by anti-Fas/APO-1 antibody. J Biol Chem. 1996;271:15420–15427. doi: 10.1074/jbc.271.26.15420. [DOI] [PubMed] [Google Scholar]
- [7].Coppola S, Ghibelli L. GSH extrusion and and the mitochondrial pathway of apoptotic signalling. Biochem Soc Trans. 2000;28:56–61. doi: 10.1042/bst0280056. [DOI] [PubMed] [Google Scholar]
- [8].Hammond CL, Lee TK, Ballatori N. Novel roles for glutathione in gene expression, cell death, and membrane transport of organic solutes. J Hepatol. 2001;34:946–954. doi: 10.1016/s0168-8278(01)00037-x. [DOI] [PubMed] [Google Scholar]
- [9].Ballatori N, Hammond CL, Cunningham JB, Krance SM, Marchan R. Molecular mechanisms of reduced glutathione transport: role of the MRP/CFTR/ABCC and OATP/SLC21A families of membrane proteins. Toxicol Appl Pharmacol. 2005;204:238–255. doi: 10.1016/j.taap.2004.09.008. [DOI] [PubMed] [Google Scholar]
- [10].Cole SP, Deeley RG. Transport of glutathione and glutathione conjugates by MRP1. Trends Pharmacol Sci. 2006;27:438–446. doi: 10.1016/j.tips.2006.06.008. [DOI] [PubMed] [Google Scholar]
- [11].Lautier D, Canitrot Y, Deeley RG, Cole SP. Multidrug resistance mediated by the multidrug resistance protein (MRP) gene. Biochem Pharmacol. 1996;52:967–977. doi: 10.1016/0006-2952(96)00450-9. [DOI] [PubMed] [Google Scholar]
- [12].Mao Q, Deeley RG, Cole SP. Functional reconstitution of substrate transport by purified multidrug resistance protein MRP1 (ABCC1) in phospholipid vesicles. J Biol Chem. 2000;275:34166–34172. doi: 10.1074/jbc.M004584200. [DOI] [PubMed] [Google Scholar]
- [13].Paulusma CC, van Geer MA, Evers R, Heijn M, Ottenhoff R, Borst P, Elferink R.P. Oude. Canalicular multispecific organic anion transporter/multidrug resistance protein 2 mediates low-affinity transport of reduced glutathione. Biochem J. 1999;338(Pt 2):393–401. [PMC free article] [PubMed] [Google Scholar]
- [14].Wortelboer HM, Usta M, van der Velde AE, Boersma MG, Spenkelink B, van Zanden JJ, Rietjens IM, van Bladeren PJ, Cnubben NH. Interplay between MRP inhibition and metabolism of MRP inhibitors: the case of curcumin. Chem Res Toxicol. 2003;16:1642–1651. doi: 10.1021/tx034101x. [DOI] [PubMed] [Google Scholar]
- [15].Zaman GJ, Lankelma J, van Tellingen O, Beijnen J, Dekker H, Paulusma C, Elferink R.P. Oude, Baas F, Borst P. Role of glutathione in the export of compounds from cells by the multidrug-resistance-associated protein. Proc Natl Acad Sci U S A. 1995;92:7690–7694. doi: 10.1073/pnas.92.17.7690. [DOI] [PMC free article] [PubMed] [Google Scholar]
- [16].Lorico A, Rappa G, Finch RA, Yang D, Flavell RA, Sartorelli AC. Disruption of the murine MRP (multidrug resistance protein) gene leads to increased sensitivity to etoposide (VP-16) and increased levels of glutathione. Cancer Res. 1997;57:5238–5242. [PubMed] [Google Scholar]
- [17].Wijnholds J, Evers R, van Leusden MR, Mol CA, Zaman GJ, Mayer U, Beijnen JH, van der Valk M, Krimpenfort P, Borst P. Increased sensitivity to anticancer drugs and decreased inflammatory response in mice lacking the multidrug resistance-associated protein. Nat Med. 1997;3:1275–1279. doi: 10.1038/nm1197-1275. [DOI] [PubMed] [Google Scholar]
- [18].Trompier D, Chang XB, Barattin R, D’Hardemare A. du Moulinet, Di Pietro A, Baubichon-Cortay H. Verapamil and its derivative trigger apoptosis through glutathione extrusion by multidrug resistance protein MRP1. Cancer Res. 2004;64:4950–4956. doi: 10.1158/0008-5472.CAN-04-0143. [DOI] [PubMed] [Google Scholar]
- [19].Laberge RM, Karwatsky J, Lincoln MC, Leimanis ML, Georges E. Modulation of GSH levels in ABCC1 expressing tumor cells triggers apoptosis through oxidative stress. Biochem Pharmacol. 2007;73:1727–1737. doi: 10.1016/j.bcp.2007.02.005. [DOI] [PubMed] [Google Scholar]
- [20].Li L, Lee TK, Meier PJ, Ballatori N. Identification of glutathione as a driving force and leukotriene C4 as a substrate for oatp1, the hepatic sinusoidal organic solute transporter. J Biol Chem. 1998;273:16184–16191. doi: 10.1074/jbc.273.26.16184. [DOI] [PubMed] [Google Scholar]
- [21].Li L, Meier PJ, Ballatori N. Oatp2 mediates bidirectional organic solute transport: a role for intracellular glutathione. Mol Pharmacol. 2000;58:335–340. doi: 10.1124/mol.58.2.335. [DOI] [PubMed] [Google Scholar]
- [22].Briz O, Romero MR, Martinez-Becerra P, Macias RI, Perez MJ, Jimenez F, Martin F.G. San, Marin JJ. OATP8/1B3-mediated cotransport of bile acids and glutathione: an export pathway for organic anions from hepatocytes? J Biol Chem. 2006;281:30326–30335. doi: 10.1074/jbc.M602048200. [DOI] [PubMed] [Google Scholar]
- [23].Franco R, Cidlowski JA. SLCO/OATP-like transport of glutathione in FasL-induced apoptosis: glutathione efflux is coupled to an organic anion exchange and is necessary for the progression of the execution phase of apoptosis. J Biol Chem. 2006;281:29542–29557. doi: 10.1074/jbc.M602500200. [DOI] [PubMed] [Google Scholar]
- [24].Franco R, Panayiotidis MI, Cidlowski JA. Glutathione depletion is necessary for apoptosis in lymphoid cells independent of reactive oxygen species formation. J Biol Chem. 2007;282:30452–30465. doi: 10.1074/jbc.M703091200. [DOI] [PMC free article] [PubMed] [Google Scholar]
- [25].Mahagita C, Grassl SM, Piyachaturawat P, Ballatori N. Human organic anion transporter 1B1 and 1B3 function as bidirectional carriers and do not mediate GSH-bile acid cotransport. Am J Physiol Gastrointest Liver Physiol. 2007;293:G271–278. doi: 10.1152/ajpgi.00075.2007. [DOI] [PubMed] [Google Scholar]
- [26].Craddock AL, Love MW, Daniel RW, Kirby LC, Walters HC, Wong MH, Dawson PA. Expression and transport properties of the human ileal and renal sodium-dependent bile acid transporter. Am J Physiol. 1998;274:G157–169. doi: 10.1152/ajpgi.1998.274.1.G157. [DOI] [PubMed] [Google Scholar]
- [27].Griffith OW. Determination of glutathione and glutathione disulfide using glutathione reductase and 2-vinylpyridine. Anal Biochem. 1980;106:207–212. doi: 10.1016/0003-2697(80)90139-6. [DOI] [PubMed] [Google Scholar]
- [28].Lowry OH, Rosebrough NJ, Farr AL, Randall RJ. Protein measurement with the Folin phenol reagent. J Biol Chem. 1951;193:265–275. [PubMed] [Google Scholar]
- [29].Blitzer BL, Donovan CB. A new method for the rapid isolation of basolateral plasma membrane vesicles from rat liver. Characterization, validation, and bile acid transport studies. J Biol Chem. 1984;259:9295–9301. [PubMed] [Google Scholar]
- [30].Smith DJ, Ploch SA. Isolation of Raja erinacea basolateral liver plasma membranes: characterization of lipid composition and fluidity. J Exp Zool. 1991;258:189–195. doi: 10.1002/jez.1402580208. [DOI] [PubMed] [Google Scholar]
- [31].Vassault A. Lactate Dehydrogenase UV method with pyruvate and NADH. In: Bergmeyer HV, editor. Methods of Enzymatic Analysis. Vol. 3. Verlag Chemie; 1983. pp. 118–126. [Google Scholar]
- [32].Huber M, Guhlmann A, Jansen PL, Keppler D. Hereditary defect of hepatobiliary cysteinyl leukotriene elimination in mutant rats with defective hepatic anion excretion. Hepatology. 1987;7:224–228. doi: 10.1002/hep.1840070204. [DOI] [PubMed] [Google Scholar]
- [33].Jedlitschky G, Leier I, Buchholz U, Center M, Keppler D. ATP-dependent transport of glutathione S-conjugates by the multidrug resistance-associated protein. Cancer Res. 1994;54:4833–4836. [PubMed] [Google Scholar]
- [34].Leier I, Jedlitschky G, Buchholz U, Cole SP, Deeley RG, Keppler D. The MRP gene encodes an ATP-dependent export pump for leukotriene C4 and structurally related conjugates. J Biol Chem. 1994;269:27807–27810. [PubMed] [Google Scholar]
- [35].Feller N, Broxterman HJ, Wahrer DC, Pinedo HM. ATP-dependent efflux of calcein by the multidrug resistance protein (MRP): no inhibition by intracellular glutathione depletion. FEBS Lett. 1995;368:385–388. doi: 10.1016/0014-5793(95)00677-2. [DOI] [PubMed] [Google Scholar]
- [36].Versantvoort CH, Bagrij T, Wright KA, Twentyman PR. On the relationship between the probenecid-sensitive transport of daunorubicin or calcein and the glutathione status of cells overexpressing the multidrug resistance-associated protein (MRP) Int J Cancer. 1995;63:855–862. doi: 10.1002/ijc.2910630617. [DOI] [PubMed] [Google Scholar]
- [37].Loe DW, Almquist KC, Deeley RG, Cole SP. Multidrug resistance protein (MRP)-mediated transport of leukotriene C4 and chemotherapeutic agents in membrane vesicles. Demonstration of glutathione-dependent vincristine transport. J Biol Chem. 1996;271:9675–9682. doi: 10.1074/jbc.271.16.9675. [DOI] [PubMed] [Google Scholar]
- [38].Loe DW, Deeley RG, Cole SP. Characterization of vincristine transport by the M(r) 190,000 multidrug resistance protein (MRP): evidence for cotransport with reduced glutathione. Cancer Res. 1998;58:5130–5136. [PubMed] [Google Scholar]
- [39].Watts RN, Hawkins C, Ponka P, Richardson DR. Nitrogen monoxide (NO)-mediated iron release from cells is linked to NO-induced glutathione efflux via multidrug resistance-associated protein 1. Proc Natl Acad Sci U S A. 2006;103:7670–7675. doi: 10.1073/pnas.0602515103. [DOI] [PMC free article] [PubMed] [Google Scholar]
- [40].Meister A, Anderson ME. Glutathione. Annu Rev Biochem. 1983;52:711–760. doi: 10.1146/annurev.bi.52.070183.003431. [DOI] [PubMed] [Google Scholar]
- [41].Rappa G, Gamcsik MP, Mitina RL, Baum C, Fodstad O, Lorico A. Retroviral transfer of MRP1 and gamma-glutamyl cysteine synthetase modulates cell sensitivity to L-buthionine-S,R-sulphoximine (BSO): new rationale for the use of BSO in cancer therapy. Eur J Cancer. 2003;39:120–128. doi: 10.1016/s0959-8049(02)00447-1. [DOI] [PubMed] [Google Scholar]
- [42].Friesen C, Kiess Y, Debatin KM. A critical role of glutathione in determining apoptosis sensitivity and resistance in leukemia cells. Cell Death Differ. 2004 doi: 10.1038/sj.cdd.4401431. [DOI] [PubMed] [Google Scholar]
- [43].Enari M, Sakahira H, Yokoyama H, Okawa K, Iwamatsu A, Nagata S. A caspase-activated DNase that degrades DNA during apoptosis, and its inhibitor ICAD. Nature. 1998;391:43–50. doi: 10.1038/34112. [DOI] [PubMed] [Google Scholar]
- [44].Sakahira H, Enari M, Nagata S. Cleavage of CAD inhibitor in CAD activation and DNA degradation during apoptosis. Nature. 1998;391:96–99. doi: 10.1038/34214. [DOI] [PubMed] [Google Scholar]
- [45].Benlloch M, Ortega A, Ferrer P, Segarra R, Obrador E, Asensi M, Carretero J, Estrela JM. Acceleration of glutathione efflux and inhibition of gamma-glutamyltranspeptidase sensitize metastatic B16 melanoma cells to endothelium-induced cytotoxicity. J Biol Chem. 2005;280:6950–6959. doi: 10.1074/jbc.M408531200. [DOI] [PubMed] [Google Scholar]
- [46].Ding Y, Choi KJ, Kim JH, Han X, Piao Y, Jeong JH, Choe W, Kang I, Ha J, Forman HJ, Lee J, Yoon KS, Kim SS. Endogenous Hydrogen Peroxide Regulates Glutathione Redox via Nuclear Factor Erythroid 2-Related Factor 2 Downstream of Phosphatidylinositol 3-Kinase during Muscle Differentiation. Am J Pathol. 2008;172:1529–1541. doi: 10.2353/ajpath.2008.070429. [DOI] [PMC free article] [PubMed] [Google Scholar]
- [47].Lu SC. Regulation of hepatic glutathione synthesis: current concepts and controversies. Faseb J. 1999;13:1169–1183. [PubMed] [Google Scholar]


