

Abstract
Movement, deformation, and partitioning of mammalian red blood cells (RBCs) in diverging microvessel bifurcations are simulated using a two-dimensional, flexible-particle model. A set of viscoelastic elements represents the RBC membrane and the cytoplasm. Motion of isolated cells is considered, neglecting cell-to-cell interactions. Center-of-mass trajectories deviate from background flow streamlines due to migration of flexible cells towards the mother vessel centerline upstream of the bifurcation and due to flow perturbations caused by cell obstruction in the neighborhood of the bifurcation. RBC partitioning in the bifurcation is predicted by determining the RBC fraction entering each branch, for a given partition of total flow and for a given upstream distribution of RBCs. Typically, RBCs preferentially enter the higher-flow branch, leading to unequal discharge hematocrits in the downstream branches. This effect is increased by migration toward the centerline but decreased by the effects of obstruction. It is stronger for flexible cells than for rigid circular particles of corresponding size, and decreases with increasing parent vessel diameter. For unequally-sized daughter vessels, partitioning is asymmetric, with RBCs tending to enter the smaller vessel. Partitioning is not significantly affected by branching angles. Model predictions are consistent with previous experimental results.
Keywords: microvessel, bifurcation, erythrocyte mechanics, capillary flow, phase separation
INTRODUCTION
Nonuniform partitioning of hematocrit at diverging vessel bifurcations is responsible for the heterogeneous discharge hematocrit distribution that is seen in the microvasculature17. Nonuniform hematocrit distribution, in turn, affects the microvascular oxygen distribution, the effective viscosity of blood in microvessels15, and the distribution of other metabolites. To aid understanding and quantification of microvascular transport in normal and disease states, a more thorough understanding of RBC partitioning in diverging microvascular bifurcations is desirable.
Schmid-Schönbein et al.17 performed some of the earliest experiments that quantified RBC partitioning. Blood flow was filmed in nine rabbit ear capillary bifurcations (diameters ∼ 5-15 μm) while the bulk blood flow through the daughter branches was changed by pressing on veins near the bifurcations. Functions were presented that gave the dependence of the approximate fractions of RBC flux in the two daughter branches (Φ1,2) on the fractions of bulk blood flux into those branches (ψ1,2) for three bifurcations. The results suggested that the upstream hematocrit distribution at a small diverging bifurcation plays a significant role in RBC partitioning.
Pries et al.11 observed sixty-five arteriolar bifurcations (diameters ∼ 10-30 μm) in rat mesentery, with average discharge hematocrit 20% to 55%. They identified several important parameters that affect the fraction of RBC flux entering a branch: the fraction of bulk blood flux entering that branch, the ratio of the two daughter vessel diameters, the size of the mother vessel, and the upstream hematocrit distribution. They also constructed a function of those parameters that gives an estimate of the RBC flux into the two daughter branches of a bifurcation. This function was later adjusted14 to give reasonable results for extreme hematocrit and vessel diameter ratios. This adjusted function is used here for comparisons.
Enden and Popel4 used numerical methods to approximate the Stokes flow in a bifurcating geometry. Assuming that RBC trajectories coincide with fluid streamlines, they produced results consistent with the Pries et al.11 experiments, for large vessel diameters (25 μm)5. However, Audet and Olbricht2 showed that in small vessels, circular particles with diameters comparable to the vessel diameter could experience significant drift across background fluid streamlines. Similarly, Secomb and El-Kareh3 found that spherical caps approaching a cylinder (representing the flow divider of a bifurcation) can drift across fluid streamlines. Particle deformability can lead to lateral drift of particles in shear flows9. These studies illustrate a need to examine this potential drift if a more accurate understanding of RBC partitioning in small vessels is to be obtained.
Here, a computational model of flexible two-dimensional RBCs18 is used to identify the mechanical effects underlying the tendency of RBCs to drift, or migrate, across underlying fluid streamlines in small vessel bifurcations (6-13 μm). Effects of particle deformability are examined by comparing the results with those obtained in corresponding simulations using rigid particles. The results are used to predict RBC partitioning in small vessel bifurcations and its dependence on mother vessel size, ratio of daughter diameters, daughter branching angles, and cell deformability.
METHODS
The model describes the motion of a cell in a surrounding Stokes flow as it moves in a rigid vessel in two dimensions. The constraint of constant cell volume that would apply in the three-dimensional case is represented by an effective internal pressure18. A single cell in a bifurcation is considered and effects of cell-to-cell interactions are excluded. Nodes are located along the perimeter of the RBC, with an additional internal node, as shown in Fig. 1a. The outer line segments (external elements) are viscoelastic, and represent a planar cross-section of a RBC membrane that possesses shear elasticity, bending elasticity, and in-plane viscosity. The segments connecting the central node to the outer nodes (internal elements) are viscous and are included to represent cytoplasmic and out-of-plane membrane deformation18.
Figure 1.
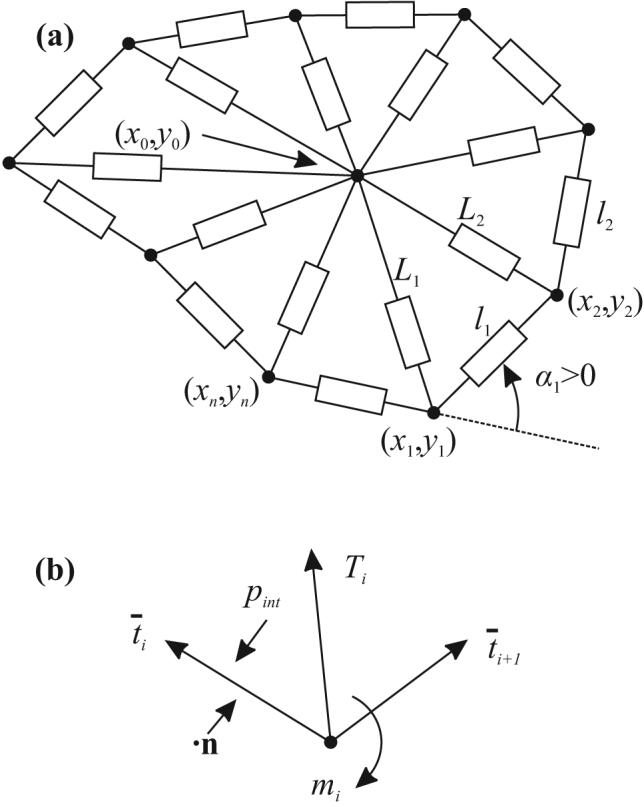
(a) Schematic view of the two-dimensional model for a RBC. Rectangles denote viscoelastic/viscous elements of variable length, connected at the nodes. (b) Stresses and moments acting on node i.
The outer nodes are numbered from 1 to n and the ith node has coordinates xi = (xi,yi). The central node has coordinates x0 = (x0,y0). An external element and the quantities associated with it are denoted by i when the element's endpoints are (xi,yi) and (xi+1,yi+1). The ith internal element has as its endpoints (x0,y0) and (xi,yi).
The average tension in external element i is given by
| (1) |
where li is the length of the ith external element, l0 = 0.97 μm is a reference length, kt = 0.012 dyn/cm is the elastic modulus, and μm = 2×10⁻⁴ dyn s/cm is the viscosity of the external elements18. The bending moment acting on the ith node (xi,yi) is
| (2) |
Here kb = 9×10⁻¹² dyn cm is the bending modulus at the nodes18 and αi is the angle between two consecutive external elements (Fig. 1a). The factor l0 converts αi to a curvature. The internal elements are assumed to have viscous resistance to changes in length,
| (3) |
where Li is the length of the ith internal element, μ′m = 1×10⁻⁴ dyn s/cm is the viscosity of the internal elements18 and Ti is the tension in internal element i.
The fluid inside of the cell is assumed to exert a constant internal pressure on the membrane,
| (4) |
where A is the area of the cell cross-section, Aref = 22.2 μm2 is a reference area and kp = 50 dyn/cm2. RBC volume preservation and surface area preservation lead to approximately constant cross-sectional area in three-dimensional RBCs, and a relatively large value of kp is assumed, to represent that property. Aref and l0 are chosen so that cells develop non-circular shapes with area Aref and perimeter nl0. All parameter values are taken from18. (The values for μm and μ′m are incorrectly stated in18. The actual values used there are as stated here.)
Balancing the tensions and moments at each node with the fluid forces impinging on the external elements and balancing all viscous forces at the central node yields a system of 2(n+1) linear equations in the nodal velocities ui = (ui,vi) and u0 = (u0,v0). This system includes unknown terms dependent on the surrounding flow 18. For comparison, simulations were also made for rigid circular particles. The translational velocity ur = (ur,vr) and angular velocity ωr are determined by requiring zero total force and moment on the particle.
The plasma is assumed to be a viscous, incompressible fluid governed by the Stokes equations. The equation for conservation of momentum is
| (5) |
Here p is the pressure, u is the velocity, σ is the stress tensor, and μ = 10−2 dyn s/cm2 is the viscosity. The incompressibility condition is replaced by the equation
| (6) |
Using the stiffness parameter K = 100 ensures that ▽ ·u ≈ 018.
The velocity of a point on an external element of a flexible particle is assumed to be given by linear interpolation between the nodal velocities at the ends of the element. The velocities on rigid particles are given by uedge = ur + ωrRt where t is the vector tangential to the edge and R is the radius of the circular-particle. These velocities must match the adjacent fluid velocity (no-slip condition).
Fig. 2a shows an example of vessel bifurcation geometry. At the entrance to the mother vessel, constant pressure and Neumann conditions for u are specified. At exits of the daughter branches, the gradients of p and the values of u are prescribed, corresponding to Poiseuille flow with the specified flow rates. The fraction of bulk blood flow into daughter branch 1 is ψ1 = Q1/Q0. The effect on flow rate of a RBC blocking a daughter vessel is assumed negligible, as the flow resistance created by a single cell in the daughter branch is small compared to the total resistance of the vessel downstream of the bifurcation. On the vessel wall, Neumann conditions for p and no-slip conditions for u are imposed. The main geometric and flow parameters are indicated in Figure 2(a). The radii of the circular arcs that link the vessel walls in the bifurcation are set to r1 = r2 = r0 = 3 μm. The length of each vessel is Lv0 = Lv1 = Lv2 = 5w0/2, unless otherwise stated. The branching angles are β1 and β2. The ratio of daughter vessel diameters is rd = w1/w2.
Figure 2.
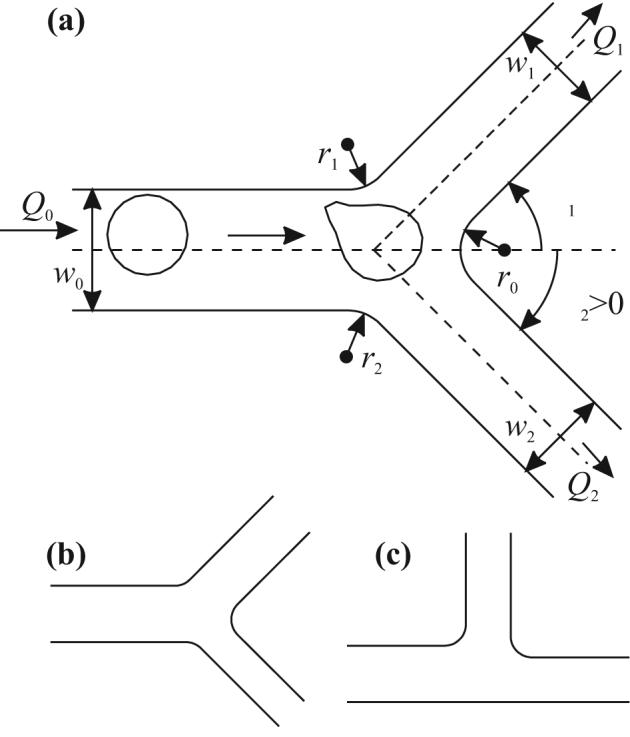
Bifurcation geometries used. (a) Symmetric bifurcation with β1 = β2 = π/4 and rd = w1/w2 = 1. (b) Bifurcation with asymmetric daughter vessel sizes; β1 = β2 = π/4 and rd = 3⅓ ≈ 1.44. (c) Bifurcation with asymmetric branching angles; β1 = π/2, β2 = 0, and rd = 1.
The dependence of RBC distribution on vessel size (w0), bulk blood distribution (ψ1), and vessel geometry (β1, β2, and rd) was investigated by varying these parameters. Arteriolar vessel diameters have been shown10 to approximately follow the relationship w03 = w13 + w23 at bifurcations. For given w0 and rd, this relationship determines the daughter vessel diameters. The total flow rate is assumed to be Q0 = 125w02 s−1, giving a mean flow velocity of 1 mm/s in an 8-μm mother vessel.
Unless otherwise specified, particle positions are initialized by setting x0 = −(15/8)w0. The initial y-coordinate y0 is selected from the interval [yb,yt] where yt = w0/2 − R − wCFL = −yb, to ensure that all points on the initial particle are at least a distance wCFL from the vessel wall, representing a cell-free layer. For flexible cells, a circle with center at (x0,y0) and initial radius R = 2.66 μm is discretized into n evenly spaced external nodes and one central node. This initial circular configuration is chosen to avoid biasing of the cell trajectory that might be caused by non-circular initial configurations. Rigid particles are modeled as smooth circles of radius R = 2.66 μm with centers at (x0,y0).
Given a particular vessel geometry (i.e., w0, β1, β2, and rd), boundary conditions (determined by the flow fraction ψ1), and the initial configuration of nodes representing the particle, a finite element solver is used to obtain the instantaneous velocities of the cell. The time-discretization employed is an explicit trapezoidal method of order 2. This solver is used to advance the nodal positions in time until either the cell is inside one of the daughter branches or the cell is within 0.1 μm of the far wall of the bifurcation and all its nodal velocities point towards the same daughter branch. A particle is considered to have entered the daughter branch if one of these conditions is satisfied. Further details on the numerical aspects are given in the Appendix.
The path of the particle's center of mass is defined as its particle streamline. For given vessel geometry and ψ1, a separating particle streamline, starting at y0 = yc(ψ1), separates particle streamlines that enter branch 1 from those that enter branch 2. If all such streamlines starting with y0 in the interval [yb,yt] enter one branch, the separating particle streamline is defined as the top or bottom such streamline. The separating particle streamline and the associated yc(ψ1) are obtained within a tolerance εbisection ≈ 0.05w0 using a bisection algorithm (see Appendix). The separating streamline of the underlying flow is also defined for each flow fraction.
The RBC flux into branch 1, as a fraction of the total RBC flux, is given by
| (7) |
Here s(y) is the density distribution of cell centers as they pass x = x0, assumed to be constant and ud(y) is the horizontal velocity distribution of the cell centers at x0, approximated by a quartic function (see Appendix).
RESULTS
Symmetric Bifurcations
Fig. 3a shows results for a flexible particle in a symmetric bifurcation, with ψ1 = 0.25, Q0 = 8 μm2/s, w0 = 8 μm, rd = 1, and y0 = 1.24 μm. The cell first transforms from an initial circular shape into an asymmetric shape that resembles observed shapes18. On reaching the flow divider between the two branches, the cell is deformed into a sandbag-like shape, which straddles the flow divider. Fig. 3b shows a similar shape observed in vivo.
Figure 3.
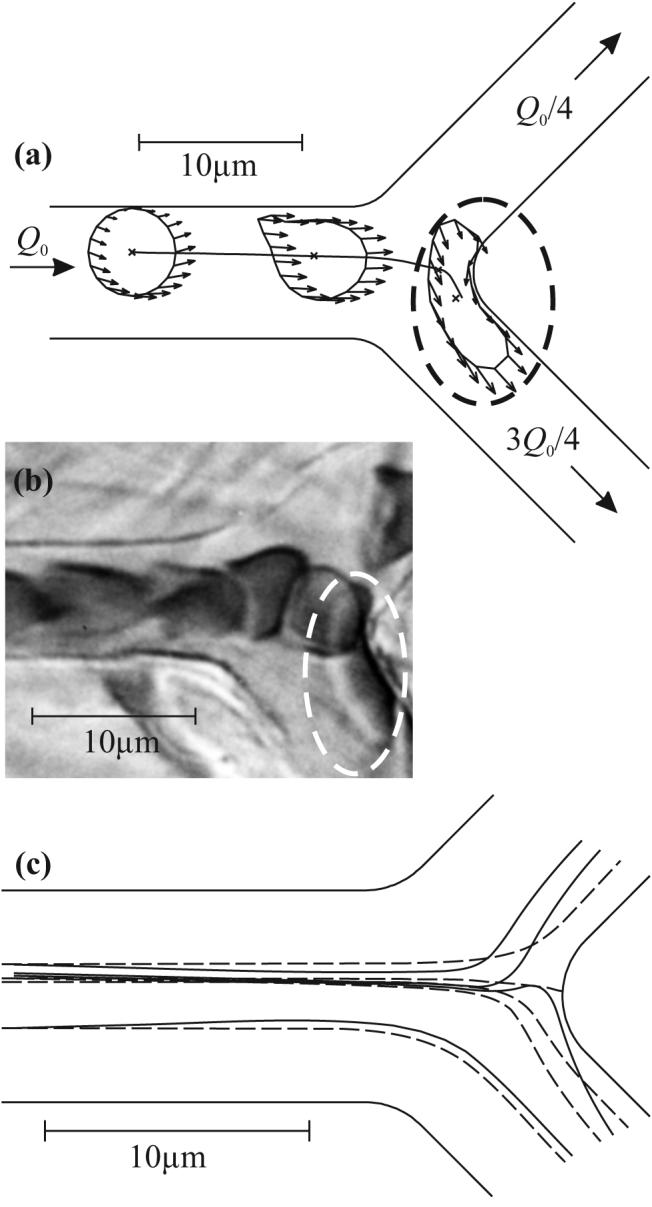
(a) Example of center-of-mass trajectory, computed cell shapes and individual nodal velocities (arrows). Here Q0 = 8 μm2/ms, w0 = 8 μm, ψ1 = ¼. Cell shapes are shown at t = 0, 10, and 30 ms. Dashed ellipse indicates cell in sandbag-like shape, adjacent to the flow divider. (b) Photomicrograph of RBCs in a capillary bifurcation in the rat mesentery13. Scale is as in (a). One cell (indicated by dashed ellipse) is deformed into a sandbag-like shape, corresponding to the computed shape in (a). (c) Computed cell (solid) and underlying fluid (dashed) streamlines for the same geometry and ψ1 = ¼. The dashed line that intersects the far wall of the bifurcation is the separating fluid streamline.
In Fig. 3c, flexible cell streamlines are compared with fluid streamlines from the underlying flow field for the same vessel geometry and ψ1. Comparing the outermost flexible cell streamlines with the outermost fluid streamlines reveals cell migration: the flexible cell streamlines tend towards the center of the mother vessel, upstream of the bifurcation. Comparing the inner cell streamlines with the inner fluid streamlines in the bifurcation region reveals that the cell streamlines can differ significantly from fluid streamlines in that region. In fact, one cell streamline enters branch 1 while a fluid streamline, which lies on this cell streamline at one point very near the bifurcation, enters branch 2.
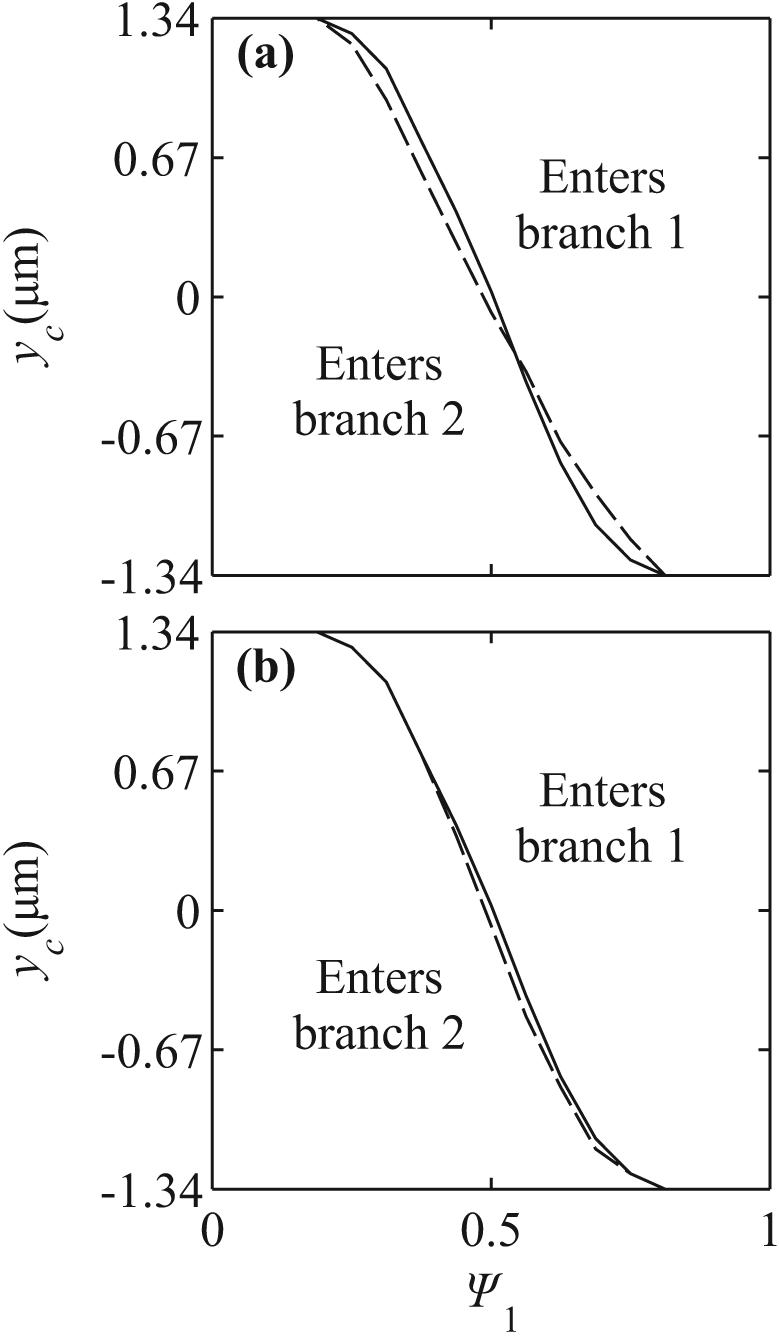
Figures 4a-c show the function yc(Ψ1) that defines the location of the separating streamline for flexible cells, rigid particles and the underlying fluid flow, for vessel geometries with w0 = 8 μm, 10.1 μm, and 12.7 μm. For Ψ1 < 0.5, the region above the curves (enters branch 1) is larger for rigid particles than for flexible cells, indicating that rigid particles tend to enter the low flow branch more than their flexible counterparts. The deviation between separating streamlines for particles and fluid separating streamlines is larger for rigid particles than for flexible cells, indicating that rigid particles deviate more than flexible cells from underlying streamlines. As the vessel size increases, the differences between flexible cell, rigid particle, and fluid separating streamlines become less significant.
Figure 4.

Separating streamlines and partitioning in symmetric bifurcations. (a,d) w0 = 8 μm. (b,e) w0 = 10.08 μm. (c,f) w0 = 12.80 μm. (a,b,c) Initial positions of cells corresponding to separating flexible cell streamlines (solid), initial positions corresponding to separating rigid particle streamlines (long dashed), and y-coordinate which the underlying separating fluid streamline (short dashed) passes through at x = x0. (d,e,f) Estimates for fractional RBC flux, Φ1, as a function of fractional blood flow rate, ψ1. The cell-free layers used for the rigid particle (long dashed) and flexible cell (solid) estimates are CFL = 0, 0.1 and 0.3 μm in (d,e,f). Short dashed lines are experimental estimates from14.
Estimates based on eq. (8) for the fractional RBC flux Φ1(Ψ1) are shown in Fig. 4d-f for rigid particles and flexible cells. In these plots, partition of red blood cells in proportion to flow rate would be represented by the diagonal line Φ1 = Ψ1. Phase separation is more pronounced for flexible cells than for rigid particles. The predicted curves depend on the assumed values of the parameter wCFL, representing the width of the cell free layer at the initial upstream position. This parameter cannot be directly estimated from experimental data. Here, the assumed values are wCFL = 0, 0.1 and 0.3 μm for geometries with w0 = 8, 10.0 and 12.80 μm. These values are chosen so that the value Ψ1 at which particles can enter branch 1 approximately corresponds to experimental values estimated from the empirical function14 extrapolated to zero hematocrit. With the assumed values of wCFL, predicted curves are consistent with experimental data.
Asymmetric bifurcations
Figure 5 shows results for a flexible particle in a symmetric bifurcation and an asymmetric bifurcation in which the daughter branches have widths 7.27 and 5.04 μm , with a diameter ratio of 1.44 (as in Fig. 2b) for w0 = 8 μm. The curves for the asymmetric case are shifted to the right, indicating an increased tendency to enter the smaller branch. Fig. 5c depicts the change in Φ1, together with the estimate derived from empirical results14, with qualitative agreement. The agreement is less close for larger vessel sizes (results not shown).
Figure 5.
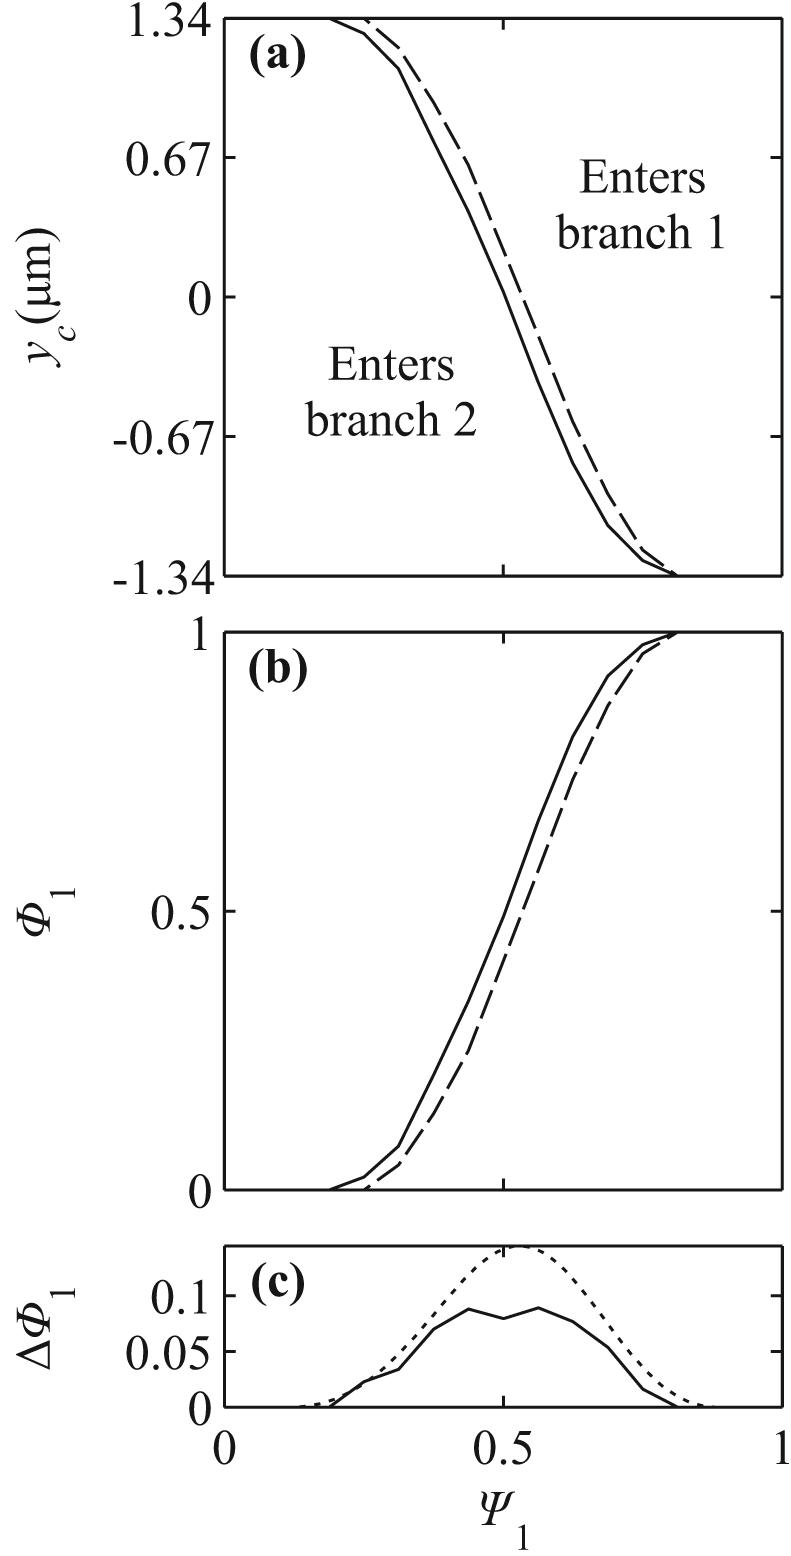
(a) Comparison of results for symmetric bifurcations (solid) and bifurcations with asymmetric vessel diameters (dashed) for w0 = 8 μm. Curves for the asymmetric bifurcation are shifted to the right. (b) Computed difference ΔΦ1 between results for symmetric and asymmetric cases (solid curve) and estimated from empirical function14 (dotted curve).
Fig. 6 shows results for a T bifurcation with equal daughter branch widths, as in Figure 2c, compared to the symmetric case. In figure 6a, the curve yc(Ψ1) is shallower for the T-bifurcation than for the symmetric case, but does not show a significant lateral shift, as would be expected if cells preferentially entered one of the branches. The length of the straight portion of the mother vessel is shorter in the T-bifurcation (13.8 μm) than in the symmetric case (18.3 μm). To correct for the effect of this difference on upstream lateral migration, the initial coordinate in the T-bifurcation was shifted from x0 = −15 μm to x0 = −20 μm. In figure 6b, the resulting yc(Ψ1) is compared with that for a symmetric bifurcation with x0 = −15 μm. The results do not differ significantly.
Figure 6.
Comparison of results from symmetric bifurcations (solid) with results from bifurcations with asymmetric branching angles (dashed). (a) Initial position x0 = −15 μm. (b) Initial position x0 = −20 μm in T-bifurcation, x0 = −15 μm in symmetric bifurcation.
DISCUSSION
Upstream hematocrit distribution
Partitioning of hematocrit in bifurcations depends on the upstream hematocrit distribution and the trajectories of individual RBCs. In this study, the upstream y-positions of cell centers approaching the bifurcation are assumed to be uniformly distributed in a region whose width is limited so that the distance of cell centers from the wall is at least the initial cell radius plus the width of an assumed cell free layer. In reality, the upstream hematocrit distribution is determined by several factors including the exclusion effect (centers of finite-size cells cannot reach the vessel wall), cell migration, cell-to-cell interactions, cell deformation, length of the mother vessel, and the presence of an endothelial surface layer or glycocalyx16. For any given hematocrit distribution, the partition function Φ1(Ψ1) can be deduced from yc(Ψ1) using eq. (7).
Particle deviation from fluid streamlines
If particles are small relative to the dimensions of the flow field, their trajectories closely follow the streamlines of the underlying flow. At low concentrations, the partition between the daughter branches is then fully determined by the upstream concentration distribution and the streamlines of the underlying flow field. A uniform upstream distribution leads to proportional partition of particles and fluid, whereas a narrow distribution allows the higher-flow branch to intercept a disproportionately large share of the particles. Particles of finite size relative to the flow domain may, however, deviate significantly from streamlines, affecting their partition between the branches. In the present results, two main causes for such deviations are evident: cell migration and daughter vessel obstruction.
In dilute suspension, RBCs tend to migrate toward the center-line of the vessel8,18. By narrowing the upstream concentration distribution, this migration increases the tendency of RBCs to enter the high flow branch. However, daughter vessel obstruction produces the opposite tendency. The factors influencing motion of rigid or slightly deformable particles in bifurcations were previously discussed by Fung6,7 in terms of distributions of shear and pressure forces acting on the particles. In the present case, in which the particles are highly deformable and the flow rates in the branches are held constant, the particle motion can more easily be understood by considering its position relative to the underlying flow field. Since the separating fluid streamline is closer to the low-flow branch than to the high-flow branch, a RBC entering the bifurcation region on this streamline intercepts a relatively large part of the flow entering the low-flow branch. If the part of the cell in the low-flow branch lags the mean flow velocity in that branch, continuity of flow requires increased fluid velocity in the small remaining gap between the cell and the wall, generating a pressure difference across the cell that tends to drag it into that branch. Conversely, the cell intercepts only a small part of the flow entering the high-flow branch, and so the pressure difference generated across that part of the cell is less sensitive to a discrepancy between the cell and mean flow velocities. The net effect of daughter vessel obstruction is thus a tendency for the cell to enter the low-flow branch.
Effects of flexibility
Rigid circular particles do not experience lateral migration in unidirectional Stokes flow. Therefore, they are subject only to the obstruction effect, out of the two effects described. In bifurcations, they tend to enter the low-flow branch (Figure 4a-c) even when the corresponding fluid streamline enters the high-flow branch, and show a relatively weak phase separation effect (Figure 4d-f). Flexible cells, however, migrate towards the centerline. They make smaller obstructions than rigid particles because they tend to flatten against the flow divider. In the smallest geometry considered, the effect of migration exceeds the obstruction effect, and cells may enter high flow branches even when their underlying fluid streamlines enter low flow branches. As vessel size increases, the trajectories of flexible cells tend towards those of rigid particles, because the flexible cells deform less and because the effects of obstruction diminish as cell size becomes smaller relative to the vessel size. In each case, however, flexible cells still experience more nonuniform partitioning than rigid particles.
Effects of asymmetry
If the daughter vessels are of different sizes, particles show an increased tendency to enter the smaller branch (Figure 5). Since the cell's size causes a larger relative obstruction in the smaller branch, cells more likely to be drawn into that branch. The results for asymmetric branching angles (Figure 6) indicate that such asymmetry has little effect on the partition of hematocrit. Inertial effects are absent in Stokes flow, and there is no a priori reason to expect that cells would tend to follow one or other branch. Figure 7 shows shapes of deformed cells within the T bifurcation. Some asymmetry in shape is evident as the cell approaches the flow divider, but this does not lead to significant asymmetry in the yc(Ψ1) curves.
Figure 7.
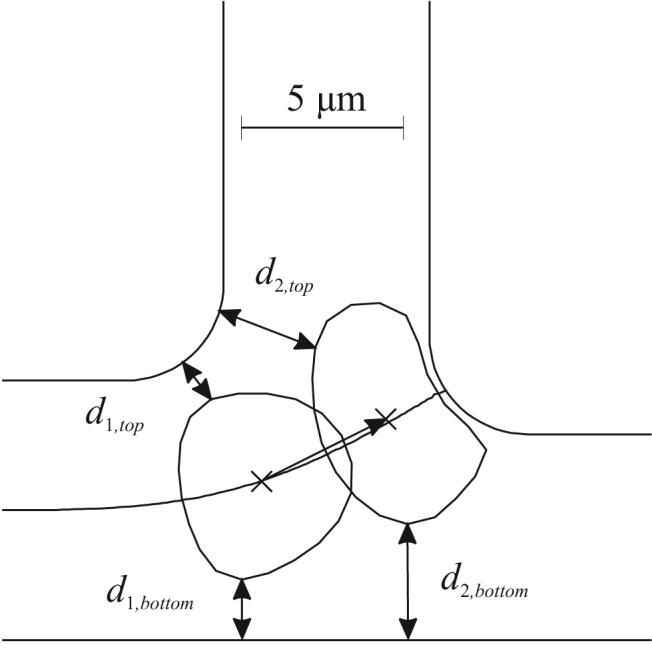
Computed RBC shapes in a T-bifurcation, showing asymmetry of fluid streamline (solid line) and of gaps on either side of the RBC.
Comparison with experimental data
Computed cell shapes in bifurcations show qualitative similarity with cell shapes observed in microvascular bifurcations, as for example shown in Figure 3b. The model results are consistent with experimental findings on hematocrit partition in bifurcations14. The extent of phase separation, as indicated by the difference between the function Φ1(Ψ1) and the line Φ1 = Ψ1, decreases with increasing parent vessel size. In the case of different daughter vessel diameters, cells tend to enter the smaller branch. Branching angle has little effect. The Φ1 - Ψ1 relationships obtained show similar trends to those obtained experimentally, as shown in Figure 4. However, a direct quantitative comparison is not possible because of the unknown upstream hematocrit distribution in vivo.
Model limitations
A two-dimensional model is used to simulate RBC motion and deformation. While this model has been developed to reproduce observed three-dimensional behaviors as closely as possible18, it has inevitable limitations. Some relevant quantities scale differently with mother vessel radius. For instance, the size of the relative obstruction scales as the inverse square of the daughter vessel radii in three dimensions but as the inverse in two dimensions. The obstruction effect may therefore be exaggerated in this model.
The results reported here neglect cell-to-cell interactions, and correspond to a low hematocrit. Under these conditions, RBCs migrate toward the center-line, and the upstream distribution of cells depends on the initial conditions and distance traveled (as in Figure 6). At finite hematocrits, cell-to-cell interactions oppose this migration, and broaden the hematocrit distribution. Pries et al.11 showed that the phase separation effect decreased with increasing hematocrit. The method described here is suitable for the simulating the motion of multiple interacting RBCs in bifurcations, and also for predicting the effects of the endothelial surface layer16 that is present in vivo.
Summary
To a first approximation, RBCs follow underlying fluid streamlines in bifurcations, but significant deviations from those streamlines can occur because of cell migration and obstruction effects. Cell migration tends to increase the fraction of cells entering high flow branches whereas cell obstruction of daughter vessel entryways has the opposite effect. These results show that the mechanical properties of red blood cells influence the hematocrit distribution in microvascular networks, and thereby affect physiologically relevant parameters including mean intravascular hematocrit12 and RBC transit time through vascular beds.
ACKNOWLEDGMENTS
This work was supported by NIH grants HL034555 and HL07249, DOE Grant DEFG0202ER25533, NSF Grant DMS-0602173 (VIGRE) and the ARCS Foundation.
APPENDIX
Finite elements are used to express equations (5-6) as a system of linear equations. This system is coupled with the 2(n+1) equations arising from the force and moment balances for each node and the appropriate boundary conditions. The coupled linear system is solved to obtain the instantaneous velocities of the nodes on the cell. The finite element package FlexPDE (version 5.0.19) was used. In the simulations, the RBC membrane is discretized using n = 20 nodes. Between 100 and 400 fluid elements are used. The finite element package uses adaptive meshing to resolve narrow gaps between cells and walls, according to a user-specified tolerance. On a 1.66 GHz processor machine, computing the instantaneous velocities takes 10-20s.
Given cell nodal positions at time tn, the nodal positions at some subsequent time tn+1 = tn + dt are found using an explicit trapezoidal, order-2 method1. In this scheme, the instantaneous velocities, , are obtained using the finite element package (superscript corresponds to time tn). The nodal positions at time tn+1 are predicted using a forward Euler estimate:
| (8a) |
These new nodal positions are used to obtain the instantaneous velocities of the cell nodes at time tn+1. The final estimates of the nodal positions at time tn+1 are given by:
| (8b) |
A time step of 1 ms was found to give numerical stability as well as good convergence, whereas the forward Euler method required a time step of around 0.2 ms for convergence. Generating a cell trajectory with the given method and time step usually takes 10-40 min on a 1.66 GHz processor machine.
To find yc for a given vessel geometry and Ψ1 using a bisection algorithm, quantities ybelow and yabove are found such that yc is in the interval [ybelow, yabove]. The particle trajectory for (ybelow+yabove)/2 is then found, and the interval is halved, so that yc is in the new interval. The algorithm is repeated until the size of the interval was less than εbisection = 0.05w0. The midpoint of this final interval is then used as an estimate for yc; εbisection can be viewed as an estimate of the error on this yc. If a particle starting within .05 μm of either the top or bottom mother vessel wall enters branch 1 or branch 2 (respectively), all cells are presumed to enter only one branch and yc(Ψ1) is taken as yt or yb, as appropriate.
To compute the upstream particle velocity profile, the instantaneous velocities of circular particles placed at nine locations across the channel are computed. The arithmetic average of the external node velocities is fitted with a quartic function (r2 > .98) to obtain an estimate for ud(y), for use in eq. (7).
REFERENCES
- 1.Ascher UM, Petzold LR. Computer Methods for Ordinary Differential Equations and Differential-Algebraic Equations. Society for Industrial and Applied Mathematics; Philadelphia: 1998. pp. 73–82. [Google Scholar]
- 2.Audet DM, Olbricht WL. The motion of model cells at capillary bifurcations. Microvasc.Res. 1987;33:377–396. doi: 10.1016/0026-2862(87)90029-x. [DOI] [PubMed] [Google Scholar]
- 3.El-Kareh AW, Secomb TW. A model for red blood cell motion in bifurcating microvessels. International Journal of Multiphase Flow. 2000;26:1545–1564. [Google Scholar]
- 4.Enden G, Popel AS. A numerical study of the shape of the surface separating flow into branches in microvascular bifurcations. J.Biomech.Eng. 1992;114:398–405. doi: 10.1115/1.2891401. [DOI] [PubMed] [Google Scholar]
- 5.Enden G, Popel AS. A numerical study of plasma skimming in small vascular bifurcations. J.Biomech.Eng. 1994;116:79–88. doi: 10.1115/1.2895708. [DOI] [PubMed] [Google Scholar]
- 6.Fung YC. Stochastic flow in capillary blood vessels. Microvasc.Res. 1973;5:34–48. doi: 10.1016/s0026-2862(73)80005-6. [DOI] [PubMed] [Google Scholar]
- 7.Fung YC. Biodynamics: Circulation: Chapter 5: Microcirculation. Springer-verlag; New York: 1984. The Velocity-Hematocrit Relationship; pp. 241–249. [Google Scholar]
- 8.Goldsmith HL. Red cell motions and wall interactions in tube flow. Fed.Proc. 1971;30:1578–1590. [PubMed] [Google Scholar]
- 9.Leal LG. Particle Motions in A Viscous-Fluid. Annual Review of Fluid Mechanics. 1980;12:435–476. [Google Scholar]
- 10.Mayrovitz HN, Roy J. Microvascular blood flow: evidence indicating a cubic dependence on arteriolar diameter. Am.J.Physiol. 1983;245:H1031–H1038. doi: 10.1152/ajpheart.1983.245.6.H1031. [DOI] [PubMed] [Google Scholar]
- 11.Pries AR, Ley K, Claassen M, Gaehtgens P. Red cell distribution at microvascular bifurcations. Microvasc.Res. 1989;38:81–101. doi: 10.1016/0026-2862(89)90018-6. [DOI] [PubMed] [Google Scholar]
- 12.Pries AR, Ley K, Gaehtgens P. Generalization of the Fahraeus principle for microvessel networks. Am.J.Physiol. 1986;251:H1324–H1332. doi: 10.1152/ajpheart.1986.251.6.H1324. [DOI] [PubMed] [Google Scholar]
- 13.Pries AR, Secomb TW. Blood Flow in Microvascular Networks. In: Tuma RF, Ley K, Duran WN, editors. Handbook of Physiology: Section 2: The Cardiovascular System, Vol. 4. Microcirculation. 2008. In Press. [Google Scholar]
- 14.Pries AR, Secomb TW. Microvascular blood viscosity in vivo and the endothelial surface layer. Am J Physiol Heart Circ Physiol. 2005;289:H2657–H2664. doi: 10.1152/ajpheart.00297.2005. [DOI] [PubMed] [Google Scholar]
- 15.Pries AR, Secomb TW, Gaehtgens P. Biophysical aspects of blood flow in the microvasculature. Cardiovasc.Res. 1996;32:654–667. [PubMed] [Google Scholar]
- 16.Pries AR, Secomb TW, Gaehtgens P. The endothelial surface layer. Pflugers Arch. 2000;440:653–666. doi: 10.1007/s004240000307. [DOI] [PubMed] [Google Scholar]
- 17.Schmid-Schonbein GW, Skalak R, Usami S, Chien S. Cell distribution in capillary networks. Microvasc.Res. 1980;19:18–44. doi: 10.1016/0026-2862(80)90082-5. [DOI] [PubMed] [Google Scholar]
- 18.Secomb TW, Styp-Rekowska B, Pries AR. Two-dimensional simulation of red blood cell deformation and lateral migration in microvessels. Ann.Biomed.Eng. 2007;35:755–765. doi: 10.1007/s10439-007-9275-0. [DOI] [PubMed] [Google Scholar]