

Abstract
Alcohol “sensitivity” has been proposed as a predictive factor for development of alcohol dependence (Schuckit et al., 2005). Most measures of alcohol sensitivity in humans and animals include a component which can be ascribed to acute functional tolerance (AFT). AFT is a form of tolerance that develops within a single period of alcohol exposure and has a genetic component. We used microarray technology, and quantitative trait locus analysis of phenotypic and gene expression data across 30 BXD RI strains of mice, 20 inbred strains of mice, and two replicate lines of mice selectively bred for differences in AFT, to identify differentially expressed candidate genes contributing to predisposition to AFT. Eight candidate genes were identified by our statistical and filtering methods. The location of brain expression of these genes was mapped using the Allen Brain Atlas and the transcript location and molecular pathway analysis indicated that brain structures and biochemical pathways implicated in long term potentiation (LTP) and memory may also participate in the generation of acute functional alcohol tolerance.
Introduction
The term ethanol (alcohol) tolerance refers to a decreased behavioral response to a given dose of alcohol after prior experience with alcohol, or the need for a greater dose of ethanol to produce a given level of effect. Alcohol tolerance is an important diagnostic criterion for alcohol dependence in the Diagnostic and Statistical Manual of Mental Disorders (DSM-IV) (American Psychiatric Association, 1994).
Functional (pharmacodynamic) alcohol tolerance manifests itself in three different forms: chronic (Tabakoff et al., 1986), rapid (Khanna et al., 2002), or acute (Mellanby, 1919). Acute functional tolerance (AFT) refers to the tolerance that is manifest during a single session of alcohol drinking (Mellanby, 1919), and can start to develop within minutes after one starts to imbibe alcohol. The phenomenon of AFT was initially described by Mellanby through experiments which showed that humans display a greater degree of intoxication at a given blood alcohol concentration on the rising phase of the blood alcohol curve than at the same alcohol concentration on the falling phase of the blood alcohol curve (Mellanby, 1919). Acute functional alcohol tolerance is a neuronal resistance to alcohol effects (Tabakoff et al., 1986); however, its molecular mechanism is still not well characterized.
Sons of alcoholics (SOA) are three to five times more likely to develop alcohol dependence than sons of nonalcoholics (SONA) (Cotton, 1979). SOA also display less alcohol intoxication when measurements are made at least one hour after drinking alcohol. The low level of response to alcohol has been found to predict future alcohol dependence (Schuckit et al., 2005), and both men and women with no prior history of alcohol dependence, but with a positive family history of alcohol dependence, display a lower response to alcohol than those with no family history of alcohol dependence (Schuckit et al., 2005). Newlin and Thomson (1990) reviewed numerous studies and concluded that many of the measures of response to alcohol could be attributed to more rapid development of acute functional tolerance in the SOA subjects. This suggests that AFT makes an important contribution to measures of the level of response to alcohol as reported by Schuckit et al. (2005) and may be a predictor for development of alcohol dependence.
AFT to the locomotor incoordinating effect of alcohol in mice can be measured using a stationary dowel test. The genetic influence on AFT in this particular test is shown by studies of inbred and recombinant inbred mouse strains (Kirstein et al., 2002), as well as by successful selective breeding of low AFT (LAFT) and high AFT (HAFT) mouse lines (Erwin and Deitrich, 1996). Heritability for AFT has been estimated to range from 0.25-0.39 (Kirstein et al., 2002; Bennett et al., 2007).
The genomic locations that contribute to AFT have been mapped using quantitative trait locus (QTL) analysis in 30 BXD RI strains and the progenitors (Kirstein et al., 2002). However, specific genes contributing to AFT are still unknown. It is posited that if the expression level of a gene affects a phenotype, the expression of the gene should be regulated by a genetic element located within the phenotypic QTL for the phenotype such as AFT. We have therefore also mapped expression QTLs (eQTLs) using gene expression data generated by microarray experiments in 30 BXD RI mouse strains and the progenitor strains (Saba et al., 2006). We and others have previously used eQTLs to help identify candidate genes for complex phenotypes (Hubner et al., 2005; Wang et al., 2007). In the present study, we use this procedure as a starting point to identify candidate genes that contribute to AFT.
Methods
Mice
Three types of male mice were used for our studies: 1) mice from 20 inbred strains (C57BL/6J, DBA/2J, 129P3/J, C3H/HeJ, AKR/J, A/J, BALB/cJ, FVB/NJ, SJL/J, BTBR T+ tf/J, C58/J, CBA/J, NZW/LacJ, 129S1/svlmJ, NOD/LtJ, PWD/PhJ, BALB/cByJ, KK/HlJ, MOLF/EiJ, and CAST/EiJ); 2) 30 BXD recombinant inbred (RI) strains and the 2 progenitor strains (BXD1, BXD2, BXD5, BXD6, BXD8, BXD9, BXD11, BXD12, BXD13, BXD14, BXD15, BXD16, BXD18, BXD19, BXD21, BXD22, BXD23, BXD24, BXD27, BXD28, BXD29, BXD31, BXD32, BXD33, BXD34, BXD36, BXD38, BXD39, BXD40, BXD42, C57BL/6J, and DBA/2J); and 3) two replicate lines of mice selectively bred for high and low AFT (HAFT and LAFT mice). These lines were bred at the Institute for Behavioral Genetics (Boulder, CO) from HS/Ibg mice. Line 1 was in generation 24 and line 2 in generation 19 of selective breeding when used for our work. BXD RI mice and the mice from the 20 inbred strains were purchased from the Jackson Laboratory (Bar Harbor, ME). Food and water were provided ad libitum and the mice were kept on a 12-hr light/dark cycle. Animal use procedures were approved by the UCHSC Institutional Animal Care and Use Committee. The inbred mice, BXD RI mice and the HAFT and LAFT mice were 55-90 days old when they were used for measures of AFT using the dowel test (see below) and for the microarray measurements of gene expression. We used 6-11 inbred mice per strain for the dowel test (64 DBA/2J mice were used as “internal controls” across time). For microarray analysis, 4-7 mice per strain from inbred and BXD mice and 4 mice per group from the 2 lines of HAFT and LAFT mice were used. None of the mice used for microarray analysis were exposed to alcohol.
AFT measurement
AFT to the locomotor incoordinating effect of alcohol was measured using the dowel test (Erwin and Deitrich, 1996). Briefly, mice were trained to balance on a wooden dowel rod for 5 minutes. On the test day, a mouse was given an intraperitoneal (i.p.) alcohol injection of 1.75 g/kg (10% w/v) and was put on the dowel. When it fell off, a blood sample of 20 μl was taken from the retroorbital sinus for measurement of blood alcohol concentration (BEC0). A second blood sample was taken when the mouse regained the ability to balance on the dowel (BEC1). The mouse then received a second alcohol injection of 2 g/kg and was placed on the dowel. A third blood sample was taken when the mouse again regained the ability to balance on the dowel (BEC2). The difference between BEC1 and BEC2 was defined as the magnitude of acute functional tolerance (AFT) (Erwin and Deitrich, 1996). Blood alcohol concentration was measured by gas chromatography (Tabakoff et al., 1976).
Total RNA extraction
Mice were killed by exposure to CO2 for 10-15 seconds. The whole brain was removed rapidly (<2 min), and total RNA was isolated using the RNeasy Lipid Tissue Midi Kit (Qiagen, Valencia, CA). RNA samples from each mouse brain were analyzed using a separate Affymetrix MOE430V2 array.
Microarray analysis
The quantitation of mRNA using the Affymetrics arrays was performed according to the protocol provided by Affymetrix (Santa Clara, CA) and as previously described in our laboratories (Saba et al., 2006). All arrays that were used for analyses passed the quality control procedures available on http://phenogen.uchsc.edu. Six microarrays were eliminated from the BXD panel and fifteen microarrays were eliminated from the inbred panel because they did not meet the quality control requirements.
Some concern has been raised recently about the effect of SNPs within the 25mer represented by each probe on Affymetrix arrays on the hybridization of particular mRNAs. Walter et al. (2007) identified 13,292 probes within 6,590 probesets that had a sequence polymorphism between C57BL/6J and DBA/2J mice. These probes were eliminated from all analyses, and if less than 4 probes within a probeset contained no SNPs, the entire probeset was eliminated. The Robust Multichip Average (RMA) method, which includes a log base 2 transformation, was used to normalize the expression values of the perfect match probes and to summarize these values in probesets (Irizarry et al., 2003). Each of the four experiments was normalized separately. For the BXD RI strains, only gene array data from the 28 strains, including the two parental strains, that had acute functional tolerance data available, were included in the normalization. All 20 inbred strains had acute functional tolerance data available, and expression data from all inbred strains were therefore included in the normalization.
Meta-analysis
Correlation coefficients of gene expression values and AFT measurements in mice were calculated for each probeset in each of the four populations of animals. Correlation analysis between gene expression and AFT was performed with SAS version 9.1.3 (SAS Institute Inc., Cary, NC). For the BXD RI panel and the inbred panel of mice, Pearson product-moment correlation coefficients were calculated using strain means for both gene expression values and AFT. For the two lines of HAFT and LAFT mice, a point biserial correlation was calculated for each line. Correlation coefficients were then transformed to their corresponding Z values (Field, 2001). These transformed effect size values (Z values) were combined for each probeset using a weighted average, where weights were based on the variance of the particular experiment. Following the method outlined by Hedges and Vevea (1998) for a fixed effects model, a Z-score and its corresponding p-value were calculated from the weighted average of the effect size values and its standard error. Raw p-values were adjusted for multiple comparisons using the method for false discovery rates (FDR) outlined by Benjamini and Hochberg (1995).
Expression QTL (eQTL) and AFT behavioral QTL (bQTL) analyses
Using gene expression as the quantitative trait of interest, expression QTLs (eQTLs) were calculated similarly to traditional QTLs. For this particular analysis, eQTLs were calculated for each probeset individually using a weighted marker regression analysis. The analysis is weighted to account for difference in sample size within strain since strain means were used for the analysis (Saba et al., 2006). Strain means were regressed against a set of 943 markers with unique strain distributions that were derived from the set of 3,795 markers available at http://www.genenetwork.org/dbdoc/BXDGeno.html. Permutation was used to calculate P-values associated with the maximum LOD score for each probeset, to account for the multiple comparisons across markers. The number of permutations per transcript was increased until the maximum LOD score from the true data was no longer in the top ten LOD scores from the permutation, or until 1,000,000 permutations were calculated. A bootstrap method (see Saba et al., 2006), using 1,000 bootstrap samples, was used to determine 95% confidence limits for location of eQTLs with empirical p-values less than 0.10 (see Supplemental Table 1 and Supplemental Figure 1 for a discussion of this methodology). All eQTL calculations were carried out with the freeware QTLReaper which can be downloaded at http://sourceforge.net/projects/qtlreaper/.
To generate the bQTL data for AFT, we utilized our previously published AFT data on the 30 BXD RI strains and the two progenitor strains. QTLs were identified using marker regression on strain means and 1774 markers. QTL intervals were identified as a region covered by neighboring markers with a LOD score greater than 1.44 (p<0.01), with a distal extension of 5 Mb on either side of the region.
Heritability
Narrow sense heritability of each probeset was calculated within the BXD RI panel and the inbred panel separately using the method outlined by Hegmann and Possidente (1981). This method assumes that the variance between inbred strains is twice the variance that would be seen in a random mating population (h2 = ½VA / (½VA + VE)), where VA is the variance between strain means and VE is the variance within strains.
Creation of Candidate Gene List
A list of candidate genes for AFT was created using multiple filters. The analysis was initially limited to probesets that had an eQTL that overlapped an AFT bQTL. The eQTL had to be significant or suggestive (empirical p-value ≤0.10), with a 95% confidence interval for location that overlapped the location of one of the AFT bQTL regions, to pass this filter. For those probesets that passed the filter, an FDR was calculated based on the raw p-values from the meta-analysis of correlation between expression level and AFT. Only probesets with an FDR less than 0.01 were retained. The third filter was implemented to ensure that genes represented in the candidate gene list, not only showed a strong genetic correlation with AFT, but also had a high heritability (above the overall median level of heritability) of expression intensities. Probesets were eliminated if the mRNA expression heritability in either the BXD RI panel or the inbred strain panel was lower than the median heritability of all probesets. Finally, the sequence alignment for the remaining probesets was examined using Ensembl Genome Browser, and probesets, the sequence of which did not map appropriately to the transcript sequences they are purported to represent, were eliminated from consideration.
Examination of the Promoter Region of the Candidate Genes
Transcription factor binding sites within AFT candidate genes’ upstream promoter region were studied by utilizing oPOSSUM (http://burgundy.cmmt.ubc.ca/oPOSSUM). Over-representation of transcription factor binding sites in a 2 kb upstream region (before the transcription start site) of the AFT candidate genes versus a pre-compiled background set of genes was determined using the Z scores and Fisher exact test p values generated by oPOSSUM.
Western Blot Analysis
Mouse brains were homogenized in 0.32 M sucrose, 50 mM Tris-HCl, 1 mM EDTA, and a protease inhibitor cocktail (4-(2-aminoethyl) benzenesulfonyl fluoride, pepstatinA, E-64, bestatin, leupeptin, and aprotinin (Sigma-Aldrich, St. Louis, MO.)), pH 7.4, followed by centrifugation at 3,000 × g for 10 min to remove nuclei and debris. The supernatant was centrifuged at 45,000 × g for 1 hr to pellet membranes. Membranes were resuspended in a buffer consisting of 1% SDS, 5% glycerol, 5% β-mercaptoethanol, 1 mM EDTA, 30 mM Tris-HCl, and 0.1% bromophenol blue, pH 6.8. Protein concentration was measured with BCA assay (Thermo Scientific, Rockford, IL). After electrophoresis through 4-12% Bis-Tris gels (Invitrogen, Carlsbad, CA), proteins were transferred to nitrocellulose membranes. Anti-Kv2.1 antibody (Sigma-Aldrich, St. Louis, MO) was used to probe the membrane at 1:250 dilution followed by goat anti-rabbit horseradish peroxide (HRP)-coupled secondary antibody (Bio-Rad, Hercules, CA) at 1:5000 dilution. The chemiluminescence reagent was purchased from Perkin Elmer, Waltham, MA. β-actin was used as a loading control.
Localization of Expression of the Candidate genes in the Brain
We used the Allen Brain Atlas to obtain the expression levels of mRNA produced from our candidate genes in various brain areas. The Allen Brain Atlas (http://www.brain-map.org) contains expression levels for more than 20,000 genes in numerous brain regions of C57BL6/J mice. The data displayed by the Allen Brain Atlas was obtained using in situ hybridization as described in Lein et al. (2007). The gene expression in coronal and sagittal sections is available, and 3-dimensional images for gene expression throughout brain can be obtained by using the software, Brain Explorer 1.4.1, available on site (see Figure 3). Since the results obtained from the Allen Brain Atlas can be considered semiquantitative, we chose to express the results in Table 3 in a format indicating relative levels of expression rather than absolute values. The symbols we assigned to the expression values found on the Allen Brain Atlas site are the following: Expression levels are labeled as 0 when the Atlas notes the expression level to be 0-15, + when the Atlas notes expression levels to be 15.1-30, ++ when the Atlas notes expression levels to be 30.1-50, +++ when the Atlas notes expression levels to be 50.1-70, ++++ when the Atlas notes expression levels to be 70.1-100. In Figure 3, the images are color coded. Red indicates high expression and green indicates low expression.
Figure 3. Brain regional expression of Epb4.1l2 and Kcnb1.
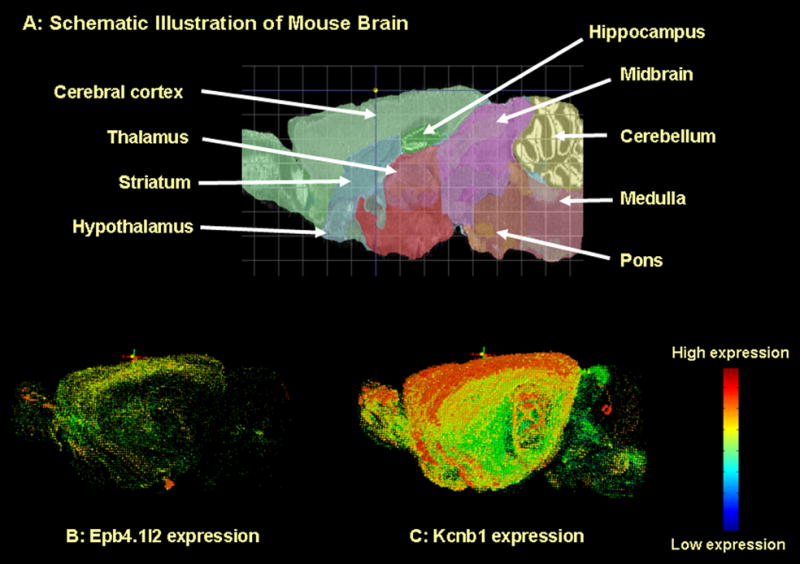
Data were obtained from the Allen Brain Atlas (http://www.brain-map.org). Panels B and C illustrate the expression of Epb4.1l2 and Kcnb1. The images were obtained by using software (Brain Explorer 1.4.1) available on site. The images are 3-dimensional reconstructions of data obtained from coronal and sagittal sections.
Table 3.
Relative expression of the 8 AFT candidate genes in brain areas from Allen Brain Atlas
| Brain area | Epb4.1l2 | Wnk1 | Hlf | Kcnb1 | Cutl1 | Glcci1 | Mtch2 | A130022J15Rik |
|---|---|---|---|---|---|---|---|---|
| Cerebellum | 0 | ++++ | ++++ | + | +++ | + | ++++ | + |
| Cerebral cortex | ++ | ++++ | ++++ | ++++ | +++ | ++ | ++ | 0 |
| Hippocampus | + | ++++ | ++++ | ++++ | ++ | + | ++++ | 0 |
| Hypothalamus | 0 | +++ | ++ | + | ++ | 0 | 0 | 0 |
| Midbrain | 0 | ++++ | ++++ | ++ | ++ | 0 | + | 0 |
| Medulla | 0 | ++++ | ++++ | 0 | +++ | + | +++ | + |
| Pons | 0 | ++++ | ++++ | + | +++ | + | ++ | 0 |
| Striatum | 0 | ++++ | ++++ | ++++ | + | ++ | 0 | 0 |
| Thalamus | 0 | ++++ | ++++ | ++++ | +++ | 0 | ++ | 0 |
Expression levels are scaled as 0 (expression level 0-15), + (expression level 15.1-30), ++ (expression level 30.1-50), +++ (expression level 50.1-70), ++++ (expression level 70.1-100) as indicated in the Allen Brain Atlas. The levels of expression were obtained from sagittal and coronal sections available at (http://www.brain-map.org), and the 3 dimensional reconstruction in Figure 3 may obscure the level of gene expression in some of the brain areas included in this table.
Biochemical Pathway Analysis
PathwayAssist software (Stratagene, La Jolla, CA) was used to examine the biochemical/functional interaction of the AFT candidate genes. The software utilizes a database (ResNet) that contains more than 1.25 million events of regulation, interaction, and modification between and among proteins, cellular processes, and small molecules. ResNet is built from information extracted from PubMed abstracts and 47 full text journals, and is regularly updated.
Results
Measurement of AFT in inbred mice
We have previously published the data on the measures of AFT in the 30 strains of BXD mice and the parental strains (Kirstein et al., 2002) and in two replicate selectively bred lines of mice (HAFT1 and LAFT1, HAFT2 and LAFT2) (Saba et al., 2006). In the present study, we measured AFT in the 20 inbred strains of mice using the same dowel test as used previously. The experiment on inbred strains was conducted in 3 time periods during 2 years. To control for systematic, chronologic bias, DBA/2J mice were included during each period as an internal control. Data in each period were standardized, i.e., adjusted for variation across each period by an adjustment factor which was the average DBA/2J value across all 3 periods divided by the average DBA/2J value for a specific period. The data are shown in Figure 1. ANOVA showed a significant strain effect on AFT (P<0.001). The CAST/ EiJ strain was the strain with highest AFT, and the 129P3/J strain had the lowest AFT. These strains were 9 fold different in AFT. Strain accounted for 43% of the total variance of AFT in the inbred mouse strains.
Figure 1. AFT measurement in the 20 inbred strains of mice using the dowel test.
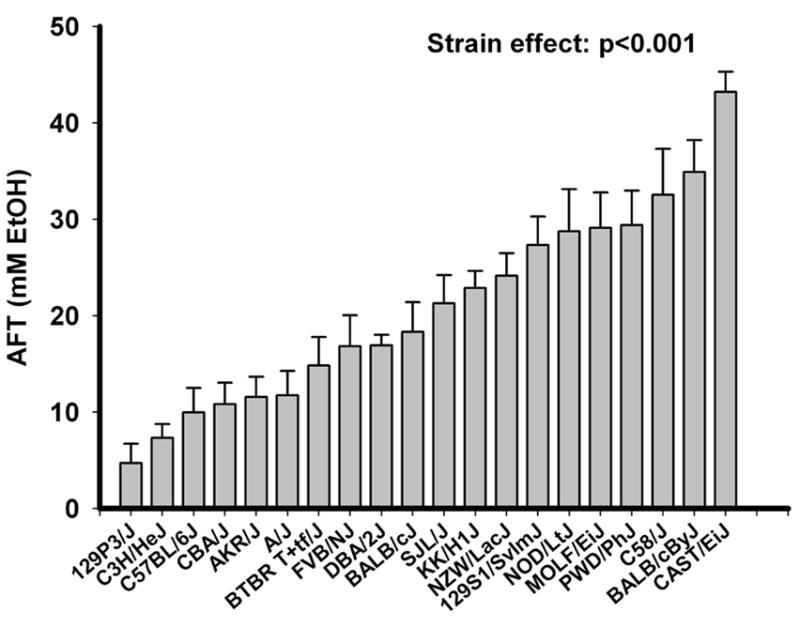
There were 6-11 mice per strain (64 DBA/2J mice were included as internal standards across time). Data are mean ± SEM. ANOVA showed a significant strain effect on AFT (P<0.001).
Re-analysis of AFT bQTLs using BXD RI mice
AFT bQTLs were previously determined in our laboratories using 30 BXD strains and 2 parental strains (Kirstein et al., 2002). Currently, we were able to use more markers together with the behavioral AFT data that we published previously to re-determine AFT bQTLs. Marker locations used currently were from NCBI mouse build 36. Six putative QTLs were detected which were located on chromosomes 1, 2, 4, 5, and 6 (Table 1). QTLs on chromosomes 4 and 5 were not detected in our prior analysis. One QTL on chromosome 6 (27.6-92 Mb) was identified as two separate QTLs in the previous analysis (Table 1). The marker D14Byu1 used to identify an AFT-QTL on Chromosome 14 in our prior work (Kirstein et al., 2002) is currently no longer assigned to that location and flanking markers are not associated with AFT. Therefore, no QTL for AFT is now reported on Chromosome 14.
Table 1.
Re-analysis of AFT bQTLs.
| Markers | QTL location (Chr: Mb) | LOD | Unadjusted P value | QTL location from prior analysis (Kirstein et al., 2002) (Chr: Mb) | |
|---|---|---|---|---|---|
| QTL1 | rs6194543-rs3695661 | 1:152.5-169.8 | 1.9 | 0.0032 | 1: 150-172 |
| QTL2 | rs13476386-rs6164049 | 2: 19.8-30.4 | 2.1 | 0.0019 | 2: 20.2-30.2 |
| 2: 116.1-132.1 | |||||
| QTL3 | rs13477873-rs3695339 | 4: 95.9-109.0 | 2.8 | 0.0003 | |
| QTL4 | rs3708411-rs3711751 | 5: 131.5-142.2 | 1.9 | 0.0030 | |
| QTL5 | rs3661828-rs3694099 | 6: 0-17.4 | 2.7 | 0.0004 | 6: 26.4-54 |
| QTL6 | rs13478696-rs13475374 | 6: 27.6-92.0 | 3.1 | 0.0002 | 6: 66.3-91.2 |
| 14: 8.9-18.9 |
The six provisional QTLs were identified for AFT using AFT measures and marker information from 30 BXD strains and 2 parental strains.
Using the recommendations of assigning the nomenclature of suggestive (LOD>1.9), and significant (LOD>3.3) to QTLs (Lander and Kruglyak, 1995), all the AFT QTLs we identified should be considered suggestive. One QTL (chr6: 27.6-92.0 Mb, LOD 3.1) is approaching significance.
AFT candidate genes
Our gene expression data obtained on Affymetrix arrays from all three types of animals are publicly available on http://phenogen.uchsc.edu and an illustration of the distribution of levels of mRNA for Mtch2 and Kcnb1 across the 20 strains of inbred mice used in our studies is contained in Figure 2. Among 45021 probesets on the Affymetrix MOE430V2 arrays (64 control probesets and the 16 probesets that only had fewer than 4 probes without a SNP between C57BL/6J and DBA/2J mice were removed prior to analysis), 5468 probesets were found to have a significant or suggestive eQTL (P≤0.1). 1210 probesets had an eQTL overlapping one of the AFT bQTLs. 50 of these 1210 probesets were significantly correlated with AFT, based on the meta-analysis of the four populations of animals (FDR <0.01). Among these 50 probesets, 13 had above median heritability in both the 20 inbred strains of mice (median=0.49) and the 32 strains of mice in the BXD panel (median=0.40). Sequence alignment on Ensembl (http://www.ensembl.org) showed that 8 probesets aligned to the genes they were designed to represent and the remaining 5 probesets did not. The 8 genes were considered candidate genes for AFT (Table 2). Some of the eight candidate genes were represented by more than one probeset on the Affymetrix arrays. In each case, one probeset passed all of the filters, while the additional probesets were eliminated at particular steps in the filtering procedure. Supplemental Table 2 provides information on the performance of each probeset targeted to each of the candidate gene mRNAs.
Figure 2. Correlation analysis of expression levels of Mitch2 and Kcnb1 with AFT in whole brain of 20 strains of inbred mice.
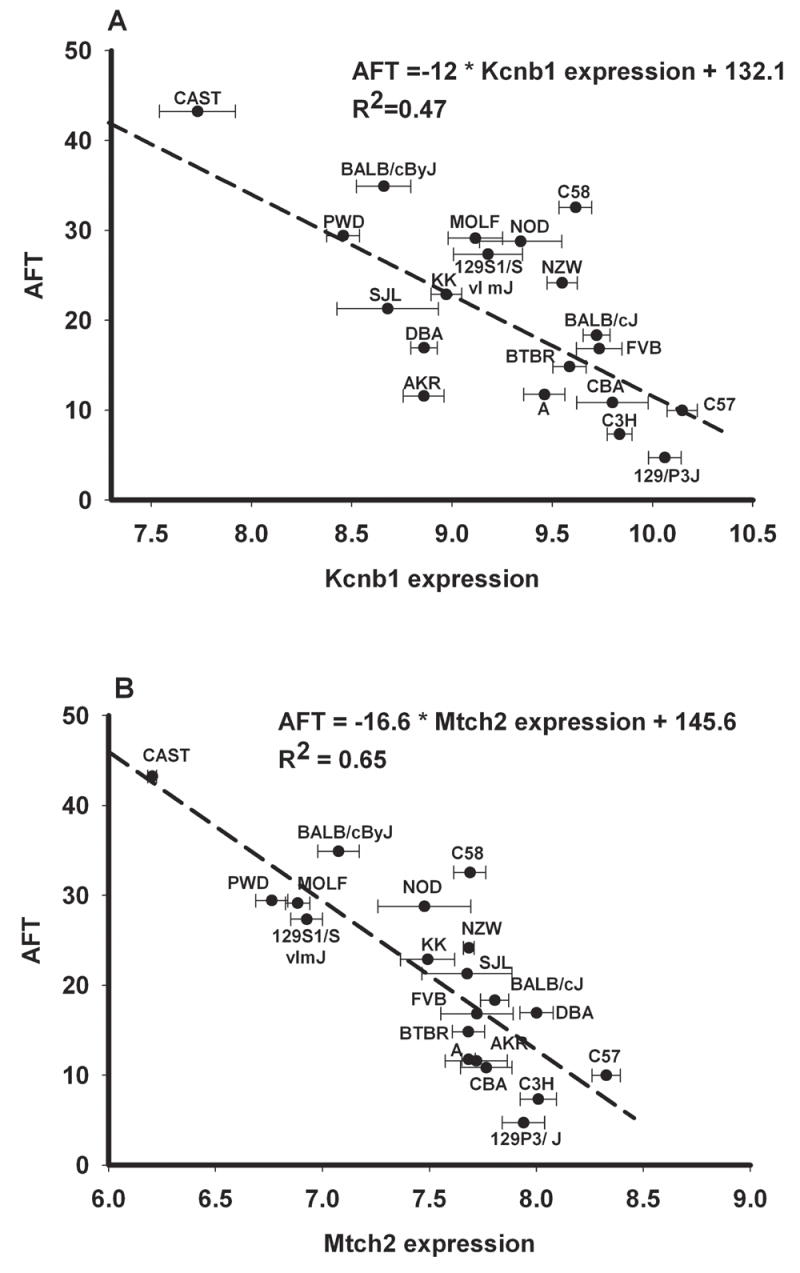
The expression levels are reported as mean log 2 values from microarray analysis and the strains are ordered in the same order as in Figure 1. The regression line and r values were derived using a Pearson product moment correlation analysis of the expression levels of these particular genes and AFT values from Figure 1.
Table 2.
Eight candidate genes for AFT.
| Gene Name | Meta-analysis correlation coefficient | FDR | Heritability BXD mice | Heritability inbred strains | Gene location (Chr:Mb) | eQTL location (Chr:Mb) | eQTL P value | |
|---|---|---|---|---|---|---|---|---|
| Erythrocyte protein band 4.1-like 2 | Epb4.1l2 | -0.47 | 0.007 | 0.43 | 0.50 | 10:25.0-25.2 | 2: 11.7-25.9 | 0.002 |
| potassium voltage gated channel, Shab-related subfamily, member 1 | Kcnb1 | -0.46 | 0.008 | 0.72 | 0.74 | 2:167.3-167.4 | 2: 11.7-167.2 | 0.001 |
| WNK lysine deficient protein kinase 1 | Wnk1 | -0.52 | 0.002 | 0.47 | 0.60 | 6:119.8-119.9 | 2: 11.7-135.6 | 0.056 |
| cut-like 1 (Drosophila) | Cutl1 | -0.49 | 0.005 | 0.81 | 0.82 | 5:136.7-137.0 | 5: 132.4-137.2 | 0.000 |
| hepatic leukemia factor | Hlf | -0.47 | 0.007 | 0.41 | 0.72 | 11:90.1-90.2 | 2: 11.7-67.5 | 0.006 |
| glucocorticoid induced transcript 1 | Glcci1 | -0.52 | 0.002 | 0.56 | 0.63 | 6:8.2-8.5 | 6: 3.4-33 | 0.002 |
| mitochondrial carrier homolog 2 (C. elegans) | Mtch2 | -0.52 | 0.002 | 0.41 | 0.72 | 2:90.6-90.7 | 2: 9.7-91.8 | 0.010 |
| A130022J15Riken one | A130022J15Rik | -0.59 | 0.001 | 0.72 | 0.55 | 6:97.06-97.09 | 6: 85.8-129.1 | 0.007 |
Eight candidate genes were identified through the meta-analysis of brain microarray data from four populations of mice, using multiple filters. These genes were all negatively correlated with AFT. The FDR associated with the meta-analysis, as well as the heritability of expression in the panels of inbred and recombinant inbred mice are reported. The candidate genes were required to have a significant or suggestive (p ≤0.1) eQTL overlapping with an AFT bQTL.
Examination of Brain Expression Patterns for Candidate Genes
The mRNA for two of the eight candidate genes (Hlf, Cutl1) showed a broad distribution in brain (Table 3). This is not surprising, since the products of these genes act as transcription factors. The mRNA for Wnk1, the serine-threonine kinase, also demonstrated a broad distribution indicative of the general importance of its function. On the other hand, the mRNA products of Epb4.1l2 and Kcnb1 were expressed together but localized at higher levels in cortical and hippocampal areas (Table 3, Figure 3). Kcnb1 mRNA was also plentiful in striatum (motor control function?) and thalamus (signal relay function). Mtch2 mRNA (Table 3) was highly expressed in the cerebellum and hippocampus which are areas related to motor control, and learning and memory, respectively.
Promoter analysis of AFT candidate genes
Five transcription factor binding sites are over-represented within the 2000 bp 5’ upstream region of the 8 AFT candidate genes. The transcription factors are Elk1, Arnt-Ahr, Irf1, Creb1, and E2f1 (Z score >4, Fisher exact test p <0.05) (Table 4).
Table 4.
Promoter analysis of AFT candidate genes.
| Elk1 | Arnt-Ahr | Irf1 | Creb1 | E2f1 | |
|---|---|---|---|---|---|
| Epb4.1l2 | X | X | X | X | X |
| Wnk1 | X | X | X | X | |
| Hlf | X | X | X | X | X |
| Kcnb1 | X | X | X | ||
| Cutl1 | X | X | X | X | X |
| Glcci1 | X | X | X | X | X |
| Mtch2 | X | X | |||
| A130022J15Rik | X |
Transcription factors whose binding sites are over-represented in the 5’-upstream untranslated region of the AFT candidate genes are listed at the top of this table and × indicates that the transcription factor has a binding site(s) in the upstream 2 kB region of a candidate gene. The five transcription factors were identified by using oPOSSUM (Z score >4, Fisher exact test p <0.05).
Western blot Confirmation for Kcnb1 Protein Product
Kcnb1 is a promising candidate gene for AFT based on past (Lewohl et al., 1999) and current studies. KCNB1 protein levels were determined in HAFT/LAFT mice and in two strains of BXD mice. We chose BXD13 and BXD38 mice for protein quantitation because these two strains display significantly different levels of AFT (Kirstein et al., 2002). In our current study, we also noted significantly different Kcnb1 mRNA levels between HAFT1, HAFT2 and LAFT1, LAFT2 mice and between BXD 13 and BXD 38 mice. The results of Western blot analysis for KCNB1 protein are shown in Table 5 and Figure 4. BXD 13 mice display high AFT levels and low Kcnb1 mRNA levels (9.19 ± 0.06) as compared to BXD 38 mice (log 2 transformed intensity value = 9.95 ± 0.05, p=0.00002). KCNB1 protein levels are also lower in brain of BXD 13 mice (densitometric value = 1.96 ± 0.13) than in BXD 38 mice (densitometric value = 2.52 ± 0.11, p<0.01). Kcnb1 mRNA is lower in HAFT1 mice (log 2 transformed intensity value = 8.39 ± 0.04) than LAFT1 mice (9.13 ± 0.13, p=0.002). KCNB1 protein is also lower in brain of HAFT1 mice (densitometric value = 1.01 ± 0.07) than LAFT1 mice (densitometric value = 1.22 ± 0.07, p<0.05).
Table 5.
Comparison of protein levels and mRNA levels of Kcnb1 in mouse brain.
| MRNA Microarray analysis | Protein Western blot analysis | |
|---|---|---|
| BXD 13 | 9.19±0.06 **** | 1.96±0.13 ** |
| BXD 38 | 9.95±0.05 **** | 2.52±0.11 ** |
| Microarray analysis | Western blot | |
| HAFT1 | 8.39±0.04 *** | 1.01±0.07* |
| LAFT1 | 9.13±0.13 *** | 1.22±0.07* |
Western blot analysis of Kcnb1 protein was performed as described in the text. Densitometric measures were derived from images such as the ones illustrated in Figure 4. mRNA levels were obtained through analysis of Affymetrix MOE430V2 arrays. Data are mean ± SEM. There were 6 mice/strains used in Western blot and 4-6 mice/strain in microarray analysis. BXD 13 mice display high AFT while BXD 38 mice display low AFT. HAFT1/LAFT1 mice were selectively bred for high (HAFT) and low (LAFT) levels of AFT. t-test was used to compare expression values between BXD13 mice and BXD 38 mice and between HAFT1 mice and LAFT1 mice.
indicates p<0.05,
p <0.01,
p=0.002,
p=0.00002.
Figure 4. Western blot for Kcnb1 in HAFT1/LAFT1 mouse brains.
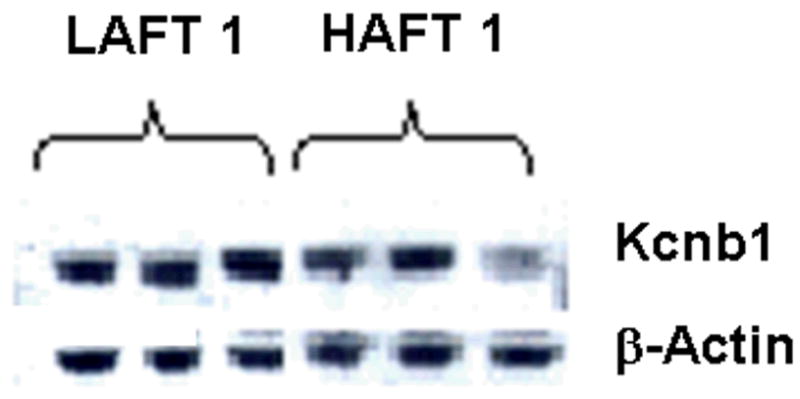
This figure illustrates the bands evident after probing the transfer with antibody for Kcnb1 and actin. Densitometric quantitation of the bands was performed using Quantity One (Bio-Rad, Hercules, CA) and the values appear in Table 5.
Pathway analysis of the AFT candidate genes
Using PathwayAssist software, a relational pathway shown in Figure 5 was generated. Five of the 8 candidate gene products were included in this pathway, and there were a total of 16 gene products in the pathway.
Figure 5. The interaction pathway for the 8 AFT candidate genes.
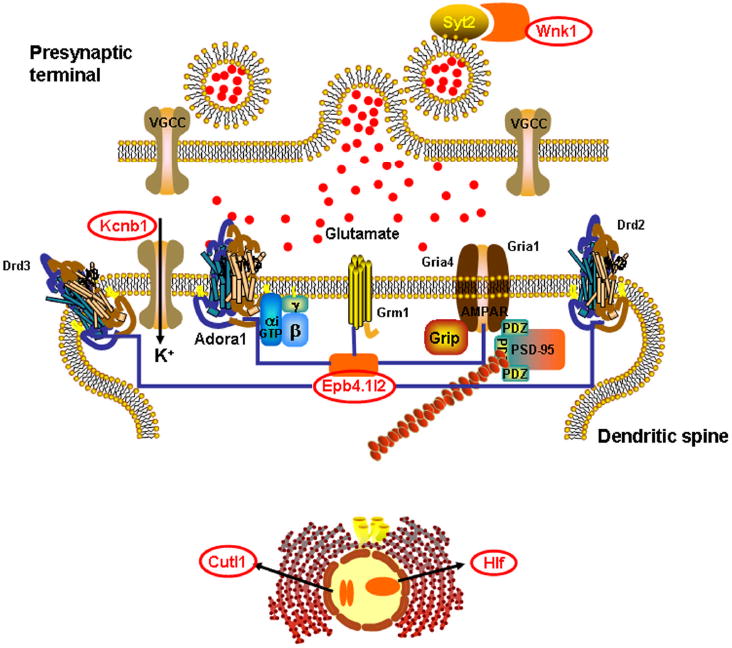
The pathway was built from data obtained from PathwayAssist (Stratagene, La Jolla, CA). Five of the 8 candidate genes were included in the pathway through the computer analysis. These genes are shaded in orange and are circled. The full complement of proteins within the pathway was as follows: Drd2 (dopamine receptor D2), Drd3 (dopamine receptor D3), Grm1 (glutamate receptor, metabotropic 1), Syt2 (synaptotagmin II), Kcnb1 (voltage gated potassium channel), Adora1 (adenosine A1 receptor), Gria1 (glutamate receptor, ionotropic, AMPA 1), Gria4 (glutamate receptor, ionotropic, AMPA 4), Wnk1 (WNK lysine deficient protein kinase 1), Cutl1 (cut-like 1 (Drosophila)), Epb4.1l2 (erythrocyte protein band 4.1-like 2), Hlf (hepatic leukemia factor), VGCC (voltage-gated calcium channel), PSD95 (postsynaptic density protein 95), G protein (guanine nucleotide-binding protein), and Grip (glutamate receptor interacting protein).
Discussion
QTLs have been used extensively to locate the area of genome that contributes to a quantitative phenotype. Gene expression can be conceptualized as an intermediate phenotype between DNA variation and quantitative differences in complex traits. If the expression level of a gene affects a behavior, which in turn is controlled by elements within a bQTL, one would expect that the candidate gene expression is also controlled from within the bQTL. We and others have recently used the overlap of eQTLs and bQTLs as a criterion to filter the candidate genes for alcohol-related traits (Saba et al., 2006), atherosclerosis (Wang et al., 2007) and hypertension (Hubner et al., 2005) from larger panels of differentially expressed genes.
After applying the eQTL/bQTL overlap filter and other filters, we identified 8 genes as predisposing elements for AFT. Erythrocyte membrane protein band 4.1-like 2 (EPB41l2, or 4.1G) is a member of the cytoskeletal protein family that also includes 4.1R, 4.1N, and 4.1B. It is present in the postsynaptic density in neurons, as well as in microglia in the brain. The 4.1G protein interacts with AMPA receptor GluR1 and GluR4 subunits, and may support their surface expression (Coleman et al., 2003). It also interacts with D2 and D3 dopamine receptors (Binda et al., 2002), metabotropic glutamate receptor subtype 1α (Lu et al., 2004a), and A1 adenosine receptors (Lu et al., 2004b).
The voltage gated potassium channel, Shab-related subfamily, member 1 (Kcnb1) is found on neuronal soma and proximal dendrites (reviewed in Trimmer and Rhodes, 2004). Kcnb1 contributes significantly to the negative membrane potential which dampens neuronal excitability. Another potassium channel, the calcium-gated potassium channel, has already been found to be necessary for the development of rapid tolerance to alcohol sedation in Drosophila (Cowmeadow et al., 2005). Kcnb1 mRNA levels obtained using the Affymetrix MOE 430V2 arrays, across the 20 inbred strains of mice, are illustrated in Figure 2. Our measures of KCNB protein (Figure 4 and Table 5) substantiated the inverse quantitative relationship between Kcnb1 gene products and AFT in the selectively bred HAFT and LAFT mice and in BXD recombinant inbred mice which differed in AFT. It is of interest that the genes related to scaffolding for the glutamate receptors, and related to membrane polarization which controls NMDA receptor function, are differentially expressed and have a negative correlation with AFT. Expression of Kcnb1 and Epb4.1l2 also are located in the same brain areas (cortex and hippocampus).
WNK lysine deficient protein kinase 1 (Wnk1) is a serine/threonine kinase. Wnk1 phosphorylates synaptotagmin 2 (Syt2), a Ca2+ sensor, and increases the amount of Ca2+ required for Syt2 binding to synaptic vesicles (Lee et al., 2004). Syt2 has been shown to be involved in the release of glutamate and other neurotransmitters (Pang et al., 2006). Wnk1 also activates Erk5 (Xu et al., 2004) and Erk5 in turn activates calcineurin and down-regulates NMDA receptor activity. Thus, Wnk1 can modulate both presynaptic and post-synaptic components of glutamatergic transmission.
Cut-like 1 (Cutl1) generally functions as a transcription repressor, but may also be a transcription activator (Nepveu, 2001). It is mainly expressed in neurons in the upper layers of the murine brain cortex (Nieto et al., 2004) and may determine the neuronal phenotype of these neurons.
Hepatic leukemia factor (Hlf) protein is a bZIP transcription factor. Reports on the function of Hlf protein in brain have linked the expression of Hlf to synaptogenesis in the cortex and thalamus (Hitzler et al., 1999).
Mitochondrial carrier homolog 2 (Mtch2) is a mitochondrial membrane protein. Proteins such as Mtch2 have also been linked to promotion of neurite outgrowth (Lepagnol-Bestel et al., 2008). The high expression of Mtch2 mRNA in the hippocampus and cerebellum may indicate a role for Mtch2 in rearrangement of neuronal architecture in brain areas important in spatial and motor learning and memory. Overall, it is of interest that a number of the candidate genes, including Epb4.1l2, Wnk1, Hlf, Kcnb1, and Mtch2, show high levels of expression in brain areas implicated in learning and performance of motor skills, particularly the hippocampus, cerebellum and cerebral cortex (Figure 3, Table 3).
The interactions noted in the literature among the products of the candidate genes we identified and other neuronal proteins indicate the importance of regulation of NMDA receptors with regard to AFT. Membrane depolarization upon AMPA receptor activation is generally required for NMDA receptors to open. Kcnb1 contributes to a negative membrane potential and therefore increases the difficulty of activating NMDA receptors. The negative correlation between Kcnb1 mRNA levels and AFT would suggest that NMDA receptors may be more active in animals that develop higher levels of AFT. The AMPA receptors undergo rapid trafficking (Shepherd and Huganir, 2007). Normally Epb4.1l2 supports AMPA receptors at the synapse. However the mRNA levels of the splice variant of Epb4.1l2 that is negatively correlated with AFT in our studies does not contain a domain that binds actin and spectrin and thus may act as a “dominant negative” modulator of other Epb4.1 molecules. In essence, higher levels of Epb4.1l2 may decrease AMPA receptor surface expression and reduce the propensity for AFT development. Although not themselves differentially expressed, six receptor proteins (i.e., the products of genes Adora1, Drd2, Drd3, Grm1, Gria1and Gria4), are coupled to the differentially expressed candidate genes through pathway analysis (Fig. 5). The products of these genes, including the subunits of the AMPA glutamate receptor, the metabotropic glutamate receptor 1, the D2 and D3 dopamine receptors and the adenosine receptor 1α, play a major role in excitatory and inhibitory signaling in brain. On the presynaptic side of neurotransmission, the interaction of Wnk1 and Syt2 (synaptotagmin 2) may be related to glutamate release (Pang et al., 2006). The candidate gene product Wnk1 phosphorylates Syt2 and may reduce glutamate release, which could explain the negative correlation between Wnk1 mRNA and AFT in our analysis. It is of interest to note that our earlier microarray analysis of brains of HAFT and LAFT mice only, also implicated NMDA receptor systems in AFT, although different candidate genes were identified (Saba et al., 2006).
Among the 8 candidate genes, the expression of Epb4.1l2, Wnk1, and Hlf is trans-regulated from within bQTLs; the remaining genes, Kcnb1, Cutl1, Glcci1, Mtch2 and A130022J15Rik appear to be cis-regulated (the eQTL information is available on http://phenogen.uchsc.edu). In particular, A130022J15 Rik is located within the bQTL on chromosome 6 that has a LOD score of 3.1. Although this gene is currently not well annotated, our results suggest that this gene would be of value to explore in terms of understanding the determinants of AFT. The eQTLs for all three trans-regulated genes are located on chromosome 2. The overlapping genomic area of these eQTLs (chromosome 2: 11.7-25.9 Mb) contains 7 transcription factor genes (Bmyc, Nrarp, Sohlh1, Tbpl2, Bmi1, Ptf1a, and Pax8). It would be appropriate to consider that one or more products of these transcription factor genes could influence the expression of the three trans-regulated candidate genes. However, the current lack of definitive data regarding DNA sequences which comprise binding sites for any of the seven transcription factors precludes a test of such a hypothesis. We did note that a Creb1 binding site was present in six of the eight candidate gene promoter regions, including all of the trans-regulated genes. The expression level of Creb1 was negatively correlated with AFT in our studies, but Creb1 was not included in our candidate gene list because it did not pass the eQTL/bQTL overlap filter. Although it is enticing to speculate about the involvement of Creb in neuroadaptive phenomena such as tolerance, the relation of Creb to the expression levels of our candidate genes is tenuous at present.
A critical issue in evaluating our findings is whether they can be extrapolated across species. The human genome and mouse genome share a high level of synteny (Waterston et al., 2002). The syntenic areas of mouse AFT bQTLs on chromosomes 2 (19.8-30.4 Mb) and 6 (0-17.4 Mb) overlap with two human alcohol dependence susceptibility loci (chromosome 7: 82.4-94.9 Mb and chromosome 10: 26-52 Mb) identified in the Collaborative Study on the Genetics of Alcoholism (Agrawal et al., 2008). One of the AFT bQTLs (chromosome 1: 152.5-169.8 Mb) identified in mice is also syntenic with one of the human genomic loci (LOD>2 in 238 sibling pairs; marker at chromosome 1: 163 Mb) for a low alcohol response as measured by body sway (BS) and/or Subjective High Assessment Scale (SHAS) (Schuckit et al., 2005). Additionally, the mouse AFT QTL on chromosome 6: 27.6-92.0 Mb (LOD=3.1) is syntenic with a human locus (chromosome 1: 71.9 Mb) that was reported to affect alcohol tolerance, as indicated by the quantity of alcohol that an individual could consume (Kuo et al., 2006). We cannot be certain whether the human orthologs of our candidate genes for AFT play a role in human alcohol dependence susceptibility or the propensity for humans to develop AFT, but the candidate genes we identified in mice may well, with further investigation, help in understanding the molecular basis of acute alcohol tolerance in humans as well as rodents.
Supplementary Material
Acknowledgments
This work was supported in part by NIAAA, NIH (U01 AA016649-INIA Project; U01 AA016663-INIA Project; U01 AA013478-INIA Project; R24 AA013162-06A1); and the Banbury Fund.
List of nonstandard abbreviations
- AFT
acute functional tolerance
- HAFT and LAFT
lines of mice selectively bred for high (HAFT) and low (LAFT) acute functional tolerance
- SOA
sons of alcoholics
- SONA
sons of nonalcoholics
- LR
level of response
- eQTL
expression QTL
- bQTL
behavioral QTL
Footnotes
Thesis information: Some of these data are included in a PhD thesis submitted to the University of Colorado by Wei Hu.
References
- Agrawal A, Hinrichs AL, Dunn G, Bertelsen S, Dick DM, Saccone SF, Saccone NL, Grucza RA, Wang JC, Cloninger CR, Edenberg HJ, Foroud T, Hesselbrock V, Kramer J, Bucholz KK, Kuperman S, Nurnberger JI, Jr, Porjesz B, Schuckit MA, Goate AM, Bierut LJ. Linkage scan for quantitative traits identifies new regions of interest for substance dependence in the Collaborative Study on the Genetics of Alcoholism (COGA) sample. Drug Alcohol Depend. 2008;93:12–20. doi: 10.1016/j.drugalcdep.2007.08.015. [DOI] [PMC free article] [PubMed] [Google Scholar]
- American Psychiatric Association. Diagnostic and Statistical Manual of Mental Disorders. American Psychiatric Association; Washington DC: 1994. [Google Scholar]
- Benjamini Y, Hochberg Y. Controlling the false discovery rate: a practical and powerful approach to multiple testing. JR Statist Soc B. 1995;57:289–300. [Google Scholar]
- Bennett B, Downing C, Carosone-Link P, Ponicsan H, Ruf C, Johnson TE. Quantitative trait locus mapping for acute functional tolerance to ethanol in the L × S recombinant inbred panel. Alcohol Clin Exp Res. 2007;31:200–208. doi: 10.1111/j.1530-0277.2006.00296.x. [DOI] [PubMed] [Google Scholar]
- Binda AV, Kabbani N, Lin R, Levenson R. D2 and D3 dopamine receptor cell surface localization mediated by interaction with protein 4.1N. Mol Pharmacol. 2002;62:507–513. doi: 10.1124/mol.62.3.507. [DOI] [PubMed] [Google Scholar]
- Coleman SK, Cai C, Mottershead DG, Haapalahti JP, Keinanen K. Surface expression of GluR-D AMPA receptor is dependent on an interaction between its C-terminal domain and a 4.1 protein. J Neurosci. 2003;23:798–806. doi: 10.1523/JNEUROSCI.23-03-00798.2003. [DOI] [PMC free article] [PubMed] [Google Scholar]
- Cotton NS. The familial incidence of alcoholism: a review. J Stud Alcohol. 1979;40:89–116. doi: 10.15288/jsa.1979.40.89. [DOI] [PubMed] [Google Scholar]
- Cowmeadow RB, Krishnan HR, Atkinson NS. The slowpoke gene is necessary for rapid ethanol tolerance in Drosophila. Alcohol Clin Exp Res. 2005;29:1777–1786. doi: 10.1097/01.alc.0000183232.56788.62. [DOI] [PubMed] [Google Scholar]
- Erwin VG, Deitrich RA. Genetic selection and characterization of mouse lines for acute functional tolerance to ethanol. J Pharmacol Exp Ther. 1996;279:1310–1317. [PubMed] [Google Scholar]
- Field AP. Meta-analysis of correlation coefficients: a Monte Carlo comparison of fixed-and random-effects methods. Psychol Methods. 2001;6:161–180. doi: 10.1037/1082-989x.6.2.161. [DOI] [PubMed] [Google Scholar]
- Hedges LV, Vevea JL. Fixed- and random-effects models in meta-analysis. Psych Methods. 1998;3:486–504. [Google Scholar]
- Hegmann JP, Possidente B. Estimating genetic correlations from inbred strains. Behav Genet. 1981;11:103–114. doi: 10.1007/BF01065621. [DOI] [PubMed] [Google Scholar]
- Hitzler JK, Soares HD, Drolet DW, Inaba T, O’Connel S, Rosenfeld MG, Morgan JI, Look AT. Expression patterns of the hepatic leukemia factor gene in the nervous system of developing and adult mice. Brain Res. 1999;820:1–11. doi: 10.1016/s0006-8993(98)00999-8. [DOI] [PubMed] [Google Scholar]
- Hubner N, Wallace CA, Zimdahl H, Petretto E, Schulz H, Maciver F, Mueller M, Hummel O, Monti J, Zidek V, Musilova A, Kren V, Causton H, Game L, Born G, Schmidt S, Muller A, Cook SA, Kurtz TW, Whittaker J, Pravenec M, Aitman TJ. Integrated transcriptional profiling and linkage analysis for identification of genes underlying disease. Nat Genet. 2005;37:243–253. doi: 10.1038/ng1522. [DOI] [PubMed] [Google Scholar]
- Irizarry RA, Bolstad BM, Collin F, Cope LM, Hobbs B, Speed TP. Summaries of Affymetrix GeneChip probe level data. Nucleic Acids Res. 2003;31:e15. doi: 10.1093/nar/gng015. [DOI] [PMC free article] [PubMed] [Google Scholar]
- Khanna JM, Morato GS, Kalant H. Effect of NMDA antagonists, an NMDA agonist, and serotonin depletion on acute tolerance to ethanol. Pharmacol Biochem Behav. 2002;72:291–298. doi: 10.1016/s0091-3057(01)00773-0. [DOI] [PubMed] [Google Scholar]
- Kirstein SL, Davidson KL, Ehringer MA, Sikela JM, Erwin VG, Tabakoff B. Quantitative trait loci affecting initial sensitivity and acute functional tolerance to ethanol-induced ataxia and brain cAMP signaling in BXD recombinant inbred mice. J Pharmacol Exp Ther. 2002;302:1238–1245. doi: 10.1124/jpet.302.3.1238. [DOI] [PubMed] [Google Scholar]
- Kuo PH, Neale MC, Riley BP, Webb BT, Sullivan PF, Vittum J, Patterson DG, Thiselton DL, van den Oord EJ, Walsh D, Kendler KS, Prescott CA. Identification of susceptibility loci for alcohol-related traits in the Irish Affected Sib Pair Study of Alcohol Dependence. Alcohol Clin Exp Res. 2006;30:1807–1816. doi: 10.1111/j.1530-0277.2006.00217.x. [DOI] [PubMed] [Google Scholar]
- Lander E, Kruglyak L. Genetic dissection of complex traits: guidelines for interpreting and reporting linkage results. Nat Genet. 1995;11:241–247. doi: 10.1038/ng1195-241. [DOI] [PubMed] [Google Scholar]
- Lee BH, Min X, Heise CJ, Xu BE, Chen S, Shu H, Luby-Phelps K, Goldsmith EJ, Cobb MH. WNK1 phosphorylates synaptotagmin 2 and modulates its membrane binding. Mol Cell. 2004;15:741–751. doi: 10.1016/j.molcel.2004.07.018. [DOI] [PubMed] [Google Scholar]
- Lein ES, Hawrylycz MJ, Ao N, Ayres M, Bensinger A, Bernard A, Boe AF, Boguski MS, Brockway KS, Byrnes EJ, Chen L, Chen TM, Chin MC, Chong J, Crook BE, Czaplinska A, Dang CN, Datta S, Dee NR, Desaki AL, Desta T, Diep E, Dolbeare TA, Donelan MJ, Dong HW, Dougherty JG, Duncan BJ, Ebbert AJ, Eichele G, Estin LK, Faber C, Facer BA, Fields R, Fischer SR, Fliss TP, Frensley C, Gates SN, Glattfelder KJ, Halverson KR, Hart MR, Hohmann JG, Howell MP, Jeung DP, Johnson RA, Karr PT, Kawal R, Kidney JM, Knapik RH, Kuan CL, Lake JH, Laramee AR, Larsen KD, Lau C, Lemon TA, Liang AJ, Liu Y, Luong LT, Michaels J, Morgan JJ, Morgan RJ, Mortrud MT, Mosqueda NF, Ng LL, Ng R, Orta GJ, Overly CC, Pak TH, Parry SE, Pathak SD, Pearson OC, Puchalski RB, Riley ZL, Rockett HR, Rowland SA, Royall JJ, Ruiz MJ, Sarno NR, Schaffnit K, Shapovalova NV, Sivisay T, Slaughterbeck CR, Smith SC, Smith KA, Smith BI, Sodt AJ, Stewart NN, Stumpf KR, Sunkin SM, Sutram M, Tam A, Teemer CD, Thaller C, Thompson CL, Varnam LR, Visel A, Whitlock RM, Wohnoutka PE, Wolkey CK, Wong VY, Wood M, et al. Genome-wide atlas of gene expression in the adult mouse brain. Nature. 2007;445:168–176. doi: 10.1038/nature05453. [DOI] [PubMed] [Google Scholar]
- Lepagnol-Bestel AM, Maussion G, Boda B, Cardona A, Iwayama Y, Delezoide AL, Moalic JM, Muller D, Dean B, Yoshikawa T, Gorwood P, Buxbaum JD, Ramoz N, Simonneau M. SLC25A12 expression is associated with neurite outgrowth and is upregulated in the prefrontal cortex of autistic subjects. Mol Psychiatry. 2008;13:385–397. doi: 10.1038/sj.mp.4002120. [DOI] [PubMed] [Google Scholar]
- Lewohl JM, Wilson WR, Mayfield RD, Brozowski SJ, Morrisett RA, Harris RA. G-protein-coupled inwardly rectifying potassium channels are targets of alcohol action. Nat Neurosci. 1999;2:1084–1090. doi: 10.1038/16012. [DOI] [PubMed] [Google Scholar]
- Lu D, Yan H, Othman T, Rivkees SA. Cytoskeletal protein 4.1G is a binding partner of the metabotropic glutamate receptor subtype 1 alpha. J Neurosci Res. 2004a;78:49–55. doi: 10.1002/jnr.20230. [DOI] [PubMed] [Google Scholar]
- Lu D, Yan H, Othman T, Turner CP, Woolf T, Rivkees SA. Cytoskeletal protein 4.1G binds to the third intracellular loop of the A1 adenosine receptor and inhibits receptor action. Biochem J. 2004b;377:51–59. doi: 10.1042/BJ20030952. [DOI] [PMC free article] [PubMed] [Google Scholar]
- Mellanby E. Alcohol: its absorption into and disappearance from the blood under different conditions. Medical Research Committee Special Report. 1919;31:1–48. [Google Scholar]
- Nepveu A. Role of the multifunctional CDP/Cut/Cux homeodomain transcription factor in regulating differentiation, cell growth and development. Gene. 2001;270:1–15. doi: 10.1016/s0378-1119(01)00485-1. [DOI] [PubMed] [Google Scholar]
- Newlin DB, Thomson JB. Alcohol challenge with sons of alcoholics: a critical review and analysis. Psychol Bull. 1990;108:383–402. doi: 10.1037/0033-2909.108.3.383. [DOI] [PubMed] [Google Scholar]
- Nieto M, Monuki ES, Tang H, Imitola J, Haubst N, Khoury SJ, Cunningham J, Gotz M, Walsh CA. Expression of Cux-1 and Cux-2 in the subventricular zone and upper layers II-IV of the cerebral cortex. J Comp Neurol. 2004;479:168–180. doi: 10.1002/cne.20322. [DOI] [PubMed] [Google Scholar]
- Pang ZP, Sun J, Rizo J, Maximov A, Sudhof TC. Genetic analysis of synaptotagmin 2 in spontaneous and Ca2+-triggered neurotransmitter release. EMBO J. 2006;25:2039–2050. doi: 10.1038/sj.emboj.7601103. [DOI] [PMC free article] [PubMed] [Google Scholar]
- Saba L, Bhave SV, Grahame N, Bice P, Lapadat R, Belknap J, Hoffman PL, Tabakoff B. Candidate genes and their regulatory elements: alcohol preference and tolerance. Mamm Genome. 2006;17:669–688. doi: 10.1007/s00335-005-0190-0. [DOI] [PubMed] [Google Scholar]
- Schuckit MA, Wilhelmsen K, Smith TL, Feiler HS, Lind P, Lange LA, Kalmijn J. Autosomal linkage analysis for the level of response to alcohol. Alcohol Clin Exp Res. 2005;29:1976–1982. doi: 10.1097/01.alc.0000187598.82921.27. [DOI] [PubMed] [Google Scholar]
- Shepherd JD, Huganir RL. The cell biology of synaptic plasticity: AMPA receptor trafficking. Annu Rev Cell Dev Biol. 2007;23:613–643. doi: 10.1146/annurev.cellbio.23.090506.123516. [DOI] [PubMed] [Google Scholar]
- Tabakoff B, Anderson RA, Ritzmann RF. Brain acetaldehyde after ethanol administration. Biochem Pharmacol. 1976;25:1305–1309. doi: 10.1016/0006-2952(76)90094-0. [DOI] [PubMed] [Google Scholar]
- Tabakoff B, Cornell N, Hoffman PL. Alcohol tolerance. Ann Emerg Med. 1986;15:1005–1012. doi: 10.1016/s0196-0644(86)80119-6. [DOI] [PubMed] [Google Scholar]
- Trimmer JS, Rhodes KJ. Localization of voltage-gated ion channels in mammalian brain. Annu Rev Physiol. 2004;66:477–519. doi: 10.1146/annurev.physiol.66.032102.113328. [DOI] [PubMed] [Google Scholar]
- Walter NA, McWeeney SK, Peters ST, Belknap JK, Hitzemann R, Buck KJ. SNPs matter: impact on detection of differential expression. Nat Methods. 2007;4:679–680. doi: 10.1038/nmeth0907-679. [DOI] [PMC free article] [PubMed] [Google Scholar]
- Wang SS, Schadt EE, Wang H, Wang X, Ingram-Drake L, Shi W, Drake TA, Lusis AJ. Identification of pathways for atherosclerosis in mice: integration of quantitative trait locus analysis and global gene expression data. Circ Res. 2007;101:e11–e30. doi: 10.1161/CIRCRESAHA.107.152975. [DOI] [PubMed] [Google Scholar]
- Waterston RH, Lindblad-Toh K, Birney E, Rogers J, Abril JF, Agarwal P, Agarwala R, Ainscough R, Alexandersson M, An P, Antonarakis SE, Attwood J, Baertsch R, Bailey J, Barlow K, Beck S, Berry E, Birren B, Bloom T, Bork P, Botcherby M, Bray N, Brent MR, Brown DG, Brown SD, Bult C, Burton J, Butler J, Campbell RD, Carninci P, Cawley S, Chiaromonte F, Chinwalla AT, Church DM, Clamp M, Clee C, Collins FS, Cook LL, Copley RR, Coulson A, Couronne O, Cuff J, Curwen V, Cutts T, Daly M, David R, Davies J, Delehaunty KD, Deri J, Dermitzakis ET, Dewey C, Dickens NJ, Diekhans M, Dodge S, Dubchak I, Dunn DM, Eddy SR, Elnitski L, Emes RD, Eswara P, Eyras E, Felsenfeld A, Fewell GA, Flicek P, Foley K, Frankel WN, Fulton LA, Fulton RS, Furey TS, Gage D, Gibbs RA, Glusman G, Gnerre S, Goldman N, Goodstadt L, Grafham D, Graves TA, Green ED, Gregory S, Guigo R, Guyer M, Hardison RC, Haussler D, Hayashizaki Y, Hillier LW, Hinrichs A, Hlavina W, Holzer T, Hsu F, Hua A, Hubbard T, Hunt A, Jackson I, Jaffe DB, Johnson LS, Jones M, Jones TA, Joy A, Kamal M, Karlsson EK, et al. Initial sequencing and comparative analysis of the mouse genome. Nature. 2002;420:520–562. doi: 10.1038/nature01262. [DOI] [PubMed] [Google Scholar]
- Xu BE, Stippec S, Lenertz L, Lee BH, Zhang W, Lee YK, Cobb MH. WNK1 activates ERK5 by an MEKK2/3-dependent mechanism. J Biol Chem. 2004;279:7826–7831. doi: 10.1074/jbc.M313465200. [DOI] [PubMed] [Google Scholar]
Associated Data
This section collects any data citations, data availability statements, or supplementary materials included in this article.