

Abstract
Development of immunomodulatory agents that enhance innate immune responses represents a promising strategy for combating infectious diseases. In the present studies, we screened a series of 71 arylcarboxylic acid hydrazide derivatives for their ability to induce macrophage tumor necrosis factor α (TNF-α) production and identified 6 such compounds, including one compound previously shown to be a formyl peptide receptor (FPR/FPRL1) agonist. The two most potent compounds [Compound 1: nicotinic acid [5-(3-bromophenyl)-2-furyl]methylene-hydrazide; Compound 2: 4-fluoro-benzoic acid [5-(3-trifluoromethyl-phenyl)-2-furyl]methylene-hydrazide] were selected for further analysis. These compounds induced de novo production of TNF-α in a dose- and time-dependent manner in human and murine monocyte/macrophage cell lines and in primary macrophages. These compounds also induced mobilization of intracellular Ca2+, production of reactive oxygen species, and chemotaxis in human and murine phagocytes. Induction of macrophage TNF-α production was pertussis toxin-sensitive, and analysis of the cellular target of these compounds showed that they were FPRL1-specific agonists and that this response was blocked by FPR/FPRL1 and FPRL1-specific antagonists. Additionally, pharmacophore modeling showed a high degree of similarity for low-energy conformations of these two compounds to the current pharmacophore model for FPR ligands (Edwards et al., 2005). Overall, these compounds represent novel FPRL1 agonists that induce TNF-α, a response distinct from those induced by other known FPR and FPRL1 agonists.
Introduction
Tumor necrosis factor α (TNF-α) is a key cytokine in immune and inflammatory reactions and is important for both innate and adaptive immunity (Beutler, 1995). One of the most prominent characteristics of TNF-α is its ability to cause apoptosis of tumor-associated endothelial cells, resulting in tumor necrosis (Lejeune et al., 2006). However, despite its effectiveness against murine tumors, clinical use of TNF-α has been limited due to its proinflammatory activity (Reed, 2006). On the other hand, stimulation of endogenous TNF-α production is still a reasonable approach in tumor biotherapy, and several compounds have been found to induce TNF-α and inhibit tumor blood flow in experimental tumors, with subsequent induction of necrosis (Baguley, 2001). Bacterial lipopolysaccharide (LPS) is a potent inducer of TNF-α; however, clinical trials with LPS have shown little success in cancer treatment (Engelhardt et al., 1991). As an alternative to LPS, a number of small molecule cytokine inducers have been identified and characterized for their ability to stimulate TNF-α production. For example, both natural and synthetic agents with antimicrobial and antitumor properties, such as imidazoquinolines and taxanes, have been shown to induce a broad range of cytokines in cell culture and/or in vivo (Burkhart et al., 1994;Schön and Schön, 2007). Furthermore, induction of TNF-α by imidazoquinolines has been shown to be mediated through agonist activity toward Toll-like receptor (TLR)-7 and TLR-8 (Schön and Schön, 2007). In contrast, not much is known regarding specific targets of most other reported small molecules that induce phagocyte TNF-α production.
The N-formyl peptide receptors (FPR) are a family of G-protein-coupled receptors (GPCR) involved in host defense and sensing cellular dysfunction [reviewed in (Migeotte et al., 2006)]. FPR are highly promiscuous receptors that can be activated by a wide range of structurally unrelated non-peptide and peptide agonists, including synthetic, or host-derived, and pathogen-derived agents (Migeotte et al., 2006). Three FPR subtypes are present in humans (FPR, FPRL1, FPRL2); whereas, eight FPR-related receptors have been identified in mice (Migeotte et al., 2006). Activation of FPR induces a variety of responses, which are dependent on the agonist, cell type, receptor subtype, and species involved. For example, N-formyl peptides, which are FPR and FPRL1 agonists, induce human phagocyte inflammatory responses, such as intracellular calcium mobilization, production of cytokines, generation of reactive oxygen species (ROS), and chemotaxis (Migeotte et al., 2006). In contrast, lipoxin A4 and related analogues, which are agonists of FPRL1, have been shown to promote resolution of inflammatory processes (Serhan, 2007). Although several non-peptide agonists of FPR/FPRL1 have been identified in recent years (Migeotte et al., 2006), there are currently no known synthetic agonists of FPR/FPRL1 that activate phagocyte TNF-α production.
Recently, we screened a chemolibrary of drug-like molecules for their ability to activate phagocytes and identified several novel small-molecule FPR/FPRL1 agonists (Schepetkin et al., 2007). In the present studies, analysis of the ability of these compounds to induce phagocyte TNF-α production showed that five of these compounds induced modest levels of TNF-α by macrophages. Analysis of analogs for these compounds resulted in the identification of four arylcarboxylic acid hydrazides that potently induced TNF-α production by murine J774.A1 macrophages. Further investigation of the two most potent compounds showed that these agents induced TNF-α production in both human and murine cell lines and primary macrophages. These compounds also induced mobilization of intracellular Ca2+ and activated ROS production by murine macrophages and human neutrophils and activated chemotaxis of human and murine neutrophils. Notably, analysis of the cellular target of these compounds showed that they were FPRL1 agonists and that their effect on TNF-α production was significantly reduced by treatment with pertussis toxin or the FPR/FPRL1 antagonists N-t-butoxycarbonyl-Phe-Leu-Phe-Leu-Phe (Boc-2) and Trp-Arg-Trp-Trp-Trp-Trp-CONH2 (WRW4). Additionally, pharmacophore modeling showed a high degree of similarity for low-energy conformations of these two compounds to the current pharmacophore model for FPR ligands (Edwards et al., 2005). Overall, these compounds represent novel FPRL1 agonists that induce TNF-α, a response distinct from those induced by other known FPR and FPRL1 agonists.
Materials and Methods
Materials
All synthetic small-molecule compounds were obtained from TimTec Inc. (Newark, DE). 8-Amino-5-chloro-7-phenylpyridol [3,4-d]pyridazine-1,4(2H,3H)-dione (L-012) was obtained from Wako Chemicals (Richmond, VA). Actinomycin D (ActD), cycloheximide (CHX), concanavalin A, dimethyl sulfoxide (DMSO), ethylenediaminetetraacetic acid (EDTA), ionomycin, horseradish peroxidase (HRP), N-formyl-Met-Leu-Phe (fMLF), Percoll, 4-(2-hydroxyethyl)-1-piperazineethanesulfonic acid (HEPES), Histopaque 1077, Histopaque 1119, lipopolysaccharide (LPS) from Escherichia coli K-235, genistein, and phorbol 12-myristate 13-acetate (PMA) were purchased from Sigma Chemical Co. (St. Louis, MO). IL-8 and keratinocyte-derived chemokine (KC) were obtained from PeproTech Inc. (Rocky Hill, NJ). Pertussis toxin (PTX), WKYMVm, Go6976, U73122, wortmannin, IKK-2 inhibitor VI, and human GM-CSF were purchased from Calbiochem (San Diego, CA). Fura-2AM was from Molecular Probes (Eugene, OR). The receptor antagonists N-t-butoxycarbonyl-Phe-Leu-Phe-Leu-Phe (Boc-2) and WRWWWW (WRW4) were obtained from Phoenix Pharmaceuticals (Belmont, CA). Dulbecco’s Modified Eagle’s Medium (DMEM) and Hanks' balanced salt solutions (10x), pH 7.4 (10x HBSS) (without phenol red, with and without Ca2+ and Mg2+, HBSS+ and HBSS−, respectively), and enzyme-free cell dissociation buffer were from Invitrogen (Carlsbad, CA). RPMI 1640 media was purchased from Mediatech (Herdon, VA). Percoll stock solution was prepared by mixing Percoll with 10x HBSS at a ratio of 9:1.
Cell Culture
Murine macrophage J774.A1 cells were cultured in DMEM supplemented with 10% (v/v) heat-inactivated fetal bovine serum (FBS), 10 mM HEPES, 100 µg/ml streptomycin, and 100 U/ml penicillin. Cells were grown to confluence in sterile tissue culture flasks and gently detached by scraping. Human monocyte/macrophage MonoMac6 cells (DSMZ, Germany) were cultured in RPMI 1640 supplemented with 10% (v/v) FBS, 10 µg/ml bovine insulin, 100 µg/ml streptomycin, and 100 U/ml penicillin. Rat basophilic leukemia (RBL-2H3) cells transfected with human FPR (RBL-FPR) or FPRL1 (RBL-FPRL1) were cultured in DMEM supplemented with 20% (v/v) FBS, 10 mM HEPES, 100 µg/ml streptomycin, and 100 U/ml penicillin, as described previously (Nanamori et al., 2004). Human monocytic THP-1 cells were cultured in RPMI 1640 medium supplemented with 10% (v/v) FBS, 100 µg/ml streptomycin, and 100 U/ml penicillin. Human monocytic THP1-Blue cells obtained from InvivoGen (San Diego, CA) were cultured in RPMI 1640 medium supplemented with 10% (v/v) FBS, 100 µg/ml streptomycin, 100 U/ml penicillin, 100 µg/ml zeocin, and 10 µg/ml blasticidin S. These cells are stably transfected with a secreted embryonic alkaline phosphatase gene that is under the control of a promoter inducible by nuclear factor κB (NF-κB).
All cultured cells were grown at 37°C in a humidified atmosphere containing 5% CO2. Cell number and viability were assessed microscopically using trypan blue exclusion.
Isolation of Murine Bone Marrow Neutrophils and Peritoneal Macrophages
All animal use was conducted in accordance with a protocol approved by the Institutional Animal Care and Use Committee at Montana State University. Bone marrow leukocytes were flushed from tibias and femurs of BALB/c mice with HBSS− supplemented with 0.1% BSA and 1% glucose and the neutrophils were purified on Percoll density gradients, as previously described (Schepetkin et al., 2007).
Peritoneal macrophages were isolated from BALB/c mice 4 days after intraperitoneal injection of 1 ml saline containing 100 µg concanavalin A. Peritoneal exudate cells were suspended in RPMI 1640 containing 10% (v/v) FBS with antibiotics (penicillin and streptomycin) and incubated at 37°C in 100 mm tissue culture dishes for 1 h. Adherent peritoneal macrophages were harvested and cultured with the compounds under investigation for 24 hr at 37°C and 5% CO2.
Isolation of Human Neutrophils and Monocyte/Macrophages
Blood was collected from healthy donors in accordance with a protocol approved by the Institutional Review Board at Montana State University. Neutrophils were purified from the blood using dextran sedimentation, followed by Histopaque 1077 gradient separation and hypotonic lysis of red blood cells, as described previously (Schepetkin et al., 2007). Isolated neutrophils were washed twice and resuspended in HBSS−. Neutrophil preparations were routinely >95% pure, as determined by light microscopy, and >98% viable, as determined by trypan blue exclusion.
Monocytes were isolated from blood using dextran sedimentation, Histopaque 1077 gradient separation. Adherent monocytes were cultured for 7 days in RPMI-1640 containing 10% FBS and 50 ng/ml GM-CSF to induce macrophage differentiation.
Ca2+ Mobilization Assay
Changes in intracellular Ca2+ were measured with a FlexStation II scanning fluorometer using a FLIPR 3 Calcium Assay Kit (Molecular Devices, Sunnyvale, CA) for human neutrophils and RBL-FPR and RBL-FPRL1 cells or fluorescent dye Fura-2AM for J774.A1 macrophages.
Human neutrophils or transfected RBL cells, suspended in HBSS− containing 10 mM HEPES, were loaded with FLIPR Calcium 3 dye following the manufacturer's protocol. After dye loading, Ca2+ was added to the cell suspension (2.25 mM final), and 100 µl were aliquotted into the wells of a flat-bottom black microtiter plate (2 × 10⁵ cells/well). The compound source plate contained dilutions of test compounds in HBSS+. Changes in fluorescence were monitored (λex = 485 nm, λem = 525 nm) every 5 sec for 240 to 500 sec at room temperature after automated addition of compounds to the cells. Maximum change in fluorescence, expressed in arbitrary units over baseline, was used to determine agonist response. Curve fitting and calculation of median effective concentration values (EC50) were performed by nonlinear regression analysis of the dose-response curves generated using Prism 5 (GraphPad Software, Inc., San Diego, CA).
J774A.1 macrophages suspended in HBSS− containing 10 mM HEPES were loaded with Fura-2AM dye (2 µg/ml final concentration) and incubated for 30 minutes in the dark at 37°C After dye loading, the cells were washed with HBSS− containing 10 mM HEPES, resuspended in 1.5 ml of HBSS+ containing 10 mM HEPES, and aliquotted into the wells of a flat clear-bottom, half-area-well black microtiter plate (6×10⁵ cells/well). The compound source plate contained dilutions of test compounds in HBSS+. Changes in fluorescence were monitored (λex = 340 nm and 380 nm, λem = 510 nm) every 5 sec for 240 to 500 sec at 37°C after automated addition of compounds to the wells. Maximum change in ratio of fluorescence values at excitation wavelengths of 340 and 380 nm was used to determine agonist response. Curve fitting and calculations were performed as above.
Chemotaxis Assay
Neutrophils were suspended in HBSS+ containing 2% (v/v) FBS (2 × 10⁶ cells/ml), and chemotaxis was analyzed in 96-well ChemoTx chemotaxis chambers (Neuroprobe, Gaithersburg, MD), as described previously (Schepetkin et al., 2007). Briefly, lower wells were loaded with 30 µl of HBSS+ containing 2% (v/v) FBS and the indicated concentrations of test compound, DMSO (negative control), 50 nM IL-8 as a positive control for human neutrophils, or 50 nM keratinocyte-derived chemokine (KC) as a positive control for murine neutrophils. The number of migrated cells was determined by measuring ATP in lysates of transmigrated cells using a luminescence-based assay (CellTiter-Glo; Promega, Madison, WI), and luminescence measurements were converted to absolute cell numbers by comparison of the values with standard curves obtained with known numbers of neutrophils. The results are expressed as percentage of negative control and were calculated as follows: (number of cells migrating in response to test compounds/spontaneous cell migration in response to control medium) × 100. EC50 values were determined by nonlinear regression analysis of the dose-response curves generated using Prism 5 software.
Analysis of ROS Production
J774.A1 macrophages were plated at density of 1.5 × 10⁵ cells/well in wells of 96-well flat-bottom white microtiter plates (Corning Incorporated, Costar). After 16 hr (5% CO2, 37°C), the medium was aspirated, and test compounds or vehicle (final DMSO concentration of 1%) were added in fresh media (DMEM without phenol red, supplemented with 3% (v/v) FBS). After 5 min, the medium was replaced with HBSS+ containing 40 µM L-012 and 8 µg/ml HRP, and luminescence was monitored for 120 min (2-min intervals) at 37°C using a Fluroscan Ascent FL microtiter plate reader (Thermo Electron, Waltham, MA). The curve of light intensity (in relative luminescence units) was plotted against time, and the area under the curve was calculated as total luminescence. The percent activation of ROS was calculated as follows: % activation = (sample-DMSO control)/DMSO control × 100. The minimal compound concentration that enhanced ROS production by 50% above background control cells (AC50) was determined by graphing the % activation of ROS vs. log [test compound]. Each curve was determined using five to seven compound concentrations.
Human neutrophils were plated at density of 5×10⁵ cells/well in wells of 96-well flat-bottom white microtiter plates, and compounds under investigation or vehicle (final DMSO concentration of 1%) were added. After 5 min, the media was replaced by HBSS+ containing 40 µM L-012, and luminescence was monitored for 120 min (2-min intervals) at 37°C using a Fluroscan Ascent FL microtiter plate reader. The results were analyzed as described above to determine % activation and AC50 values.
Determination of TNF-α and IL-6
Cells were treated for 24 hr with DMSO control, test compound, or LPS and mouse TNF-α or IL-6 and human TNF-α enzyme-linked immunosorbent assay (ELISA) kits (BD Biosciences Pharmigen) were used to detect these cytokines in the cell supernatants. Cytokine concentrations were determined by extrapolation from TNF-α/IL-6 standard curves, according to the manufacturer’s protocol.
For treatments, cells were plated in 96-well microtiter plates at 2×10⁵ cells/well (J774.A1, MonoMac6) or 6×10⁴ cells/well (human monocyte-derived macrophages) using their respective culture media, except FBS was reduced to 3% (v/v). After incubation overnight (5% CO2, 37°C), the media were removed and replaced with fresh media containing test compounds.
Analysis of NF-κB Activation
Activation of NF-κB was measured using an alkaline phosphatase reporter gene assay in THP1-Blue cells. One week before an experiment, the cells were pre-activated overnight with PMA (50 ng/ml) to induce differentiation and plated in 96-well plates at a cell density of 2×10⁵ cells/well. The cells were then incubated for 5 days with daily media changes. On day 7, compounds under investigation were added, the cells were incubated for 24 hr, and alkaline phosphatase activity was measured in cell supernatants using QUANTI-Blue mix (InvivoGen, San Diego, CA) and monitoring absorbance at 655 nm in a SpectroaMax microplate reader (Molecular Devices, Sunnyvale, CA).
Cytotoxicity Assay
Cytotoxicity was analyzed with a CellTiter-Glo Luminescent Cell Viability Assay Kit (Promega, Inc., Madison, WI), according to the manufacturer’s protocol. Briefly, J774.A1 cells were cultured at a density of 3×10⁴ cells/well with the test compounds for 24 hr at 37°C and 5% CO2, substrate was added, and luminescence signal in the samples was analyzed with a Fluoroscan Ascent FL.
Endotoxin Assay
Endotoxin was measured using Limulus Amebocyte Lysate Pyrogent Plus (Cambrex Bio Science, Walkersville, MD). Briefly, the limulus amebocyte lysate was reconstituted in 250 µl test compound solution (50 µM in endotoxin-free water/1% DMSO), and each vial was incubated at 37°C for 1 hr. At the end of the incubation period, each vial was inverted 180° to estimate gel formation in comparison with control (endotoxin-free water).
Conformational Analysis
For the selected compounds, sets of conformations were generated using the Conformational Search Module, as implemented in HyperChem Version 7.0 (Hypercube, Inc., Waterloo, ON, Canada). The systematic search of conformations for each compound was performed by energy minimization, starting with 2000 initial geometries at random values of torsion angles about exocyclic single bonds and considering that hydrazide C=N fragment can adopt syn- or anti-orientation of substituents. Energy was minimized by the Polak-Ribiere conjugate gradient method with MM+ force field (HyperChem). Attainment of a root-mean-square gradient <0.02 kcal/mol/Å was used as the termination condition for minimization. Conformations were considered equivalent if all the corresponding torsion angles differed by less than 20° among conformations. Results of the conformational search were saved as text files in HCS format adopted in HyperChem. These files were used as input for a computer program that analyzed each conformation and calculated distances between atoms specified by user as potential acceptors of H-bonds or hydrophobic points. We placed the hydrophobic centers in the middle of the benzene rings in Compound 2 and in the geometric gravity center of the bromophenyl group in Compound 1; whereas, the acceptors were positioned at fluorine atoms, pyridine and double-bonded hydrazide nitrogens, and carbonyl and furan oxygen atoms, which are known as H-bond acceptors. The distances calculated for all possible triads of the two H-bond acceptors and single hydrophobic center among all the conformations found were compared with those in the pharmacophore model published previously by Edwards et al. (Edwards et al., 2005). The value of ε was calculated as root-mean-square relative deviation of the distances obtained from the center of corresponding tolerance intervals [A1–A2 (3–6 Å, A1–H (5–7 Å), and A2–H (4–7 Å], as determined by Edwards et al. (Edwards et al., 2005).
Statistical Analysis
One way analysis of variance (ANOVA) was performed on the indicated sets of data, followed by Tukey’s pair-wise comparisons (GraphPad Prism Software, San Diego, CA). Pair-wise comparisons with differences at P<0.05 were considered to be statistically significant.
Results
Identification of TNF-α Inducers
Previously, we screened a chemolibrary of drug-like molecules for their ability to activate reactive oxygen species (ROS) production by phagocytes and identified 26 such agonists [designated here as agonists (AG) 1–26] (Schepetkin et al., 2007). In the present studies, we evaluated whether these compounds also induced phagocyte TNF-α production and found that five compounds induced modest levels of TNF-α production by murine J774.A1 macrophages (Compounds AG-1, -3, -8, -14, and -15). Since the two most potent compounds (AG-3 and AG-14) are both arylcarboxylic acid hydrazides (see Supplemental Table S1), we focused on this scaffold and selected analogs for each of these two agonists for further screening. Forty-one analogs of AG-3 and 28 derivatives of AG-14 were selected to obtain a pool of 71 compounds for secondary screening (Supplemental Table S1). Analysis of these analogs for their ability to stimulate TNF-α production identified 22 additional compounds with various levels of activity (Table 1 and Supplemental Table S1). Determination of dose-response relationships for all 24 selected compounds showed that six compounds were quite active and induced TNF-α production by J774.A1 macrophages in a concentration-dependent manner (Table 1 and Figure 1A). Compounds 1 and 2 were the most active, inducing ~50% of the TNF-α levels that were induced by the EC50 concentration of LPS (2 ng/ml). Activation was not due to LPS contamination, however, as analysis of Compounds 1 and 2 for LPS using a limulus amebocyte lysate assay showed that these compounds contained no endotoxin (below detection limit; data not shown). TNF-α production was induced in a time-dependent manner by Compounds 1 and 2 (Figure 1B); whereas, treatment with these compounds had no effect on cell viability, indicating lack of cytotoxicity (Supplemental Figure S1). Thus, further studies focused primarily on Compounds 1 and 2.
TABLE 1.
Chemical structures of the most potent TNF-α inducers.
| Compound Number | Structure |
|---|---|
| 1 | |
| 2 | |
| 3 | |
| 4 | |
| 5 | |
| AG-14 |
Figure 1.

Effect of selected arylcarboxylic acid hydrazides on TNF-α production by murine J774.A1 macrophages. Panel A: Macrophages (2×10⁵ cells/well) were cultured in the presence buffer (0) or the indicated concentrations of Compound 1 (●), 2 (○), 3 (■), 4 (□), 5 (◆), AG-14 (△), or LPS (2 ng/ml) (◇) for 24 hr, and TNF-α was measured in the cell supernatants by ELISA. Panel B: Macrophages (2×10⁵ cell/well) were cultured in the presence of the 12.5 µM Compound 1 (●), 2 (○), of DMSO (■) for the indicated times, and TNF-α was measured in the cell supernatants by ELISA. The data in both panels are presented as the mean±SD of triplicate samples from one experiment, which is representative of three independent experiments.
To determine whether the up-regulation of TNF-α production represented new protein synthesis, J774.A1 macrophages were treated with actinomycin D (ActD) to inhibit transcription or cycloheximide (CHX) to inhibit protein synthesis prior to treatment with active compounds. As shown in Figure 2, treatment with either ActD or CHX completely inhibited TNF-α production induced by Compounds 1 and 2. These results indicate that transcription and de novo protein synthesis are required for the TNF-α secretion induced by these arylcarboxylic acid hydrazides.
Figure 2.

Effect of actinomycin D and cycloheximide on Compound-induced TNF-α production by J774.A1 macrophages. J774.A1 macrophages were pretreated with actinomycin D (ActD; 1 µg/ml), cycloheximide (CHX; 5 µg/ml), or control DMSO for 30 min, followed by addition of 50 µM Compound 1 (open bars) or 2 (solid bars) for 12 hr. TNF-α was measured in the cell supernatants by ELISA. The data are presented as the mean±SD of triplicate samples from one experiment, which is representative of three independent experiments.
To investigate the effect of Compounds 1 and 2 on TNF-α production in macrophages of different lines and species, murine peritoneal macrophages, human monocyte/macrophage cells (THP-1 and MonoMac6), and human monocyte-derived macrophages were stimulated with various concentrations of these compounds. Both compounds induced TNF-α production in a concentration-dependent manner in murine, as well as in human cells (Figure 3). Note, however, that there was a wide range in the level of TNF-α produced by the various cell lines. Furthermore, Compound 2 generally had much higher activity in human cells; whereas, Compound 1 was more potent in activating murine cells. To determine whether the most potent TNF-α inducers could also induce interleukin 6 (IL-6) production, we evaluated levels of IL-6 produced by J774.A1 cells treated with Compounds 1 and 2. As shown in Figure 4, both compounds induced secretion of IL-6, with Compound 1 being the more potent of the two. In comparison, Compounds 3–5 and AG-14 all failed to induce macrophage IL-6 production (data not shown).
Figure 3.

Analysis of TNF-α production induced by Compounds 1 and 2 in murine peritoneal macrophages, human monocytic cells THP-1, human MonoMac6 macrophages, and human monocyte-derived macrophages. The indicated cells were incubated with buffer (0) or the indicated concentrations of Compound 1 (○), 2 (●), or LPS (50 ng/ml) (◆) for 24 hr, and TNF-α was measured in the cell supernatants by ELISA. The data are presented as the mean±SD of triplicate samples from one experiment, which is representative of three independent experiments.
Figure 4.

Effect of Compounds 1 and 2 on IL-6 production in murine J774.A1 macrophages. Macrophages (2×10⁵ cells/well) were cultured in the presence of Compound 1 (○), 2 (●), or LPS (50 ng/ml) (◆) for 24 hr, and TNF-α was measured in the cell supernatants by ELISA. Background due to control DMSO was negligible (not shown). The data are presented as the mean±SD of triplicate samples from one experiment, which is representative of three independent experiments.
Effect of TNF-α Inducers on Phagocyte Chemotaxis and ROS Production
Previously, we found that treatment of phagocytes with two arylcarboxylic acid hydrazides (AG-14 and AG-104) stimulated phagocyte chemotaxis (Schepetkin et al., 2007). Thus, we evaluated the effects of Compounds 1 and 2 on this response in murine and human phagocytes. Both of these compounds were found to be neutrophil chemoattractants and dose-dependently induced human as well as murine neutrophil migration (Supplemental Figure S2), although the magnitude of these responses was generally lower than that induced by IL-8 or KC for human and murine neutrophils, respectively (Table 2). In comparison, maximal chemotaxis toward Compound AG-14 was equal to or much higher than the response induced by 50 nM IL-8 or KC, respectively. Note that the dose-response curves for murine neutrophil chemotaxis were bell-shaped; whereas, the chemotactic responses of human neutrophils increased with increasing dose of compounds up to the maximal dose tested (Supplemental Figure S2).
TABLE 2.
Effect of the most potent TNF-α inducers on Ca2+ mobilization, chemotaxis, and ROS production in human polymorphonuclear leukocytes (PMN) and murine J774.A1 macrophages (Mϕ)
| Compound | Ca2+ Mobilization EC50 (µM) | Chemotaxis (%)a | ROS Production AC50 (µM) | |||
|---|---|---|---|---|---|---|
| Human PMN | Murine Mϕ | Human PMN | Murine PMN | Human PMN | Murine Mϕ | |
| 1 | 0.3±0.2 | 24.1±4.1 | 67.8±9.4 | 68.9±7.8 | 0.2±0.02 | 25.4±4.0 |
| 2 | 0.6±0.4 | 2.3±0.15 | 91.3±1.6 | 58.0±1.4 | 0.2±0.04 | 8.6±2.7 |
| AG-14 | 0.63±0.39 | 4.2±0.8 | 98.0±3.4 | 174.8±9.2 | 38.6±3.3 | 26.9±3.9 |
Chemotactic responses are expressed as percent of response induced by 50 nM IL-8 or 50 nM KC in human and murine neutrophils, respectively.
Analysis of the ability of Compounds 1 and 2 to activate ROS production in human neutrophils and murine J774.A1 macrophages showed that these compounds dose-dependently stimulated ROS generation in both types of cells, with AC50 values in the high nM to low µM range (Figure 5 and Table 2). Likewise, Compound AG-14 activated phagocyte ROS production, which was consistent with our previous analysis of this compound (Schepetkin et al., 2007).
Figure 5.

Effect of Compounds 1 and 2 on ROS production by human neutrophils. Human neutrophils were treated with the indicated concentrations of Compound 1 (○), 2 (●), or PMA (50 nM) for 5 min, and luminescence was monitored for 120 min at 37°C, as described. The data are presented as the mean±SD of triplicate samples from one experiment, which is representative of three independent experiments.
Effect of TNF-α Inducers on Ca2+ Mobilization in Neutrophils and Macrophages
All 71 selected arylcarboxylic acid hydrazides were evaluated for their ability to induce Ca2+ mobilization in human neutrophils. From this screening, we found that 30 of the 71 compounds induced Ca2+ mobilization in neutrophils with EC50 values ≤32 µM (Supplemental Table S1), although there was not a consistent correlation between the ability to induce TNF-α production and stimulate Ca2+ flux. Nevertheless, the most potent TNF-α inducers (Table 1 and Supplemental Table S1) also activated Ca2+ mobilization in human neutrophils. As shown in Figure 6A, Compounds 1 and 2 induced transient increases in [Ca2+]i that were similar to those induced by fMLF.
Figure 6.

Effect of Compounds 1 and 2 on [Ca2+]i mobilization in human neutrophils and J774.A1 macrophages. Panel A: Human neutrophils were labeled with FLIPR Calcium 3 dye, and changes in fluorescence were monitored after addition of Compound 1 (25 µM) , 2 (50 µM), fMLF (5 nM), or control DMSO (grey line). The data are from one experiment, which is representative of three independent experiments. Panel B: Macrophages loaded with Fura-2AM dye were treated with Compound 1 (○) or 2 (●), and changes in fluorescence were monitored (λex = 340 nm and 380 nm, λem = 510 nm). The data are presented as the mean±SD of triplicate samples from one experiment, which is representative of three independent experiments.
Previous reports indicated that Ca2+ mobilization is required for TNF-α production in macrophages stimulated by various agents [e.g., (Watanabe et al., 1996)]. Thus, we examined the effect of Compounds 1 and 2 on Ca2+ mobilization in J774.A1 macrophages. As shown in Figure 6B, treatment of J774.A1 macrophages with Compounds 1 and 2 dose-dependently increased [Ca2+]i, and calculated EC50 values for these compounds, as well as Compound AG-14, are shown in Table 2. By comparison, fMLF was much less potent (EC50 > 30 µM). As a positive control, the Ca2+ ionophore ionomycin increased [Ca2+]i within these cells (EC50 = 0.58±0.3 µM). A substantial Ca2+ response to fMLF could not be obtained due to the limited solubility of fMLF; however, this result is consistent with previous studies showing mouse cells only express low affinity receptors for fMLF (Gao et al., 1998).
TNF-α Inducers Activate Ca2+ Mobilization through FPR or FPRL1
Previously, we demonstrated that Compound AG-14 activated neutrophils through stimulation of FPR/FPRL1, although the receptor subtype specificity was not evaluated (Schepetkin et al., 2007). Thus, we analyzed whether Compounds 1 and 2 were also FPR/FPRL1 agonists. In addition, we evaluated receptor subtype specificity for these two compounds, as well as for Compound AG-14, using RBL-2H3 cells transfected with human FPR (RBL-FPR cells) or FPRL1 (RBL-FPRL1 cells) (Nanamori et al., 2004). Both Compounds 1 and 2 induced a dose-dependent increase of [Ca2+]i in RBL-FPRL1 cells; whereas, no response was observed in wild-type or RBL-FPR cells treated with either of these compounds (Figure 7 and Table 3). In comparison, Compound AG-14 induced a dose-dependent increase of [Ca2+]i in RBL-FPR cells but had no effect on wild-type or RBL-FPRL1 cells (Figure 7C and Table 3). Thus, these data indicate Compounds 1 and 2 are novel FPRL1-specific agonists, while Compound AG-14 is specific for FPR.
Figure 7.

Analysis of receptor specificity for activation of [Ca2+]i mobilization by selected compounds. Panels A and B: RBL-FPR (Panel A) and RBL-FPRL1 (Panel B) cells were incubated with FLIPR Calcium 3 dye and the indicated concentrations of Compound 1 (●), 2 (○), or AG-14 (△), and [Ca2+]i flux was monitored for 5 min. Background due to control DMSO was negligible (not shown). The responses are presented as percent of response induced by EC50 doses of fMLF (5 nM) or WKYMVm (10 pM) in RBL-FPR and RBL-FPRL1 cells, respectively. The data are representative of three independent experiments. Panel C: RBL-FPRL1 cells were labeled with FLIPR Calcium 3 dye, and changes in fluorescence were monitored after addition of Compound 1 (50 µM), 2 (50 µM), fMLF (5 nM), WKYMVm (50 pM), or control DMSO. The data are from one experiment, which is representative of three independent experiments.
TABLE 3.
Effect of selected compounds on Ca2+ mobilization in RBL-2H3 cells transfected with human FPR (RBL-FPR cells) or FPRL1 (RBL-FPRL1 cells).
| Compound | Ca2+ Mobilization EC50 (µM) | ||
|---|---|---|---|
| RBL-FPR | RBL-FPRL1 | WT-RBLb | |
| 1 | N.A.a | 19.1 | N.A. |
| 2 | N.A. | 18.3 | N.A. |
| AG-14 | 6.6 | N.A. | N.A. |
N.A., not active. No response was observed during first the 3 min after addition of compounds under investigation.
WT, wild-type non-trasfected RBL-2H3 cells.
FPRL1 is a G-protein coupled receptor (GPCR) and signals through pertussis toxin (PTX)-sensitive heterotrimeric G-proteins (Gi/Go) [reviewed in (Migeotte et al., 2006)]. Thus, we evaluated the effects of PTX on TNF-α production induced by Compounds 1 and 2. As shown in Figure 8A, PTX significantly inhibited the production of TNF-α induced by both Compounds 1 and 2. In comparison, PTX had little or no effect on the LPS-induced TNF-α response. This observation is consistent with previous studies showing PTX failed to block LPS-induced production of TNF-α or other cytokines by macrophages [e.g., (Zhang and Morrison, 1993)]. As a control to verify the effectiveness of PTX, we evaluated the effect of PTX on [Ca2+]i mobilization in human neutrophils treated with fMLF and our compounds. Consistent with previous reports (Kelher et al., 2003), PTX inhibited the Ca2+ flux induced by fMLF (Supplemental Figure S3). Likewise, PTX significantly inhibited [Ca2+]i mobilization induced by Compounds 1 and 2 (Supplemental Figure S3). Additionally, cell viability was not significantly affected in cells treated with PTX (data not shown). Thus, these results provide further evidence that Compounds 1 and 2 are indeed FPRL1 agonists.
Figure 8.

Characterization of TNF-α production induced by Compounds 1 and 2 in murine macrophages. Panel A: J774.A1 macrophages (2×10⁵ cells/well) were pretreated for 30 min with control buffer (0) or PTX (0.4 and 1 µg/ml), followed by the addition of Compound 1 (50 µM), 2 (50 µM), or LPS (50 ng/ml) for 12 hr, and TNF-α was measured in the cell supernatants by ELISA. Statistically significant differences (*P<0.001) between responses induced in PTX-pretreated versus DMSO-pretreated controls are indicated. Panel B: Macrophages (2×10⁵ cells/well) were cultured in the presence of control DMSO, fMLF (50 µM), WKYMVm (50 µM), or Compound 1 (25 µM) for 24 hr, and TNF-α was measured in the cell supernatants by ELISA. Panel C: Macrophages (2×10⁵ cells/well) were pretreated for 5 min with control DMSO, Boc-2 (40 µM), or WRW4 (10 µM), followed by the addition of Compound 1 (50 µM), 2 (50 µM), or LPS (50 ng/ml) for 24 hr, and TNF-α was measured in the cell supernatants by ELISA. Statistically significant differences (*P<0.001) between responses induced by LPS or Compounds 1 and 2 in Boc-2- or WRW4-pretreated versus vehicle-pretreated controls are indicated. The data in all panels are presented as the mean±SD of triplicate samples from one experiment, which is representative of three independent experiments.
The ability to induce TNF-α production via the FPR or FPRL1 pathways was quite specific to the compounds we identified here, as both of the peptide agonists, fMLF and WKYMVm, failed to induce macrophage TNF-α production (Figure 8B). However, these results did not rule out the possibility that Compounds 1 and 2 could be activating TNF-α production through a different pathway in these cells. To address this issue, we evaluated the effects of Boc-2, an antagonist of FPR/FPRL1 (Gavins et al., 2003) and WRW4, an antagonist of FPRL1 (Bae et al., 2004). As shown in Figure 8C, both antagonists inhibited TNF-α production induced by Compound 1 and Compound 2 in J774.A1 macrophages, directly demonstrating that both compounds were inducing TNF-α production through FPRL1.
Since TNF-α production can be activated via the NF-κB pathway, we considered whether the ability of these agonists to stimulate TNF-α production might be related to the amplitude of NF-κB induction. Using a transcription factor-based bioassay for NF-κB activation in human THP-1 monocytes, we found that Compounds 1, 2, and AG-14, as well as fMLF and WKYMVm, all stimulated NF-κB activity at comparable levels to each other (Supplemental Figure S4). Note, however, that NF-κB activation by these agonists was still much lower than that induced by LPS (Supplemental Figure S4). Thus, the ability of a given FPR/FPRL1 agonist to induce TNF-α production does not appear to be due to differential induction of NF-κB.
Phagocyte stimulation by FPRL1 agonists activates a number of intracellular signaling pathways in addition to the NF-κB pathway, including those involving phospholipase C, phosphatidylinositol 3-kinase, protein kinase C, and tyrosine kinases [reviewed in (Migeotte et al., 2006)]. Thus, we evaluated the role of these pathways in Compound 1- and 2-induced TNF-α production using specific pathway inhibitors. Interestingly, pretreatment of J774.A1 macrophages with a phospholipase C inhibitor (U73122), a phosphoinositide 3-kinase inhibitor (wortmannin), a tyrosine kinase inhibitor (genistein), a protein kinase C α/β inhibitor (Go6976), or an inhibitor κB kinase 2 (IKK-2) inhibitor (IIK-2 inhibitor-VI) significantly inhibited TNF-α production induced by both Compound 1 and 2, as well as by LPS (Supplemental Figure S5). In contrast, the LPS response was not affected by PTX pretreatment (Figure 8 and Supplemental Figure S5). Note that cell viability was not significantly altered in cells treated with these concentrations of inhibitors, and the inhibitors alone did not induce any TNF-α secretion (data not shown).
Molecular Modeling
Previously, Edwards et al. (Edwards et al., 2005) developed a pharmacophore model for FPR ligands that was based on docking of known receptor agonists and antagonists onto a homology model of the receptor. This model, which contains two acceptors for H-bonding and one hydrophobic point, was used previously to demonstrate the low-energy conformations of six small-molecule neutrophil agonists, including AG-14, fit structural requirements for ligand bioactivity (Schepetkin et al., 2007). Visual inspection of structures of Compounds 1 and 2 showed that each of these compounds contained several potential acceptors for H-bonding and at least one hydrophobic center. Thus, we evaluated whether Compounds 1 and 2 also fit with this pharmacophore model.
Considering that these compounds are flexible molecules, we explored their potential energy surfaces using a conformational search with an MM+ force field, and the conformations within an energy gap of 6 kcal/mol over the global minimum (Nicklaus et al., 1995) were stored. The numbers of nonequivalent conformations within 6 kcal/mol of the global minimum found for Compounds 1 and 2 were 90 and 120, respectively. Best-fit conformations for these compounds, together with calculated distances, best root-mean-square (RMS) fit (ε), and conformational energy are shown in Figure 9. The most active compound (Compound 1) had two conformations that fit quite well into the pharmacophore model. Distances A1–H and A2–H in the conformation with the lowest RMS fit were essentially equivalent (Figure 9), hence an additional good fit (ε=4.3%) is possible for this same conformation by switching the two H-bond acceptors such that A1 is now the pyridine nitrogen and A2 is the carbonyl oxygen. The next fit of lower quality (ε=9.1%) corresponded to a conformation with the same location of A2 and H as shown in Figure 9, but with A1 located on the double-bonded hydrazide nitrogen. The best fit for Compound 2 (ε=4.5%) also was well within the tolerance range reported for the ligand pharmacophore (Edwards et al., 2005).
Figure 9.
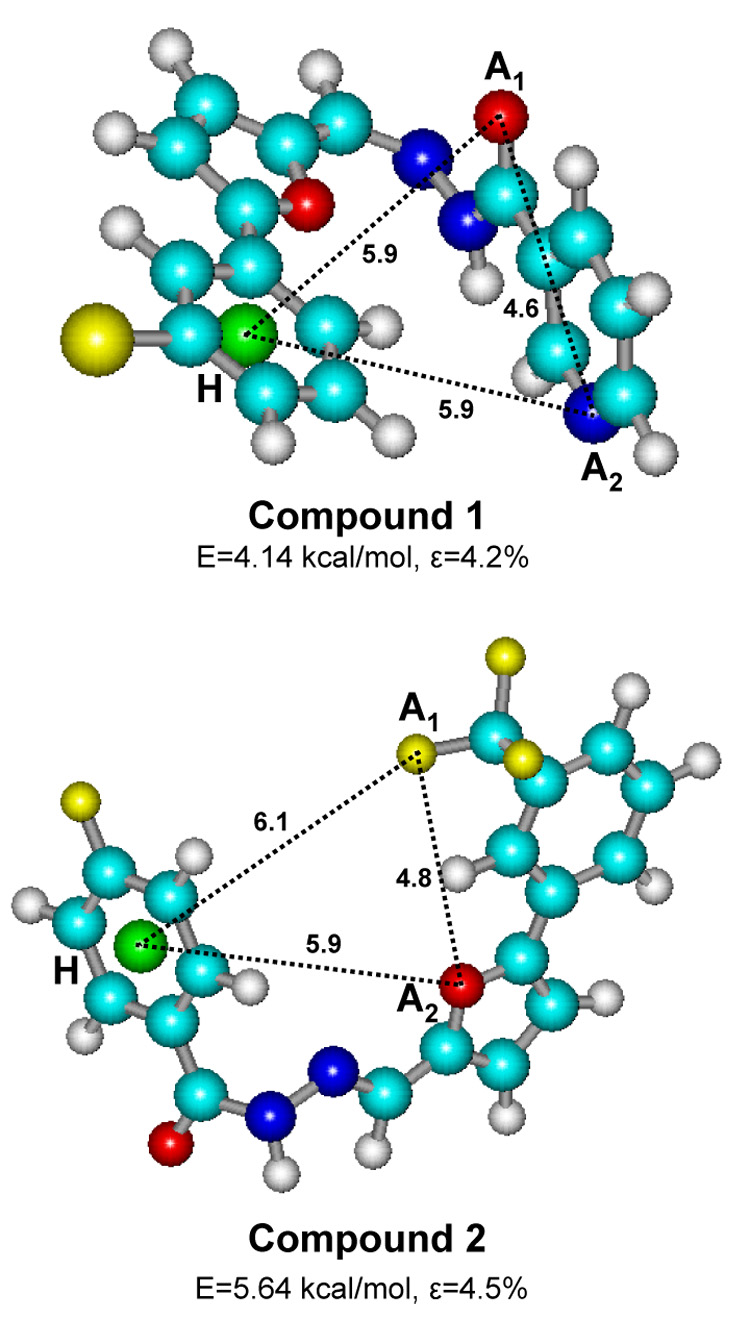
Comparison of best-fit conformations of compounds 1 and 2 with the published three-point pharmacophore model of FPR ligands. The conformations shown represent the best root-mean-square fit (ε) among all energy minima 6 kcal/mol above the global minimum. A1, A2, and H are the pharmacophore centers corresponding to the H-bond acceptors (A1 and A2) and hydrophobic center (pseudoatom H, green sphere), with permitted distances (Å) between points as follows: A1–A2 (3–6 Å), A1–H (5–7 Å), and A2–H (4–7 Å) (Edwards et al., 2005). For all structures, carbon atoms are sky-blue, nitrogen atoms are blue, oxygen atoms are red, hydrogen atoms are white, fluorine atoms are small yellow, and bromine are large yellow spheres.
Discussion
Phagocytic cells play a key role in innate immunity because of their ability to recognize, ingest, and destroy pathogens by oxidative and non-oxidative mechanisms (Tosi, 2005). These responses are modulated by a variety of extrinsic factors, including bacterial products, lipids, cytokines, and chemokines, and it is now apparent that the nature of a given inflammatory response represents an interplay between pro-inflammatory and anti-inflammatory immune modulators (Gordon, 2007). Since one of the key factors regulating phagocyte inflammatory responses is TNF-α, we screened a library of chemically-related compounds to identify unique small-molecule activators of phagocyte TNF-α production.
In primary screening, we identified two lead compounds with modest activity. Since these compounds were both arylcarboxylic acid hydrazides, we used this chemical scaffold to select additional analogs for secondary screening, and the two most potent arylcarboxylic acid hydrazides were selected for further characterization. The array of neutrophil responses induced by these compounds suggested that they were possibly GPCR agonists. Indeed, our previous study showed that a related compound (AG-14) was an FPR/FPRL1 agonist (Schepetkin et al., 2007). Thus, we considered whether Compounds 1 and 2 might also be FPR/FPRL1 agonists, albeit unique because none of the known FPR/FPRL1 agonists have been reported to induce TNF-α production, and neither fMLF, nor WKYMVm, was able to induce macrophage TNF-α production. In fact, it has been reported that fMLF can actually inhibit TNF-α production by LPS-stimulated neutrophils (Vulcano et al., 1998).
To directly evaluate whether Compounds 1 and 2 were FPR/FPRL1 agonists, we studied their ability to induce [Ca2+]i mobilization in cells expressing either FPR or FPRL1. Compounds 1 and 2 dose-dependently activated [Ca2+]i mobilization only in cells expressing FPRL1, but not in wild-type cells or cells expressing FPR. In contrast, Compound AG-14 activated [Ca2+]i mobilization only in cells expressing FPR, which may help to explain the differences in responses induced by this compound versus Compounds 1 and 2. Thus, although these three compounds are all arylcarboxylic acid hydrazides, their receptor subtype specificity is clearly distinct. Furthermore, a general FPR/FPRL1 antagonist and a specific FPRL1 antagonist were both found to block TNF-α induction by Compounds 1 and 2, providing direct evidence that this response was mediated through FPRL1. Note, however, that we have not performed an analysis of all possible GPCRs and cannot rule out the possibility that additional GPCRs might also be involved. Since neither of the three compounds induced [Ca2+]i mobilization in wild-type RBL cells, our results do indicate that these agonists do not activate other endogenous GPCRs in RBL cells.
Pharmacophore modeling is based on the premise that all ligands of a given target bind in a conformation that presents similar steric and electrostatic features to the target receptor, and these features are recognized by the receptor and are responsible for biological activity (Guner et al., 2004). The pharmacophore model used here was developed based on the bovine rhodopsin crystal structure and known FPR ligands (Edwards et al., 2005). Our molecular modeling showed a high degree of similarity for low-energy conformations of Compounds 1 and 2 to this previously published pharmacophore model, demonstrating a good agreement between biological activity and the presence of low-energy, best-fit conformations of the compounds with the model. Although our previous conformational analysis showed that one FPRL1 agonist, Quin-C1, did not fit well into the pharmacophore model (Schepetkin et al., 2007), the present results indicate that the model is not specific only for FPR ligands and that some FPRL1 agonists also fit into the model. Overall, pharmacophore modeling provided further support that these compounds do indeed fit the molecular features required for FPR/FPRL1 agonists. Currently, there is very little information on the structure of FPRL1. Thus, we suggest that the arylcarboxylic acid hydrazides reported here and additional analogs may be exploited in the future to probe the requirements for ligand interaction and receptor activation.
Collectively, our data support the conclusion that Compounds 1 and 2 activate FPRL1 to induce intracellular signaling events, leading to a number of host defense/inflammatory responses, including the stimulation of TNF-α production in macrophages. Note, however, that these compounds must activate distinct arrays of signaling pathways, since the standard peptide agonists of FPR/FPRL1 failed to induce TNF-α production. The ability of FPR/FPRL1 agonists to induce TNF-α production requires NF-κB but does not seem to be related to the relative level of NF-κB activation. Thus, activation of phagocyte TNF-α production by Compounds 1 and 2 likely includes additional transcriptional regulatory pathways independent of NF-κB. Analysis of additional signal transduction pathways involved in phagocyte activation by Compounds 1 and 2 implicated a number of pathways known to be involved in FPR/FPRL1 stimulation, including pathways involving phospholipase Cβ, phosphatidylinositol 3-kinase γ, protein kinase C, and protein tyrosine kinase [reviewed in (Migeotte et al., 2006)]. Inhibition of all four of these pathways blocked TNF-α production induced by both our compounds, as well as LPS. Thus, similar intercellular signaling components seem to be involved in responses induced by these agonists, although they activate the cell through quite different receptor systems (i.e., FPR/FPRL1 versus TLR4). Clearly, further studies are required to define the nature of the signaling pathways involved in activation of TNF-α production by the arylcarboxylic acid hydrazide derivatives described here, and these studies are in progress.
Previously, various natural and synthetic small-molecules have been shown to induce macrophage TNF-α production [e.g., (Burkhart et al., 1994;Schön and Schön, 2007)]. However, the non-peptide synthetic substances currently known to activate macrophage TNF-α production have been shown to be Toll-like receptor (TLR) agonists (Byrd-Leifer et al., 2001;Schön and Schön, 2007). Thus, the compounds described here are unique in their ability to activate this response via a GPCR. On the other hand, compounds with this scaffold have been reported among agents with antitumor (Boykin, Jr. and Varma, 1970), proapoptotic (Zhang et al., 2004), antiprion (Bertsch et al., 2005), analgesic (Almasirad et al., 2006), and antioxidant (Simunek et al., 2005) properties. Hence, our findings suggest the possibility that the antitumor and proapoptotic effects reported for arylcarboxylic acid hydrazides could be due, in part, to activation of TNF-α production. Indeed, FPR/FPRL1 has been reported to be expressed on human tumor cells, including malignant human glioma cell lines, primary glioblastomas and anaplastic astrocytomas, and epithelial cancer cells, and it has been suggested that this receptor contributes to motility, growth, and angiogenesis (Le et al., 2000;Rescher et al., 2002;Zhou et al., 2005;Huang et al., 2007). In addition, transduction of human FPRL1 into murine tumor cells has been reported to increase host anti-tumor immunity, although this was not due to an antibody response to the foreign antigen, as anti-FPRL1 antibodies were not found (Hu et al., 2005). One possibility suggested by the present studies is that expression of FPRL1 in these tumor cells could result in responsiveness to endogenous agonists that induce TNF-α production, which would lead to tumor cell apoptosis and destruction (Lejeune et al., 2006;Reed, 2006). The compounds described here induce much lower levels of TNF-α than LPS, and TNF-α production occurs gradually over an extended period of time, rather than the rapid and maximal response induced by LPS. Thus, the moderate responses induced by these compounds may alleviate the inflammatory toxicity associated with very strong agonists, such as LPS, and in vivo testing is currently in progress to address this issue.
FPRL1 is a highly promiscuous receptor and responds to a wide array of exogenous and endogenous ligands [reviewed in (Migeotte et al., 2006)]. Likewise, the array of responses induced by these ligands is varied, and the intracellular signals that are activated depend on the ligand, ligand concentration, and cellular features. For example, stimulation of FPRL1 with lipoxin A4 and/or annexin 1/annexin 1-derived peptides leads to anti-inflammatory responses (Perretti et al., 2002;Serhan, 2007). Conversely, inflammatory responses are induced by a number of the other FPRL1 agonists, including N-formyl peptides, cathelicidin antibacterial peptide LL37, the truncated chemokine sCKβ8-1, and pituitary adenylate cyclase-activating polypeptide 27 [reviewed in (Migeotte et al., 2006)]. Here, we describe an additional class of FPRL1 agonists that induce a unique response. However, given the wide range of responses induced by FPRL1 agonists so far, it is not surprising that additional responses, such as the induction of TNF-α production shown here, will eventually be identified as novel ligands for this receptor are found in future screening of compound analogs.
The wide range of agonists and responses of FPRL1 suggests that this receptor may represent a unique target for therapeutic drug design. Here, we identified and characterized specific FPR/FPRL1 agonists that not only have a novel structure but also induce a novel response not seen before with any of the known FPR/FPRL1 agonists. Thus, further development of this class of agonists and analysis of additional derivatives may provide important clues to understanding FPR and FPRL1 structure and function. Additionally, FPR/FPRL1 agonists have potential value as immune modulators to enhance phagocyte host defense against pathogens and as possible vaccine adjuvants.
Supplementary Material
Abbreviations
- ActD
actinomycin D
- CHX
cycloheximide
- DMEM
Dulbecco’s modified Eagle’s medium
- DMSO
dimethyl sulfoxide
- EDTA
ethylenediaminetetraacetic acid
- FBS
fetal bovine serum
- fMLF
N-formyl-Met-Leu-Phe
- FPR
formyl peptide receptor
- FPRL1
formyl peptide receptor-like 1
- GM-CSF
granulocyte-macrophage colony stimulating factor
- GPCR
G protein-coupled receptor
- HBSS
Hank’s balanced-salt solution
- HEPES
4-(2-hydroxyethyl)-1-piperazineethanesulfonic acid
- HRP
horseradish peroxidase
- IL-6
interleukin 6
- KC
keratinocyte-derived chemokine
- LPS
lipopolysaccharide
- PMN
polymorphonuclear leukocytes
- PTX
pertussis toxin
- RBL
rat basophilic leukemia
- ROS
reactive oxygen species
- TLR
toll-like receptor
- TNF-α
tumor necrosis factor α
Footnotes
This work was supported in part by Department of Defense grant W9113M-04-1-0001, National Institutes of Health grants P20 RR-020185 and U54 AI-065357, National Institutes of Health contract HHSN266200400009C, an equipment grant from the M.J. Murdock Charitable Trust, and the Montana State University Agricultural Experimental Station. The U.S. Army Space and Missile Defense Command, 64 Thomas Drive, Frederick, MD 21702 is the awarding and administering acquisition office. The content of this report does not necessarily reflect the position or policy of the U.S. Government.
References
- Almasirad A, Hosseini R, Jalalizadeh H, Rahimi-Moghaddam Z, Abaeian N, Janafrooz M, Abbaspour M, Ziaee V, Dalvandi A, Shafiee A. Synthesis and Analgesic Activity of 2-Phenoxybenzoic Acid and N-Phenylanthranilic Acid Hydrazides. Biol Pharm Bull. 2006;29:1180–1185. doi: 10.1248/bpb.29.1180. [DOI] [PubMed] [Google Scholar]
- Bae YS, Lee HY, Jo EJ, Kim JI, Kang HK, Ye RD, Kwak JY, Ryu SH. Identification of Peptides That Antagonize Formyl Peptide Receptor-Like 1-Mediated Signaling. J Immunol. 2004;173:607–614. doi: 10.4049/jimmunol.173.1.607. [DOI] [PubMed] [Google Scholar]
- Baguley BC. Small-Molecule Cytokine Inducers Causing Tumor Necrosis. Curr Opin Investig Drugs. 2001;2:967–975. [PubMed] [Google Scholar]
- Bertsch U, Winklhofer KF, Hirschberger T, Bieschke J, Weber P, Hartl FU, Tavan P, Tatzelt J, Kretzschmar HA, Giese A. Systematic Identification of Antiprion Drugs by High-Throughput Screening Based on Scanning for Intensely Fluorescent Targets. J Virol. 2005;79:7785–7791. doi: 10.1128/JVI.79.12.7785-7791.2005. [DOI] [PMC free article] [PubMed] [Google Scholar]
- Beutler B. TNF, Immunity and Inflammatory Disease: Lessons of the Past Decade. J Invest Med. 1995;43:227–235. [PubMed] [Google Scholar]
- Boykin DW, Jr, Varma RS. Benzylidene Hydrazides As Potential Anticancer Agents. J Med Chem. 1970;13:583–584. doi: 10.1021/jm00297a072. [DOI] [PubMed] [Google Scholar]
- Burkhart CA, Berman JW, Swindell CS, Horwitz SB. Relationship Between the Structure of Taxol and Other Taxanes on Induction of Tumor Necrosis Factor-Alpha Gene Expression and Cytotoxicity. Cancer Res. 1994;54:5779–5782. [PubMed] [Google Scholar]
- Byrd-Leifer CA, Block EF, Takeda K, Akira S, Ding A. The Role of MyD88 and TLR4 in the LPS-Mimetic Activity of Taxol. Eur J Immunol. 2001;31:2448–2457. doi: 10.1002/1521-4141(200108)31:8<2448::aid-immu2448>3.0.co;2-n. [DOI] [PubMed] [Google Scholar]
- Edwards BS, Bologa C, Young SM, Balakin KV, Prossnitz ER, Savchuck NP, Sklar LA, Oprea TI. Integration of Virtual Screening With High-Throughput Flow Cytometry to Identify Novel Small Molecule Formylpeptide Receptor Antagonists. Mol Pharm. 2005;68:1301–1310. doi: 10.1124/mol.105.014068. [DOI] [PubMed] [Google Scholar]
- Engelhardt R, Mackensen A, Galanos C. Phase I Trial of Intravenously Administered Endotoxin (Salmonella Abortus Equi) in Cancer Patients. Cancer Res. 1991;51:2524–2530. [PubMed] [Google Scholar]
- Gao JL, Chen H, Filie JD, Kozak CA, Murphy PM. Differential Expansion of the N-Formylpeptide Receptor Gene Cluster in Human and Mouse. Genomics. 1998;51:270–276. doi: 10.1006/geno.1998.5376. [DOI] [PubMed] [Google Scholar]
- Gavins FN, Yona S, Kamal AM, Flower RJ, Perretti M. Leukocyte Antiadhesive Actions of Annexin 1: ALXR- and FPR-Related Anti-Inflammatory Mechanisms. Blood. 2003;101:4140–4147. doi: 10.1182/blood-2002-11-3411. [DOI] [PubMed] [Google Scholar]
- Gordon S. The Macrophage: Past, Present and Future. Eur J Immunol. 2007;37 Suppl 1:S9–S17. doi: 10.1002/eji.200737638. [DOI] [PubMed] [Google Scholar]
- Guner O, Clement O, Kurogi Y. Pharmacophore Modeling and Three Dimensional Database Searching for Drug Design Using Catalyst: Recent Advances. Curr Med Chem. 2004;11:2991–3005. doi: 10.2174/0929867043364036. [DOI] [PubMed] [Google Scholar]
- Hu J, Li G, Tong Y, Li Y, Zhou G, He X, Xie P, Wang JM, Sun Q. Transduction of the Gene Coding for a Human G-Protein Coupled Receptor FPRL1 in Mouse Tumor Cells Increases Host Anti-Tumor Immunity. Int Immunopharmacol. 2005;5:971–980. doi: 10.1016/j.intimp.2005.01.011. [DOI] [PubMed] [Google Scholar]
- Huang J, Hu J, Bian X, Chen K, Gong W, Dunlop NM, Howard OM, Wang JM. Transactivation of the Epidermal Growth Factor Receptor by Formylpeptide Receptor Exacerbates the Malignant Behavior of Human Glioblastoma Cells. Cancer Res. 2007;67:5906–5913. doi: 10.1158/0008-5472.CAN-07-0691. [DOI] [PubMed] [Google Scholar]
- Kelher MR, Ambruso DR, Elzi DJ, Anderson SM, Paterson AJ, Thurman GW, Silliman CC. Formyl-Met-Leu-Phe Induces Calcium-Dependent Tyrosine Phosphorylation of Rel-1 in Neutrophils. Cell Calcium. 2003;34:445–455. doi: 10.1016/s0143-4160(03)00067-8. [DOI] [PubMed] [Google Scholar]
- Le Y, Hu J, Gong W, Shen W, Li B, Dunlop NM, Halverson DO, Blair DG, Wang JM. Expression of Functional Formyl Peptide Receptors by Human Astrocytoma Cell Lines. J Neuroimmunol. 2000;111:102–108. doi: 10.1016/s0165-5728(00)00373-8. [DOI] [PubMed] [Google Scholar]
- Lejeune FJ, Lienard D, Matter M, Ruegg C. Efficiency of Recombinant Human TNF in Human Cancer Therapy. Cancer Immun. 2006;6:6. [PubMed] [Google Scholar]
- Migeotte I, Communi D, Parmentier M. Formyl Peptide Receptors: a Promiscuous Subfamily of G Protein-Coupled Receptors Controlling Immune Responses. Cytokine Growth Factor Rev. 2006;17:501–519. doi: 10.1016/j.cytogfr.2006.09.009. [DOI] [PubMed] [Google Scholar]
- Nanamori M, Cheng X, Mei J, Sang H, Xuan Y, Zhou C, Wang MW, Ye RD. A Novel Nonpeptide Ligand for Formyl Peptide Receptor-Like 1. Mol Pharm. 2004;66:1213–1222. doi: 10.1124/mol.104.004309. [DOI] [PubMed] [Google Scholar]
- Nicklaus MC, Wang SM, Driscoll JS, Milne GWA. Conformational-Changes of Small Molecules Binding to Proteins. Bioorg Med Chem. 1995;3:411–428. doi: 10.1016/0968-0896(95)00031-b. [DOI] [PubMed] [Google Scholar]
- Perretti M, Chiang N, La M, Fierro IM, Marullo S, Getting SJ, Solito E, Serhan CN. Endogenous Lipid- and Peptide-Derived Anti-Inflammatory Pathways Generated With Glucocorticoid and Aspirin Treatment Activate the Lipoxin A4 Receptor. Nat Med. 2002;8:1296–1302. doi: 10.1038/nm786. [DOI] [PMC free article] [PubMed] [Google Scholar]
- Reed JC. Drug Insight: Cancer Therapy Strategies Based on Restoration of Endogenous Cell Death Mechanisms. Nat Clin Pract Oncol. 2006;3:388–398. doi: 10.1038/ncponc0538. [DOI] [PubMed] [Google Scholar]
- Rescher U, Danielczyk A, Markoff A, Gerke V. Functional Activation of the Formyl Peptide Receptor by a New Endogenous Ligand in Human Lung A549 Cells. J Immunol. 2002;169:1500–1504. doi: 10.4049/jimmunol.169.3.1500. [DOI] [PubMed] [Google Scholar]
- Schepetkin IA, Kirpotina LN, Khlebnikov AI, Quinn MT. High-Throughput Screening for Small-Molecule Activators of Neutrophils: Identification of Novel N-Formyl Peptide Receptor Agonists. Mol Pharm. 2007;71:1061–1074. doi: 10.1124/mol.106.033100. [DOI] [PubMed] [Google Scholar]
- Schön M, Schön MP. The Antitumoral Mode of Action of Imiquimod and Other Imidazoquinolines. Curr Med Chem. 2007;14:681–687. doi: 10.2174/092986707780059625. [DOI] [PubMed] [Google Scholar]
- Serhan CN. Resolution Phase of Inflammation: Novel Endogenous Anti-Inflammatory and Proresolving Lipid Mediators and Pathways. Annu Rev Immunol. 2007;25:101–137. doi: 10.1146/annurev.immunol.25.022106.141647. [DOI] [PubMed] [Google Scholar]
- Simunek T, Boer C, Bouwman RA, Vlasblom R, Versteilen AM, Sterba M, Gersl V, Hrdina R, Ponka P, de Lange JJ, Paulus WJ, Musters RJ. SIH--a Novel Lipophilic Iron Chelator--Protects H9c2 Cardiomyoblasts From Oxidative Stress-Induced Mitochondrial Injury and Cell Death. J Mol Cell Cardiol. 2005;39:345–354. doi: 10.1016/j.yjmcc.2005.05.008. [DOI] [PubMed] [Google Scholar]
- Tosi MF. Innate Immune Responses to Infection. J Allerg Clin Immunol. 2005;116:241–249. doi: 10.1016/j.jaci.2005.05.036. [DOI] [PubMed] [Google Scholar]
- Vulcano M, Rosa MFA, Minnucci FS, Cherñavsky AC, Isturiz MA. N-Formyl-Methionyl-Leucyl-Phenylalanine (FMLP) Inhibits Tumour Necrosis Factor-Alpha (TNF-α) Production on Lipopolysaccharide (LPS)-Stimulated Human Neutrophils. Clin Exp Immunol. 1998;113:39–47. doi: 10.1046/j.1365-2249.1998.00631.x. [DOI] [PMC free article] [PubMed] [Google Scholar]
- Watanabe N, Suzuki J, Kobayashi Y. Role of Calcium in Tumor Necrosis Factor-α Production by Activated Macrophages. J Biochem. 1996;120:1190–1195. doi: 10.1093/oxfordjournals.jbchem.a021540. [DOI] [PubMed] [Google Scholar]
- Zhang HZ, Drewe J, Tseng B, Kasibhatla S, Cai SX. Discovery and SAR of Indole-2-Carboxylic Acid Benzylidene-Hydrazides As a New Series of Potent Apoptosis Inducers Using a Cell-Based HTS Assay. Bioorg Med Chem. 2004;12:3649–3655. doi: 10.1016/j.bmc.2004.04.017. [DOI] [PubMed] [Google Scholar]
- Zhang X, Morrison DC. Pertussis Toxin-Sensitive Factor Differentially Regulates Lipopolysaccharide-Induced Tumor Necrosis Factor-α and Nitric Oxide Production in Mouse Peritoneal Macrophages. J Immunol. 1993;150:1011–1018. [PubMed] [Google Scholar]
- Zhou Y, Bian X, Le Y, Gong W, Hu J, Zhang X, Wang L, Iribarren P, Salcedo R, Howard OM, Farrar W, Wang JM. Formylpeptide Receptor FPR and the Rapid Growth of Malignant Human Gliomas. J Natl Cancer Inst. 2005;97:823–835. doi: 10.1093/jnci/dji142. [DOI] [PubMed] [Google Scholar]
Associated Data
This section collects any data citations, data availability statements, or supplementary materials included in this article.