

Abstract
Voltage-gated sodium channels are essential for the initiation and propagation of action potentials in excitable cells and are known as a target of local anesthetics. In addition, inhibition of sodium channels by volatile anesthetics has been proposed as a mechanism of general anesthesia. The n-alcohols produce anesthesia, and their potency increases with carbon number until a “cut-off” is reached. In this study, we examined effects of a range of n-alcohols on Nav1.2 subunits to determine the alcohol cut-off for this channel. We also studied the effect of a short-chain alcohol (ethanol) and a long-chain alcohol (octanol) on Nav1.2, Nav1.4, Nav1.6, and Nav1.8 subunits, and we investigated the effects of alcohol on channel kinetics. Ethanol and octanol inhibited sodium currents of all subunits, and the inhibition of the Nav1.2 channel by n-alcohols indicated a cut-off at nonanol. Ethanol and octanol produced open-channel block, which was more pronounced for Nav1.8 than for the other sodium channels. Inhibition of Nav1.2 was due to decreased activation and increased inactivation. These results suggest that sodium channels may have a hydrophobic binding site for n-alcohols and demonstrate the differences in the kinetic mechanisms of inhibition for n-alcohols and inhaled anesthetics.
Introduction
Alcohols are known to affect the function of many ion channels, particularly ligand-gated channels. For example, ethanol enhances GABAA and glycine receptor function at a 20–100 mM concentration that induces mild to severe intoxication (Harris et al., 1997; Mihic et al., 1997), inhibits glutamate receptor function (Wong et al., 1998), and potentiates neuronal nicotinic acetylcholine (ACh) receptor function (Godden et al., 2001). However, it is not known if actions of alcohols on these channels are sufficient to explain the behavioral effects of the n-alcohols.
Voltage-gated sodium channels play an essential role in action potential initiation and propagation in excitable cells of nerve and muscle. Nine distinct pore-forming alpha subunits, which are associated with auxiliary beta subunits, have been identified (Catterall, 2000; Catterall et al., 2005). Each αsubunit has a different pattern of development and localization and demonstrates subtle differences in electrophysiological characteristics (Goldin, 2001). Moreover, these subunits have distinct physiological and pathophysiological roles. For 6 example, multiple mutations of Nav1.1 can cause epilepsy (Escayg et al., 2001), and mutations of Nav1.5 are associated with arrhythmia, Brugada syndrome (Cordeiro et al., 2006), and long-QT syndrome (Vatta et al., 2006). The sodium channels expressed in dorsal root ganglion (DRG) (Nav1.7, Nav1.8, Nav1.9) play an important role in pain (Wood et al., 2004; Cummins et al., 2007).
Recent studies have shown that volatile anesthetics inhibit sodium channel function at clinical relevant concentrations in some neurons (Ratnakumari et al., 1998; Ouyang et al., 2003), and in some recombinant mammalian sodium channels (Rehberg et al., 1996; Shiraishi and Harris, 2004; Ouyang and Hemmings, 2007), suggesting sodium channels as a potential target for inhaled anesthetics. n-Alcohols can produce a state of general anesthesia, historically ethanol has been used for this purpose (Dundee et al., 1969), and there is evidence that ethanol and other alcohols inhibit sodium channel function. For example, a high concentration of ethanol (500 mM) inhibited sodium influx in synaptosomes isolated from rodent brain (Harris and Bruno, 1985), and Wu and Kendig (1998) showed that tetrodotoxin (TTX)-resistant and TTX-sensitive sodium channels in rat DRG neurons are inhibited by ethanol (50–200 mM) (Wu and Kendig, 1998). Haydon and Urban (1983) found that longer-chain n-alcohols (pentanol to decanol) inhibited the sodium current of the squid giant axon (Haydon and Urban, 1983). Some ion channels are affected by short, but not long, chain length n-alcohols and this alcohol “cut-off” has proven useful in characterizing alcohol action on ion channels (Wick et al., 1998). To extend these studies to sodium channels, we explored the effects of a series of n-alcohols on sodium channels.
Nav1.1, Nav1.2, Nav1.3, and Nav1.7 are TTX-sensitive and closely related by phylogenetic analysis, and all of their genes are located on human chromosome 2q23–24. Nav1.5, Nav1.8, and Nav1.9 are TTX-resistant and also closely related, and their genes are located on chromosome 3p21–24. Nav1.4 and Nav1.6 are phylogenetically distant from the other two clusters. We selected four of these subunits for study, as follows. We examined Nav1.2, which is expressed primarily in the central nervous system; Nav1.4, which is expressed primarily in skeletal muscle; Nav1.6, which is expressed primarily in the central nervous system and DRG; and Nav1.8, which is expressed in DRG.
Methods
Materials
Adult female Xenopus laevis frogs were obtained from Xenopus Express, Inc. (Plant City, FL). Methanol and ethanol were purchased from AAPER Alcohol (Shelbyville, KY), 1-propanol was obtained from Fisher Scientific (Pittsburgh, PA), and the other n-alcohols were purchased from Sigma-Aldrich (St. Louis, MO). We thank the following researchers for providing the subunit clones: cDNA for rat Nav1.2 αsubunit (gift from Dr. W. A. Catterall, University of Washington, Seatle, WA), cDNA for human Nav1.4 αsubunit (gift from Dr. A. L. George, Vanderbilt University, Nashville, TN), cDNA for rat Nav1.6 αsubunit (gift from Dr. A. L. Goldin, University of California, Irvine, CA), cDNA for rat Nav1.8 αsubunit (gift from Dr. A. N. Akopian, University of Texas Health Science Center, San Antonio, TX), and cDNA for human β1hsubunit (gift from Dr. A.L. George, Vanderbilt University).
Site-Directed Mutagenesis
Mutations were created using the QuikChange site-directed mutagenesis kit (Stratagene, La Jolla, CA). Briefly, polymerase chain reaction was performed using the cDNA of wild type Nav1.2 and Nav1.4 α subunit clone and the mutagenesis primers designed with the desired mutation at the appropriate place. Then, Escherichia coli-competent cells (XL1-Blue or One-shot TOP10/P3) were transformed with the polymerase chain reaction product digested with DpnI.
cRNA Preparation and Oocyte Injection
After linearized cDNA with ClaI (Nav1.2 αsubunit), EcoRI (Nav1.4 αsubunit, β1 subunit), and NotI (Nav1.6 α subunit), XbaI (Nav1.8 αsubunit), cRNA were transcribed using T6 (Nav1.4, 1.8 α, β1 subunit) or T7 (Nav1.2, 1.6 αsubunit) RNA polymerase of mMESSAGE mMACHINE kit (Ambion, Austin, TX). Preparation of Xenopus laevis oocytes and microinjection of the cRNA was performed as described previously (Shiraishi and Harris, 2004). Briefly, stage IV–VI oocytes were manually isolated from a removed portion of ovary. The oocytes were then treated with collagenase (0.5 mg/ml) for 10 min and placed in modified Barth’s solution (88 mM NaCl, 1 mM KCl, 2.4 mM NaHCO3, 10 mM HEPES, 0.82 mM MgSO4, 0.33 mM Ca(NO3)2, and 0.91 mM CaCl2, adjusted to pH 7.5), supplemented with 10,000 units of penicillin, 50 mg of gentamicin, 90 mg of theophylline, and 220 mg of sodium pyruvate per liter (incubation medium). Nav αsubunit cRNA were co-injected with βm subunit cRNA at a ratio of 1:10 (total volume was 20 ~ 40 ng/50 nl) into Xenopus oocytes (all αsubunits were co-injected with β1 subunit). The injected oocytes were incubated at 19 °C in incubation medium, and 2–6 days after injection, they were used in electrophysiological recordings.
Electrophysiological recordngs
All electrical recording was performed at room temperature (23 °C). The oocytes were placed in a rectangular chamber (approximately 100 μl volume) and perfused at 2 ml/min with Frog Ringer solution containing NaCl 115 mM, KCl 2.5 mM, HEPES 10 mM, CaCl2 1.8 mM, at pH 7.2 using a peristaltic pump (Cole-Palmer Instrument Co., Chicago, IL). Recording electrodes were prepared with borosilicate glass using a puller (P-97, Sutter Instruments Company, Novato, CA), and microelectrodes were filled with 3M KCl/0.5% low-melting-point agarose and had resistances between 0.3 and 0.5 MΩ. The whole-cell voltage clamp was achieved through these two electrodes using a Warner Instruments model OC-725C (Hamden, CT).
The amplitude of expressed sodium currents was typically 2–15 μA, and currents were recorded and analyzed using pCLAMP 7.0 software (Axon Instruments, Foster City, CA). The transients and leak currents were subtracted using the P/N procedure. Capacitance and 60–80 % series resistance were compensated, and leak current was subtracted using P/4 protocols. For the poorly water-soluble alcohols (heptanol-dodecanol), stocks were prepared in dimethylsulphoxide (DMSO) and diluted and sonicated in Frog Ringer solution to a final DMSO concentration not exceeding 0.05%. n-Alcohols were then perfused for 3 min to reach equilibrium. The loss of concentration from vial to bath was approximately 50–70 % for long-chain alcohols from heptanol to dodecanol (Dildy-Mayfield et al., 1996).
The voltage dependence of activation was determined by 50-ms depolarizing pulses from a holding potential of −90 mV to 50 mV in 10-mV increments or from a holding potential causing half-maximal current (V1/2) (approximately from −50 mV to −60 mV) to 50 mV in 10-mV increments. Activation curves were fitted to a Boltzmann equation: G/Gmax = 1/(1 + exp(V1/2 − V)/k), where G is the voltage-dependent sodium conductance, Gmax is the maximal sodium conductance, G/Gmax is the normalized fractional conductance, V1/2 is the potential at which activation is half maximal, and k is the slope factor. The G value for each oocyte was calculated using the formula G = I/(Vt – Vr), where I is the peak sodium current, Vt is the test potential, and Vr is the reversal potential. Vr for each oocyte was estimated by extrapolating the linear ascending segment of the current voltage relationship (I−V) curve to the voltage axis. To measure steady-state inactivation, currents were elicited by a 50-ms test pulse to −20 mV after 200-ms prepulses ranging from −140 mV to 0 mV in 10-mV increments from a holding potential of −90 mV. Steady-state inactivation curves were fitted to a Boltzmann equation: I/Imax = 1/(1 + exp(V1/2 – V)/k), where Imax is the maximal sodium current, I/Imax is the normalized current, V1/2 is the voltage of half-maximal inactivation, and k is the slope factor.
Data Analysis
All values are presented as the mean ± SEM. The n values refer to the number of oocytes studied. Each experiment was performed with oocytes from at least two different frogs. Statistical analyses were performed using a one-way analysis of variance (ANOVA) for multiple comparisons and a t test using GraphPad Prism software (GraphPad Software, Inc., San Diego, CA). We also calculated Hill slope and IC50 values using GraphPad Prism.
Results
Effects of ethanol and octanol on the peak Na+ inward currents
The effects of ethanol and octanol on the peak Na+ inward currents (INa) were examined at concentrations corresponding to the EC50 for producing loss of righting reflex in tadpoles (ethanol, 190 mM; octanol, 0.057 mM) (Alifimoff et al., 1989). Currents were elicited by a 50-ms depolarizing pulse to −20 mV applied every 10 s from −90 mV (Vmax) or a holding potential of V1/2. It was found that ethanol inhibited INa induced by Nav1.2 at Vmax, and the inhibitory effect of ethanol was more potent at V1/2 (Fig. 1A, B). Octanol also inhibited INa induced by Nav1.2 at both Vmax and V1/2, but more effectively at V1/2 (Fig. 1C, D). Ethanol and octanol were also tested on the other αsubunits: Nav1.4, Nav1.6, or Nav1.8. Ethanol reduced the peak INa induced by Nav1.2, Nav1.4, Nav1.6, and Nav1.8 by 19 ± 1%, 19 ± 4%, 14 ± 1%, and 28 ± 1% at Vmax, respectively, and 29 ± 1%, 35 ± 2%, 25 ± 1%, and 30 ± 3% at V1/2, respectively (Fig. 1E). Octanol reduced the peak INa induced by Nav1.2, Nav1.4, Nav1.6, and Nav1.8 by 17 ± 1%, 19 ± 3%, 17 ± 1%, and 13 ± 1% at Vmax, respectively, and 36 ± 2%, 46 ± 2%, 38 ± 4%, and 19 ± 1% at V1/2, respectively (Fig. 1E). Thus, for Nav1.2, Nav1.4, and Nav1.6, ethanol and octanol inhibited the peak INa more effectively at V1/2 than at Vmax. On the other hand, for Nav1.8, ethanol similarly suppressed the peak INa at V1/2 and Vmax (Fig. 1E).
Figure 1.

Inhibitory effects of ethanol (C2) (190 mM) and octanol (C8) (0.057 mM) on sodium channels at different holding potentials. (A) Traces of sodium currents evoked by a 50-ms depolarizing pulse to −20 mV from a holding potential of −90 mV (Vmax) and to −20 mV from a holding potential which induced half maximal current (V1/2), in the absence and presence of ethanol in an oocyte expressing Nav1.2. (B) Time course of ethanol effects on sodium currents of Nav1.2. Currents were elicited by 50-ms depolarizing pulses to −20 mV applied every 10 s from a V1/2 holding potential. The current is normalized to the initial values. Filled circles represent control and washout, and open circles represent currents during ethanol treatment. Ethanol was applied for 3 min. (C) Traces of sodium currents evoked by a 50-ms depolarizing pulse to −20 mV from Vmax and V1/2 in the absence and presence of octanol in an oocyte expressing Nav1.2. (D) Time course of octanol effects on sodium currents of Nav1.2. (E) Percent inhibition of sodium current by ethanol and octanol in oocytes expressing Nav1.2, Nav1.4, Nav1.6, and Nav1.8. Open columns indicate the effect at Vmax, and closed columns indicate the effect at V1/2. V1/2 value of Nav1.2, Nav1.4, Nav1.6, and Nav1.8 were 55.8 ± 0.5, 57.5 ± 2.0, 59.3 ± 0.4 and 43.9 ± 1.4 mV, respectively. Data are mean ± S.E.M. (n = 4–6). Differences between Vmax and V1/2 for each condition are indicated as *, p < 0.05; **, p < 0.01; and ***, p < 0.001 (one-way ANOVA).
Effects of n-alcohols on Nav1.2 currents
Increases in carbon chain length shifted the concentration-response curves to lower alcohol concentrations, but these shifts became very small as the chain length increased from octanol to nonanol to decanol, indicating a cut-off approximately at nonanol (Fig. 2). The IC50 values and slopes calculated from dose-response data are shown in Table 1. The IC50 value for dodecanol was estimated by extrapolation because the inhibitory effect at highest concentration of dodecanol was less than 50%.
Figure 2.
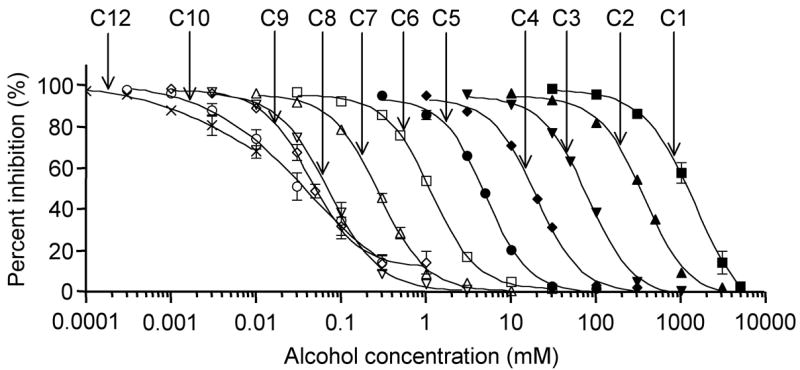
Effects of n-alcohols on sodium currents in oocytes expressing Nav1.2. Concentration-response curves for n-alcohols (methanol to dodecanol) on sodium currents elicited by a 50-ms depolarizing pulse to −20 mV from V1/2 holding potential. V1/2 value of Nav1.2 was 54.7 ± 0.3 mV. Data are represented as means ± S.E.M. (n = 5–6). The data were fit by a logistic equation to the give IC50s and Hill slopes shown in Table 1.
Table 1.
Inhibitory Effect of n-Alcohols on Nav1.2 Calculated From Concentration Response Curves Shown in Figure 2
| n-Alcohol | Concentration range (mM) | IC50 | Hill slope |
|---|---|---|---|
| Methanol | 30–5000 | 1418 ± 203 mM | 1.42 ± 0.04 |
| Ethanol | 10–3000 | 361 ± 6 mM | 1.64 ± 0.07 |
| Propanol | 3–1000 | 78.8 ± 2.6 mM | 1.60 ± 0.05 |
| Butanol | 1–300 | 19.5 ± 0.8 mM | 1.66 ± 0.06 |
| Pentanol | 0.3–100 | 5.00 ± 0.13 mM | 1.73 ± 0.06 |
| Hexanol | 0.03–30 | 1.15 ± 0.06 mM | 1.62 ± 0.02 |
| Heptanol | 0.01–10 | 0.28 ± 0.01 mM | 1.55 ± 0.04 |
| Octanol | 0.003–3 | 72.1 ± 4.5 pM | 1.45 ± 0.04 |
| Nonanol | 0.001–1 | 44.2 ± 3.0 pM | 1.51 ± 0.04 |
| Decanol | 0.0003–0.3 | 42.7 ± 11.6 pM | 0.71 ± 0.05 |
| Dodecanol | 0.00001–0.001 | 44.6 ± 12.6 pM | 0.61 ± 0.14 |
Effects of ethanol and octanol on activation and inactivation of sodium Currents
The voltage dependence of activation was determined by 50-ms depolarizing pulses from a holding potential of −90 mV (Vmax) to 50 mV in 10-mV increments or from a holding potential of V1/2 to 50 mV in 10-mV increments for Nav1.2, Nav1.4, Nav1.6, or Nav1.8. The activation curves were derived from the I–V curves (see Methods), and the peak INa was reduced by ethanol (190 mM) and octanol (0.057 mM) at Vmax and V1/2 holding potentials with all subunits (Fig. 3). Ethanol and octanol shifted the midpoint of steady-state activation in a depolarizing direction by 2.7 and 3.3 mV, respectively, at Vmax for Nav1.2 (Fig. 4A, Table 2). These changes were small but significant statistically.
Figure 3.

Effects of ethanol (190 mM) and octanol (0.057 mM) on I–V curves of sodium currents in oocytes expressing Nav1.2 and Nav1.8. (A) Representative INa traces from oocytes expressing Nav1.2 in the absence and presence of ethanol or octanol. Currents were elicited by 50-ms depolarizing steps between −80 and 50 mV in 10-m V increments from holding potentials of −90 mV. (B) Effects of ethanol and octanol on representative I–V curves elicited from Vmax holding potential for Nav1.2. (C) Effects of ethanol and octanol on representative I–V curves elicited from V1/2 holding potential in oocytes expressing Nav1.2. (D) Representative INa traces in oocytes expressing Nav1.8 in the absence and presence of ethanol and octanol. (E) Effects of ethanol and octanol on representative I–V curves elicited from a Vmax holding potential in oocyte expressing Nav1.8. (F) Effects of ethanol and octanol on representative I–V curves elicited from a V1/2 holding potential in oocyte expressing Nav1.8.
Figure 4.

Effects of ethanol (190 mM) and octanol (0.057 mM) on channel activation in oocytes expressing Nav1.2, Nav1.4, Nav1.6, and Nav1.8 from Vmax holding potential (A panels) or V1/2 holding potential (B panels). V1/2 value of Nav1.2, Nav1.4, Nav1.6, and Nav1.8 were 54.0 ± 0.9, 55.3 ± 1.2, 58.7 ± 0.9 and 42.0 ± 1.2 mV, respectively. Data are shown as mean ± S.E.M. (n = 4–6). Activation curves fitted to a Boltzmann equation and V1/2 are shown in Table 2.
Table 2.
Effect of Ethanol (C2, 190 mM) and Octanol (C8, 0.057 mM) on Activation and Inactivation of Four Different Sodium Channels (See Figures 4 and 5 for Details)
| Holding −90 mV
|
Holding V1/2 |
|||||
|---|---|---|---|---|---|---|
| Activation | Control | C2 | C8 | Control | C2 | C8 |
| V1/2(mV) | ||||||
|
| ||||||
| Nav1.2 | −32.2 ± 0.4 | −29.5 ± 1.0* | −28.9 ± 0.8** | −25.2 ± 0.4 | −22.2 ± 0.4** | −22.5 ± 0.4** |
| Nav1.4 | −42.6 ± 0.4 | −41.8 ± 0.9 | −42.5 ± 0.1 | −32.7 ± 1.1 | −29.5 ± 3.0 | −27.8 ± 2.3 |
| Nav1.6 | −33.0 ± 0.7 | −30.8 ± 1.1 | −30.3 ± 1.6 | −26.8 ± 0.5 | −24.6 ± 0.9 | −23.6 ± 0.7** |
| Nav1.8 | 4.2 ± 0.4 | 6.0 ± 0.8 | 5.1 ± 0.8 | 5.0 ± 0.6 | 7.8 ± 0.5 | 6.2 ± 1.4 |
| Inactivation | Control | C2 | C8 | |||
|
| ||||||
| V1/2 (mV) | ||||||
|
| ||||||
| Nav1.2 | −55.3 ± 0.6 | −56.3 ± 0.8 | −58.7 ± 0.9** | |||
| Nav1.4 | −55.7 ± 0.3 | −57.9 ± 0.7 | −59.3 ± 1.0** | |||
| Nav1.6 | −59.6 ± 0.6 | −60.8 ± 1.0 | −63.1 ± 0.5 * | |||
| Nav1.8 | −53.6 ± 1.4 | −55.7 ± 2.5 | −55.3 ± 2.6 | |||
p < 0.05;
p < 0.01, compared with control by one-way analysis of variance (mean ± S.E.M.; n = 4–6).
Ethanol and octanol also had a tendency to shift the V1/2 of Nav1.6 at Vmax in the depolarizing direction (2.2 and 2.7 mV, respectively), but these shifts were not statistically significant (Fig. 4A, Table 2). The alcohols did not affect the activation kinetics of Nav1.4 or Nav1.8 at Vmax. At V1/2, ethanol and octanol showed significant shifts of the V1/2 of Nav1.2 (3.0 and 2.7 mV, respectively) (Fig. 4B, Table 2). Octanol shifted the V1/2 of Nav1.6 (3.2 mV), and ethanol produced a smaller, nonsignificant shift (Fig. 4B, Table 2). In oocytes expressing Nav1.4 or Nav1.8, both alcohols shifted V1/2 slightly, and, on the whole, both alcohols were more effective on activation at V1/2 than at Vmax, although even the effects at V1/2 were small.
The effect of ethanol and octanol on the steady-state inactivation was also investigated. Ethanol weakly (and insignificantly) shifted the V1/2 in the hyperpolarizing direction by 1.0, 2.2, 1.2, and 2.1 mV in Nav1.2, Nav1.4, Nav1.6, and Nav1.8, respectively (Fig. 5, Table 2). On the other hand, octanol shifted the V1/2 in the hyperpolarizing direction significantly by 3.4, 3.6, and 3.5 mV in Nav1.2, Nav1.4, and Nav1.6, respectively, although the shift with Nav1.8 was not significant (1.7 mV) (Fig. 5, Table 2). On the whole, octanol was more effective than ethanol with the steady-state inactivation of Nav1.2, Nav1.4, or Nav1.6, but the effect of octanol on Nav1.8 was smaller than the effect of ethanol.
Figure 5.

Effects of ethanol and octanol on inactivation curves in oocytes expressing Nav1.2 (A), Nav1.4 (B), Nav1.6 (C), and Nav1.8 (D). Currents were elicited by a 50-ms test pulse to −20 mV (Nav1.8: 10 mV) after 200-ms prepulses (Nav1.8: 500-ms) ranging from −140 to 0 mV in 10-mV increments. Data shown as mean ± S.E.M. (n = 4–6). Inactivation curves were fitted to a Boltzmann equation and the V1/2 values are shown in Table 2.
Effects of ethanol and octanol on mutated Nav1.2 and Nav1.4 channels
We found that the inhibitory effect of ethanol on Nav1.8 was similar at Vmax and at V1/2, but was greater at V1/2 than at Vmax for Nav1.2, Nav1.4, and Nav1.6 (Fig 1E). To explore the molecular differences that might account for this distinction between Nav1.8 and other αsubunits, we introduced single-point mutants into Nav1.2 and Nav1.4 to see if these mutations would switch the alcohol sensitivity of these subunits. We selected three amino acids that were different in Nav1.8 from Nav1.2, Nav1.4, and Nav1.6 in domains I and II (Fig. 6), and we hypothesized that these amino acid differences could be functionally important because of the polarity differences of these amino acids between Nav1.8 and other αsubunits. We introduced the amino acids found in Nav1.8 into Nav1.2 and Nav1.4 (M271K, M900K, and M965T in Nav1.2, and M273K, M719K, and M784T in Nav1.4). At V1/2, the mutations in Nav1.2 did not alter the inhibitory effect of ethanol, hexanol and octanol, but at Vmax the M900K mutant increased the inhibitory effect of these alcohols significantly compared with Nav1.2 wild type (Fig. 7). Ethanol inhibited Nav1.2 wild type and M900K by 14 ± 1% and 20 ± 2%, respectively; hexanol inhibited Nav1.2 wild type and M900K by 7 ± 1% and 13 ± 2%, respectively; and octanol inhibited Nav1.2 wild type and M900K by 11 ± 1%and 16 ± 2%, respectively. There were no differences in alcohol inhibition between Nav1.4 wild type and its mutants at Vmax or V1/2, although at Vmax the inhibitory effect of these three alcohols on M719K (equivalent to M900K of Nav1.2) increased slightly (data not shown).
Figure 6.

Sequence alignment of Nav1.2, Nav1.4, Nav1.6, and Nav1.8 for segment 5 in domain I, segment 5 in domain II, and segment 6 in domain II. Three amino acids were selected in these areas because these amino acids are different in Nav1.8 from those in Nav1.2, Nav1.4, and Nav1.6 and are in trans-membrane regions close to the extracellular surface. The amino acids of Nav1.8 were introduced into Nav1.2 and Nav1.4, giving the single mutants: M271K, M900K, and M965T (Nav1.2 mutants), and M273K, M719K, and M784T (Nav1.4 mutants).
Figure 7.

The inhibitory effect of ethanol (190 mM), hexanol (0.57 mM), and octanol (0.057 mM) on Nav1.2 wild type and three mutants. Currents were elicited by a 50-ms depolarizing pulse to −20 mV applied every 10 s from Vmax and V1/2 holding potential, and each alcohol was applied for 3 min. V1/2 value of Nav1.2 WT, M271K, M900K, and M965T were 51.0 ± 1.0, 43.8 ± 0.6, 56.2 ± 1.1 and 48.6 ± 0.9 mV, respectively. Data are mean ± S.E.M. (n = 4–6). **, p < 0.05 by one-way ANOVA.
Disussion
Alcohols inhibit sodium currents
We found that anesthetic concentrations of both ethanol and octanol suppressed INa of four αsubunits by 30–40% at V1/2 and by 13–30% at Vmax. This is consistent with previous studies of other anesthetics. For example, anesthetic concentrations (0.25–0.4 mM) of isoflurane inhibited INa in isolated rat neurohypophysial nerve terminal by around 40% (Ouyang et al., 2003), suppressed sodium currents of Nav1.2 in Chinese hamster ovary cells (Rehberg et al., 1996), and inhibited currents from Nav1.2, Nav1.4, and Nav1.6 by about 30% in an oocyte expression system (Shiraishi and Harris, 2004).
Two questions that remain are (1) how much inhibition of sodium currents is required to alter neuronal function, and (2) can the observed alcohol effects contribute to anesthesia? Scholz and colleagues (Scholz et al., 1998a; Scholz and Vogel, 2000) demonstrated that firing frequency was reduced from 35 Hz to 21 Hz by 30 μM lidocaine in DRG neurons. They also found that the number of action potentials decreased from 21 to 10 in 750 ms by 10% inhibition of sodium currents, suggesting that even 10% inhibition may reduce action potential propagation. These previous reports, together with our present results, support the idea that alcohol actions on sodium channels could reduce neuronal firing and potentially result in anesthesia.
n-Alcohol cut-off and hydrophobic binding sites
Alifimoff et al. (1989) demonstrated a cut-off at about C13 for anesthesia using tadpoles, and this raised the possibility that n-alcohols produce anesthesia by acting on a protein cavity that can accommodate as large as C12, but not larger (Alifimoff et al., 1989). One of the first proteins systematically studied with the n-alcohols was firefly luciferase. Franks and Lieb (1984, 2004) showed a remarkable correlation between luciferase inhibition and anesthetic potency (Franks and Lieb, 1984, 2004) and suggested the existence of a binding pocket based on the n-alcohol cut-off of luciferase (Franks and Lieb, 1985). More recent studies have reported alcohol cut-offs for ligand-gated ion channels. For example, cut-offs of GABA rho, NMDA, GABAA, glycine, and neuronal nicotinic acetylcholine receptors are C7, C8, C10, C10, and C12, respectively (Wick et al., 1998; Peoples and Weight, 1995; Dildy-Mayfield et al., 1996; Zuo et al., 2001). The sodium channels show a cut-off at C9 in the present study, yet tadpoles are sensitive to C12 (and rats to at least C10, Dildy-Mayfield et al., 1996), raising the question of which of these channels is relevant, or clearly not relevant, for the anesthetic actions of long chain alcohols. We propose that the cut-offs for GABA rho and NMDA are probably too short, but it is difficult to absolutely exclude GABAA, glycine and sodium channels based on the cut-off.
Testing a series of n-alcohols also allows estimation of the free energy change that occurs upon transfer of the alcohol from water to its site of action. This is commonly calculated as the free energy change obtained by adding each CH2 group, which gives a measure of the hydrophobicity of the site of action. For our sodium channel, we calculated a value of ΔΔG = −835 cal/mol/CH2 = −3.49 kJ/mol/CH2. We compared ΔΔG from our study with results from other studies of n-alcohols (Figure 8B, Table 3). Nav1.2 is similar to tadpole anesthesia in approach to cut-off and ΔΔG values, although tadpole anesthesia shows a gradual change at C10–C12, whereas the sodium channel shows a more abrupt cut-off. In contrast, one ligand-gated ion channel, the NMDA receptor, shows a cut-off at much shorter chain lengths (Peoples and Weight, 1995). Thus, n-alcohol inhibition of brain sodium channel function is close to anesthetic potency in vivo, suggesting the possibility of existence that binding sites for anesthetics on sodium channels (Fig 8A).
Figure 8.

Comparison of IC50 (EC50) and ΔG values for n-alcohols between published studies and data from the present study. (A) Relationship between the logarithms of IC50 and carbon number. Filled circles, EC50s for tadpole anesthesia (Alifimoff et al., 1989); open circles, IC50s for Nav1.2 (present study); open triangles, IC50s for squid axon sodium channel (Haydon and Urban, 1983); crosses, IC50s for NMDA receptors (Peoples and Weight, 1995). (B) Gibb’s free energy change for partitioning from the water phase to the site of action. The free energy change contributed by each methylene group (ΔΔG) was calculated from slope of Figure 8B and is given in Table 3.
Table 3.
Comparison of Gibb’s Free Energy Change (ΔΔG) for Transfer of Each Methylene Group of a Series of n-Alcohols From Water to the Site of Action for the Present Study With Published Results. Values for the Present Study Were Calculated From Figure 8B
| ΔΔG
|
Reference | ||
|---|---|---|---|
| cal/mol/CH2 | kJ/mol/CH2 | ||
| Tadpole | −800 | −3.35 | Alifimoff et al. (1989) |
| Nav1.2 | −835 | −3.49 | Present study |
| Squid axon | −726 | −3.04 | Haydon and Urban (1983) |
| NMDA receptor | −478 | −2.00 | Peoples and Weight (1995) |
Effects of alcohol on activation and inactivation
The actions of ethanol and octanol on channel activation and inactivation demonstrated some common characteristics but also some differences among the four αsubunits we studied. We found that suppression of sodium currents by alcohols was voltage insensitive in the hyperpolarizing potential range and that inhibition was seen at a holding potential that produces a maximal current. These results suggest that one mechanism of alcohol action is inhibition of open channels. Although ethanol and octanol shifted the V1/2 of activation of Nav1.2 in a depolarizing direction, the shift was small (~4 mV), and the V1/2 of activations of the other subunits were not significantly changed, suggesting that alcohol effects on channel activation are not sufficient to account for inhibition of channel function. Octanol shifted the V1/2 of inactivation of the Nav1.2, Nav1.4, and Nav1.6 subunits in a hyperpolarizing direction (~4 mV), and ethanol produced a small shift, which was not statistically significant. Neither ethanol nor octanol altered inactivation of Nav1.8.
From these analyses of activation and inactivation, the most consistent component of alcohol-induced suppression for the four different αsubunits is suppression of open channels. For Nav1.2, Nav1.4, and Nav1.6, increased inactivation also contributes to inhibition of sodium currents for octanol, but for Nav1.8 there is only a small change in inactivation kinetics. Thus, the main component of ethanol-induced inhibition of Nav1.8 is suppression of open channels. Wu and Kendig (1998) concluded that the open state of TTX-resistant sodium channels is more sensitive to ethanol than those of TTX-sensitive sodium channels of DRG neurons (Wu and Kendig, 1998). In addition, they showed small effects of ethanol on activated state and inactivated state in TTX-sensitive and TTX-resistant sodium channels of DRG neurons (Table 4). The TTX-resistant current in DRG neurons is probably due to Nav1.8, and our results with recombinant channels are in agreement with the results from DRG neurons.
Table 4.
Comparison of Changes in Activation and Inactivation (as the shift in V1/2) Produced by Ethanol (C2), Octanol (C8) And Isoflurane for Results From the Present Study and Previous Publications *
| Activation
|
|||
|---|---|---|---|
| C2 | C8 | Isoflurane | |
| mV | |||
|
| |||
| Nav1.2 | +2.7 (190 mM) | +3.3 (0.057 mM) | +0.3 (0.6 mM) |
| Nav1.8 | +1.8 (190 mM) | +0.9 (0.057 mM) | −0.7 (0.6 mM) |
| DRG (TTX-S) | +0.23 (200 mM) | ||
| DRG (TTX-R) | +0.35 (200 mM) | ||
| Inactivation
|
|||
| C2 | C8 | Isoflurane | |
|
| |||
| mV | |||
|
| |||
| Nav1.2 | −1.0 (190 mM) | −3.4 (0.057 mM) | −8.9 (0.6 mM) |
| Nav1.8 | −2.1 (190 mM) | −1.7 (0.057 mM) | −0.8 (0.6 mM) |
| DRG (TTX-S) | −2.3 (200 mM) | ||
| DRG (TTX-R) | −2.1 (200 mM) | ||
Effects of isoflurane on Nav1.2 and Nav1.8 are from Shiraishi and Harris (2004), and the effects of ethanol on TTX-S and TTX-R (DRG) are from Wu and Kendig (1998). Values in parentheses represent the concentrations of alcohols or isoflurane used in the studies. Holding potentials for activation curves were −90 mV in Nav1.2 and Nav1.8, and −80 mV in DRG neurons.
Inhaled anesthetics also inhibit sodium channels, but the mechanism of inhibition may be different from those shown for alcohols. For example, suppression of sodium currents (HEK293 cells, Nav1.5) by halothane and isoflurane involves acceleration of the transition from the open to the inactivated state and stabilization of inactivated states (Stadnicka et al., 1999). Ouyang et al. (2003) suggested that general anesthetics inhibit presynaptic voltage-gated Na+ channels through enhanced inactivation (Ouyang et al., 2003). We also concluded that isoflurane stabilizes the inactivated state of several αsubunits of sodium channels expressed in oocytes (Shiraishi and Harris, 2004). Compared with inhaled anesthetics, alcohols appear to be more effective as open-channel blockers, less effective at stabilizing the inactivated state, and capable of producing effects (albeit weak) on the activated state that are not found with anesthetics (Table 4).
Recently, Ouyang and Hemmings (2007) demonstrated different mechanisms of inhibition by isoflurane for several sodium channel αsubunits expressed in Chinese hamster ovary cells (Ouyang and Hemmings, 2007). They showed that isoflurane is more effective on Nav1.2 than on Nav1.4 or Nav1.5 for the resting and open states, and is more effective on Nav1.4 or Nav1.5 than on Nav1.2 for the fast-inactivating state. That study, together with our results, indicates that αsubunits differ in the mechanisms of channel inhibition by volatile anesthetics and alcohol.
Effects of alcohol on mutant Nav1.2
A previous report suggested that Nav1.8 was insensitive to isoflurane and concluded that one possible explanation for the insensitivity of Nav1.8 to anesthetics lies in the differences in channel gating between Nav1.8 and other channels (Shiraishi and Harris, 2004). In the present study, we found Nav1.8 to be more sensitive than other subunits to ethanol inhibition of the open state. To explore possible molecular mechanisms, we made three single mutants based on amino acid differences between Nav1.8 and other subunits. One Nav1.2 mutant, M900K, showed increased inhibition by ethanol, hexanol, and octanol at Vmax. These experiments suggest that lysine 806 of segment 5 in domain II of Nav1.8 has a role in the high sensitivity of Nav1.8 to open-channel blockage by alcohol.
Conclusions
Alcohols inhibited sodium currents induced by Nav1.2, Nav1.4, Nav1.6, and Nav1.8 at anesthetic concentrations and demonstrated a cut-off for long-chain n-alcohols. These results raise the possibility that alcohol and anesthetic inhibition of sodium channel function may be important for anesthesia, but further study is needed to clarify the relevance of sodium channels to anesthesia.
Acknowledgments
This study was supported by National Institutes of Health Grants GM47818 and AA06399 (to R.A.H.).
Abbreviations
- n-alcohols
normal alcohols
- Nav
voltage-gated Na+ channel(s)
- GABAA
γ-amino butyric acid A
- ACh
acetylcholine
- NMDA
N-methyl-D-aspartate
- TTX
tetrodotoxin
- DRG
dorsal root ganglion
- DMSO
dimethylsulphoxide
- ANOVA
one-way analysis of variance
- INa
the peak Na+ inward currents
- HEK
human embryonic kidney
References
- Alifimoff JK, Firestone LL, Miller KW. Anaesthetic potencies of primary alkanols: Implications for the molecular dimensions of the anaesthetic site. Br J Pharmacol. 1989;96:9–16. doi: 10.1111/j.1476-5381.1989.tb11777.x. [DOI] [PMC free article] [PubMed] [Google Scholar]
- Blair NT, Bean BP. Roles of tetrodotoxin (TTX)-sensitive Na+ current, TTX-resistant Na+ current, and Ca2+ current in the action potentials of nociceptive sensory neurons. J Neurosci. 2002;22:10277–10290. doi: 10.1523/JNEUROSCI.22-23-10277.2002. [DOI] [PMC free article] [PubMed] [Google Scholar]
- Catterall WA. From ionic currents to molecular mechanisms: The structure and function of voltage-gated sodium channels. Neuron. 2000;26:13–25. doi: 10.1016/s0896-6273(00)81133-2. [DOI] [PubMed] [Google Scholar]
- Catterall WA, Goldin AL, Waxman SG. International Union of Pharmacology. XLVII. Nomenclature and structure-function relationships of voltage-gated sodium channels. Pharmacol Rev. 2005;57:397–409. doi: 10.1124/pr.57.4.4. [DOI] [PubMed] [Google Scholar]
- Cordeiro JM, Barajas-Martinez H, Hong K, Burashnikov E, Pfeiffer R, Orsino AM, Wu YS, Hu D, Brugada J, Brugada P, Antzelevitch C, Dumaine R, Brugada R. Compound heterozygous mutations P336L and I1660V in the human cardiac sodium channel associated with the Brugada syndrome. Circulation. 2006;114:2026–2033. doi: 10.1161/CIRCULATIONAHA.106.627489. [DOI] [PMC free article] [PubMed] [Google Scholar]
- Cummins TR, Sheets PL, Waxman SG. The roles of sodium channels in nociception: Implications for mechanisms of pain. Pain. 2007;131:243–257. doi: 10.1016/j.pain.2007.07.026. [DOI] [PMC free article] [PubMed] [Google Scholar]
- Dildy-Mayfield JE, Mihic SJ, Liu Y, Deitrich RA, Harris RA. Actions of long chain alcohols on GABAA and glutamate receptors: Relation to in vivo effects. Br J Pharmacol. 1996;118:378–384. doi: 10.1111/j.1476-5381.1996.tb15413.x. [DOI] [PMC free article] [PubMed] [Google Scholar]
- Dundee JW, Isaac M, Clarke RS. Use of alcohol in anesthesia. Anesth Analg. 1969;48:665–669. [PubMed] [Google Scholar]
- Escayg A, Heils A, MacDonald BT, Haug K, Sander T, Meisler MH. A novel SCN1A mutation associated with generalized epilepsy with febrile seizures plus—and prevalence of variants in patients with epilepsy. Am J Hum Genet. 2001;68:866–873. doi: 10.1086/319524. [DOI] [PMC free article] [PubMed] [Google Scholar]
- Franks NP, Lieb WR. Do general anaesthetics act by competitive binding to specific receptors? Nature. 1984;310:599–601. doi: 10.1038/310599a0. [DOI] [PubMed] [Google Scholar]
- Franks NP, Lieb WR. Mapping of general anaesthetic target sites provides a molecular basis for cutoff effects. Nature. 1985;316:349–351. doi: 10.1038/316349a0. [DOI] [PubMed] [Google Scholar]
- Franks NP, Lieb WR. Seeing the light: Protein theories of general anesthesia. 1984. Anesthesiology. 2004;101:235–237. doi: 10.1097/00000542-200407000-00034. [DOI] [PubMed] [Google Scholar]
- Godden EL, Harris RA, Dunwiddie TV. Correlation between molecular volume and effects of n-alcohols on human neuronal nicotinic acetylcholine receptors expressed in Xenopus oocytes. J Pharmacol Exp Ther. 2001;296:716–722. [PubMed] [Google Scholar]
- Goldin AL. Resurgence of sodium channel research. Annu Rev Physiol. 2001;63:871–894. doi: 10.1146/annurev.physiol.63.1.871. [DOI] [PubMed] [Google Scholar]
- Harris RA, Bruno P. Effects of ethanol and other intoxicant-anesthetics on voltage-dependent sodium channels of brain synaptosomes. J Pharmacol Exp Ther. 1985;232:401–406. [PubMed] [Google Scholar]
- Harris RA, Mihic SJ, Brozowski S, Hadingham K, Whiting PJ. Ethanol, flunitrazepam, and pentobarbital modulation of GABAA receptors expressed in mammalian cells and Xenopus oocytes. Alcohol Clin Exp Res. 1997;21:444–451. doi: 10.1111/j.1530-0277.1997.tb03789.x. [DOI] [PubMed] [Google Scholar]
- Haydon DA, Urban BW. The action of alcohols and other non-ionic surface active substances on the sodium current of the squid giant axon. J Physiol. 1983;341:411–427. doi: 10.1113/jphysiol.1983.sp014813. [DOI] [PMC free article] [PubMed] [Google Scholar]
- Michic SJ, Ye Q, Wick MJ, Koltchine VV, Krasowski MD, Finn SE, Mascia MP, Valenzuela CF, Hanson KK, Greenblatt EP, Harris RA, Harrison NL. Site of alcohol and volatile anaesthetic action on GABA(A) and glycine receptors. Nature. 1997;389:385–389. doi: 10.1038/38738. [DOI] [PubMed] [Google Scholar]
- Ouyang W, Wang G, Hemmings HC., Jr Isoflurane and propofol inhibit voltage-gated sodium channels in isolated rat neurohypophysial nerve terminals. Mol Pharmacol. 2003;64:373–381. doi: 10.1124/mol.64.2.373. [DOI] [PubMed] [Google Scholar]
- Ouyang W, Hemmings HC., Jr Isoform-selective effects of isoflurane on voltage-gated Na+ channels. Anesthesiology. 2007;107:91–98. doi: 10.1097/01.anes.0000268390.28362.4a. [DOI] [PubMed] [Google Scholar]
- Peoples RW, Weight FF. Cutoff in potency implicates alcohol inhibition of N-methyl-D-asparate receptors in alcohol intoxication. Proc Natl Acad Sci USA. 1995;92:2825–2829. doi: 10.1073/pnas.92.7.2825. [DOI] [PMC free article] [PubMed] [Google Scholar]
- Ratnakumari L, Hemmings HC., Jr Inhibition of presynaptic sodium channels by halothane. Anesthesiology. 1998;88:1043–1054. doi: 10.1097/00000542-199804000-00025. [DOI] [PubMed] [Google Scholar]
- Rehberg B, Xiao YH, Duch DS. Central nervous system sodium channels are significantly suppressed at clinical concentrations of volatile anesthetics. Anesthesiology. 1996;84:1223–1233. doi: 10.1097/00000542-199605000-00025. [DOI] [PubMed] [Google Scholar]
- Renganathan M, Cummins TR, Waxman SG. Contribution of Na(v)1.8 sodium channels to action potential electrogenesis in DRG neurons. J Neurophysiol. 2001;86:629–640. doi: 10.1152/jn.2001.86.2.629. [DOI] [PubMed] [Google Scholar]
- Scholz A, Kuboyama N, Hempelmann G, Vogel W. Complex blockade of TTX-resistant Na+ currents by lidocaine and bupivacaine reduce firing frequency in DRG neurons. J Neurophysiol. 1998a;79:1746–1754. doi: 10.1152/jn.1998.79.4.1746. [DOI] [PubMed] [Google Scholar]
- Scholz A, Appel N, Vogel W. Two types of TTX-resistant and one TTX-sensitive Na+ channel in rat dorsal root ganglion neurons and their blockade by halothane. Eur J Neurosci. 1998b;10:2547–2556. [PubMed] [Google Scholar]
- Scholz A, Vogel W. Tetrodotoxin-resistant action potentials in dorsal root ganglion neurons are blocked by local anesthetics. Pain. 2000;89:47–52. doi: 10.1016/S0304-3959(00)00345-6. [DOI] [PubMed] [Google Scholar]
- Shiraishi M, Harris RA. Effects of alcohols and anesthetics on recombinant voltage-gated Na+ channels. J Pharmacol Exp Ther. 2004;309:987–994. doi: 10.1124/jpet.103.064063. [DOI] [PubMed] [Google Scholar]
- Stadnicka A, Kwok WM, Hartmann HA, Bosnjak ZJ. Effects of halothane and isoflurane on fast and slow inactivation of human heart hH1a sodium channels. Anesthesiology. 1999;90:1671–1683. doi: 10.1097/00000542-199906000-00024. [DOI] [PubMed] [Google Scholar]
- Vatta M, Ackerman MJ, Ye B, Makielski JC, Ughanze EE, Taylor EW, Tester DJ, Baligepalli RC, Foell JD, Li Z, Kamp TJ, Towbin JA. Mutant caveolin-3 induces persistent late sodium current and is associated with long-QT sydrome. Circulation. 2006;114:2104–2112. doi: 10.1161/CIRCULATIONAHA.106.635268. [DOI] [PubMed] [Google Scholar]
- Wick MJ, Mihic SJ, Ueno S, Mascia MP, Trudell JR, Brozowski SJ, Ye Q, Harrison NL, Harris RA. Mutations of gamma-aminobutyric acid and glycine receptors change alcohol cutoff: evidence for an alcohol receptor? Proc Natl Acad Sci USA. 1998;95:6504–6509. doi: 10.1073/pnas.95.11.6504. [DOI] [PMC free article] [PubMed] [Google Scholar]
- Wong SM, Tauck DL, Fong EG, Kendig JJ. Glutamate receptor-mediated hyperexcitability after ethanol exposure in isolated neonatal rat spinal cord. J Pharmacol Exp Ther. 1998;285:201–207. [PubMed] [Google Scholar]
- Wood JN, Boorman JP, Okuse K, Baker MD. Voltage-gated sodium channels and pain pathways. J Neurobiol. 2004;61:55–71. doi: 10.1002/neu.20094. [DOI] [PubMed] [Google Scholar]
- Wu JV, Kendig JJ. Differential sensitivities of TTX-resistant and TTX-sensitive sodium channels to anesthetic concentrations of ethanol in rat sensory neurons. J Neurosci Res. 1998;54:433–443. doi: 10.1002/(SICI)1097-4547(19981115)54:4<433::AID-JNR1>3.0.CO;2-A. [DOI] [PubMed] [Google Scholar]
- Zuo Y, Aistrup GL, Marszalec W, Gillespie A, Chavez-Noriega LE, Yeh JZ, Narahashi T. Dual action of n-alcohols on neuronal nicotinic acetylcholine receptors. Mol Pharmacol. 2001;60:700–711. [PubMed] [Google Scholar]