

Abstract
Vitamin D3 can be hydroxylated sequentially by cytochrome P450scc (CYP11A1) producing 20-hydroxyvitamin D3, 20,23-dihydroxyvitamin D3 and 17,20,23-trihydroxyvitamin D3. The aim of this study was to characterize the ability of vitamin D3 to associate with phospholipid vesicles and to determine the kinetics of metabolism of vitamin D3 by P450scc in vesicles and in 2-hydroxypropyl-β-cyclodextrin (cyclodextrin). Gel filtration of phospholipid vesicles showed that the vitamin D3 remained quantitatively associated with the phospholipid membrane. Vitamin D3 exchanged between vesicles at a rate 3.8-fold higher than for cholesterol exchange and was stimulated by N-62 StAR protein. The Km of P450scc for vitamin D3 in vesicles was 3.3 mol vitamin D3/mol phospholipid and the rate of conversion of vitamin D3 to 20-hydroxyvitamin D3 was first order with respect to the vitamin D3 concentration for the range of concentrations of vitamin D3 that could be incorporated into the vesicle membrane. 20-Hydroxyvitamin D3 was further hydroxylated by P450scc in vesicles, producing primarily 20,23-dihydroxyvitamin D3, with Km and kcat values 22- and 6-fold lower than those for vitamin D3, respectively. 20,23-Dihydroxyvitamin D3 was converted to 17,20,23-trihydroxyvitamin D3 with even lower Km and kcat values. Vitamin D3 and cholesterol were metabolized with comparable efficiencies in cyclodextrin, but the Km for both showed a strong dependence on the cyclodextrin concentration, decreasing with decreasing cyclodextrin. This study shows that vitamin D3 quantitatively associates with phospholipid vesicles, can exchange between membranes, and can be hydroxylated by membrane-associated P450scc but with lower efficiency than for cholesterol hydroxylation. The kcat values for metabolism of vitamin D3 in vesicles and 0.45% cyclodextrin are similar, but the ability to solubilize vitamin D3 at a concentration higher than its Km makes the cyclodextrin system more efficient for producing the hydroxyvitamin D3 metabolites for further characterization.
Keywords: Cytochrome P450scc, CYP11A1, Vitamin D3, Hydroxyvitamin D3, Phospholipid membrane
1. Introduction
Cytochrome P450scc catalyzes the conversion of cholesterol to pregnenolone which is the first catalytic step in the synthesis of steroid hormones (Tuckey, 2005). The reaction involves removal of the side chain of cholesterol via production of enzyme-bound intermediates, 22R-hydroxycholesterol and 20α,22R-dihydroxycholesterol (Hume et al., 1984; Lambeth et al., 1982; Tuckey, 1990, 2005). Cytochrome P450scc can also metabolize vitamin D3 (D3) and vitamin D2 (D2), as well as their precursors 7-dehydrocholesterol and ergosterol (Guryev et al., 2003; Slominski et al., 2004, 2005a,b, 2006; Tuckey et al., 2008). Our most recent study shows that P450scc can hydroxylate D3 at carbons 17, 20 and 23 (Tuckey et al., 2008). The major pathway of metabolism involves initial hydroxylation at C20 followed by C23 and C17, producing 20-hydroxyvitamin D3 (20(OH)D3), 20,23-dihydroxyvitamin D3 (20,23(OH)2D3) and 17,20,23-trihydroxyvitamin D3 (17,20,23(OH)3D3) as the major products. Minor products result from the hydroxylations occurring in a different order. 20(OH)D3 and 20,23(OH)2D3 accumulate indicating that these derivatives can escape from the active site of the enzyme. It should be noted that earlier reports incorrectly identified 20,23(OH)2D3 as 20,22(OH)2D3 (Guryev et al., 2003; Slominski et al., 2005b).
The active form of D3, 1,25-dihydroxyvitamin D3 (1,25(OH)2D3), has antiproliferative effects and promotes differentiation in a number of cell types including keratinocytes (Bikle, 2004; Holick, 2003a,b). We have found that the major product of D3 metabolism by P450scc, 20(OH)D3, also inhibits proliferation and stimulates differentiation of keratinocytes with a similar potency to that of 1,25(OH)2D3 (Zbytek et al., in press). Thus, at least one of the products of P450scc action on D3 is biologically active and may have potential therapeutic actions. It may also have physiological actions if it is produced in sufficient amounts in vivo, such as in skin where a low concentration of P450scc is found (Slominski et al., 2004) and D3 is produced (Holick, 2003a,b), or in the adrenal gland, which has a high P450scc content and may receive vitamin D from the bloodstream. Isolated rat adrenal mitochondria produce a number of hydroxyvitamin D derivatives when supplied with exogenous D3 and the synthesis of at least some of these involves P450scc (Slominski et al., 2005b). Metabolism of D3 by P450scc in vivo would require that it compete with cholesterol. To further assess this possibility we have determined the kinetics of D3 metabolism by P450scc incorporated into phospholipid vesicles to mimic the inner-mitochondrial membrane where P450scc resides. The major products, 20(OH)D3 and 20,23(OH)2D3, were purified and tested as substrates to determine the rate of each hydroxylation. We compared the use of 2-hydroxypropyl-β-cyclodextrin (cyclodextrin) and phospholipid vesicles for dissolving D3 to make it available to P450scc. Both of these systems have been used previously with data for cyclodextrin suggesting that D3 and cholesterol are metabolized at similar rates, whereas in phospholipid vesicles, D3 appears to be metabolized more slowly (Guryev et al., 2003; Slominski et al., 2005b). In addition, we tested the ability of D3 to incorporate quantitatively into phospholipid membranes and exchange between membranes.
2. Methods
2.1. Preparation of enzymes and hydroxyvitamin D3 derivatives
Adrenodoxin reductase and P450scc were purified from bovine adrenal mitochondria (Tuckey and Stevenson, 1984a,b). The concentration of cytochrome P450scc was determined from the CO-reduced minus reduced difference spectrum using an extinction coefficient of 91,000 M−1 cm−1 for the absorbance difference between 450 nm and 490 nm (Omura and Sato, 1964). Adrenodoxin was expressed in Escherichia coli and purified as previously described (Woods et al., 1998). N-62 StAR was a gift from Walter Miller (University of California, San Francisco). 20(OH)D3 and 20,23(OH)2D3 were prepared enzymatically from 50 ml incubations of P450scc with D3 and purified by preparative TLC as described before (Slominski et al., 2005b). The purity of these samples was checked prior to use by HPLC (Tuckey et al., 2008). The concentration of hydroxyvitamin D3 was determined using an extinction coefficient of 18,000 M−1 cm−1 at 263 nm (Hiwatashi et al., 1982).
2.2. Measurement of cytochrome P450scc activity in phospholipid vesicles
Vesicles were prepared from dioleoyl phosphatidylcholine and bovine heart cardiolipin in the ratio 85:15 (mol/mol). Where required, D3, hydroxyvitamin D3 or cholesterol was added to the phospholipid (see Section 3). Buffer comprising 20 mM HEPES (pH 7.4), 100 mM NaCl, 0.1 mM dithiothreitol and 0.1 mM EDTA was added to 1.25 μmol of phospholipid and the mixture sonicated for 10 min in a bath-type sonicator (Tuckey and Kamin, 1982). Purified P450scc was incorporated into the vesicle membrane by incubation with the vesicles for 20 min at room temperature (Tuckey and Kamin, 1982). The incubation mixture comprised 510 μM phospholipid vesicles, cytochrome P450scc (0.2−2 μM), 15 μM adrenodoxin, 0.2 μM adrenodoxin reductase, 2 mM glucose 6-phosphate, 2 U/ml glucose 6-phosphate dehydrogenase and 50 μM NADPH, in the buffer used for sonication. Samples were preincubated for 8 min, reactions started by the addition of NADPH and incubations carried out at 37 °C in a shaking water bath. Typical incubation volumes were 0.2−1.0 ml. Reactions were stopped by the addition of 2 ml ice-cold dichloromethane. After centrifugation to separate phases, the lower dichloromethane phase was retained and the aqueous phase re-extracted twice more with 2 ml dichloromethane. The dichloromethane was removed under nitrogen and samples dissolved in 64% methanol in water for HPLC analysis.
Incubation times were kept short (3−5 min) in experiments designed to measure the kinetic constants of P450scc to ensure initial rates were measured. Time courses were carried out to confirm initial rates were linear for the incubation times used. Short incubation times avoided the more complex kinetics that occurred later in the incubation resulting from intermediates of D3 metabolism acting as competitive substrates. Products were identified based on their retention times compared to authentic standards, whose structures were identified in our previous report (Tuckey et al., 2008).
2.3. Measurement of P450scc activity with substrates dissolved in cyclodextrin
Incubations were carried out as described for phospholipid vesicles except that the vesicles were replaced by 2-hydroxypropyl-β-cyclodextrin at a final concentration of 0.45−4.5%. Substrates were initially dissolved in 45% cyclodextrin (typically 5−8 mM) (De Caprio et al., 1992). These solutions were diluted as necessary (see Section 3) with 45% cyclodextrin to ensure that the final cyclodextrin concentration was consistent for the range of substrate concentrations being tested. Samples were extracted and prepared for HPLC analysis as described for the incubations with vesicles.
2.4. HPLC analysis of vitamin D metabolites
Reverse phase HPLC was performed using a PerkinElmer HPLC equipped with a C18 column (Brownlee Aquapore, 2 cm × 4.6 mm, particle size 7 μm). Samples were applied in 64% methanol and eluted with a 64−100% methanol gradient in water, at a flow rate 0.5 ml/min. Products were detected with a UV monitor at 265 nm. The percentage of substrate and each product in relation to the total secosteroid present was determined from peak integration and converted to moles of substrate consumed or product produced from the known initial concentration of substrate. For kinetic assays, rates of substrate depletion were used to determine Km and kcat values since in some assays multiple products were produced (see Section 3). The coefficient of variation between assays determined for six separate incubations was 1.0% and the lower limit of detection was 5 pmol secosteroid.
2.5. Gel filtration of phospholipid vesicles
Vesicles were prepared with a molar ratio of D3 to phospholipid of 0.2 by sonicating dioleoyl phosphatidylcholine (3.24 μmol), cardiolipin (0.57 μmol), D3 (0.75 μmol) and tracer di[1-14C]palmitoyl phosphatidylcholine (0.02 μCi) in a final volume of 1.5 ml. Gel filtration was carried out using a Sepharose 4B column (1.5 cm × 60 cm) equilibrated with the same buffer used to prepare the vesicles (Kisselev et al., 1999). Aliquots of each fraction (0.25 ml) were diluted to 1.0 ml with ethanol to remove vesicle turbidity and spectra recorded against a 75% ethanol blank. The D3 concentration was measured from the absorbance at 263 nm taken from each spectrum using an extinction coefficient of 18,000 M−1 cm−1 (Hiwatashi et al., 1982). The elution profile of the vesicles was determined by measuring the di[1-14C]palmitoyl phosphatidylcholine in 1 ml of each fraction by scintillation counting.
2.6. Measurement of cholesterol and vitamin D exchange between membranes
The procedure used is based on that described previously (Tuckey et al., 2004). Acidic donor vesicles comprising dioleoyl phosphatidylcholine and cardiolipin (15:15, mol/mol), plus D3 or [4-14C]cholesterol (0.1 μCi) at a molar ratio to phospholipid of 0.2, were prepared by sonication as described above. Neutral acceptor vesicles were similarly prepared from dioleoyl phosphatidylcholine. N-62 StAR or buffer (10 μl) was preincubated with donor vesicles (1.2mM) for 5 min at 35 °C and the transfer reaction initiated by the addition of neutral acceptor vesicles (1.2 mM). The final incubation volume was 210 μl. After incubation at 35 °C for 2 min, acidic donor vesicles were removed by chromatography on diethylaminoethyl (DEAE)-Sepharose (3 cm × 0.75 cm) as described previously (Tuckey et al., 2002, 2004). The amount of [4-14C]cholesterol in the neutral acceptor vesicles passing through the column was measured by scintillation counting. The amount of D3 in the neutral acceptor vesicles passing through the column was determined from its absorption spectrum measured after diluting samples with an equal volume of ethanol.
2.7. Measurement of visible spectra and Kd values for substrates dissolved in cyclodextrin
Cyclodextrin solutions of cholesterol and D3 were prepared as described above. Spectra were recorded from 500 nm to 350 nm with a Shimadzu Spectrophotometer (UV-1601) in a cuvette volume of 1 ml comprising 0.7 μM P450scc, 20 mM HEPES (pH 7.4), 100 mM NaCl, 0.1 mM dithiothreitol and 0.1 mM EDTA. For determining Kd, the final cyclodextrin concentration was kept constant over the range of substrate concentrations tested (see Section 3). Each spectrum was recorded against a blank which contained all components except P450scc.
3. Results
3.1. Association of D3 with phospholipid membranes
To test the ability of D3 to be incorporated into the membrane of phospholipid vesicles, small unilamellar vesicles were prepared from phospholipid and D3 and subjected to gel filtration (Fig. 1). The elution profile of D3 matched that of the vesicles showing that the D3 remained associated with the vesicle membrane during the chromatography. The molar ratio of D3 to phospholipid in the fractions representing the vesicle peak (40−85 ml) was 0.194 ± 0.003 (mean ± S.D.), which is within experimental error of the expected ratio of 0.20. Thus D3 quantitatively associates with the vesicle membrane at a ratio to phospholipid that is consistent over the size distribution of the vesicles.
Fig. 1.
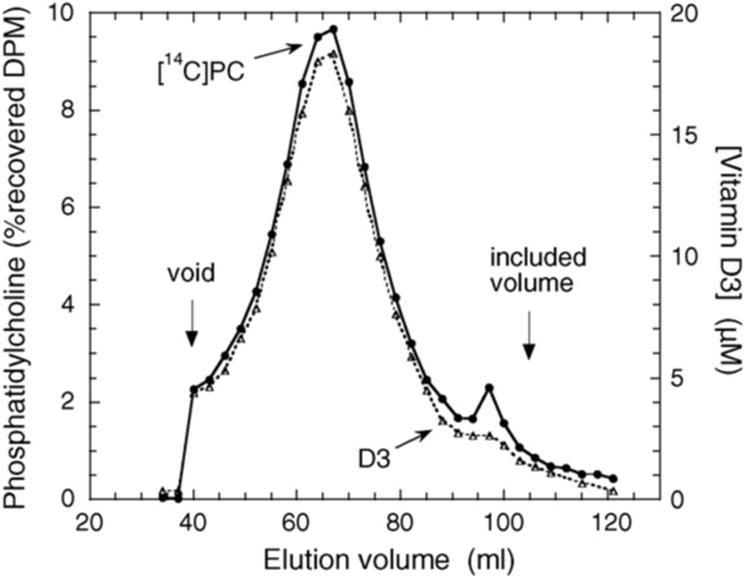
Gel filtration elution profile of D3 associated with phospholipid vesicles. Vesicles made from dioleoyl phosphatidylcholine, cardiolipin, D3 and tracer di[1-14C]dipalmitoyl phosphatidylcholine were applied to a Sepharose 4B column and 3 ml fractions collected. Radiolabelled phosphatidylcholine (PC) was measured by scintillation counting and D3 concentration measured by its absorbance at 263 nm. Arrows indicate the void and included volumes of the column.
3.2. Transfer of D3 between membranes and the effect of the StAR protein
The ability of D3 to exchange between membranes was assessed by determining the transfer rate of D3 from acidic donor vesicles to neutral acceptor vesicles in an assay used previously to measure the transfer of cholesterol by the StAR protein and MLN64 (Tuckey et al., 2004). The basal rate of transfer of D3 between vesicles was 3.8-fold higher than for cholesterol (Table 1). N-62 StAR (2 μM) stimulated the rate of cholesterol transfer 10-fold and D3 transfer 2.7-fold. Because of the higher basal rate, the overall rate of transfer of D3 observed with 2 μM N-62-StAR was similar to that for cholesterol. Increasing the concentration of N-62 StAR to 6 μM further increased the rate of D3 transfer over that observed with 2 μM N-62 StAR.
Table 1.
Rates of transfer of cholesterol and D3 between vesicles and stimulation by N-62 StAR protein
| Conditions | % Sterol transferred/2 min |
|---|---|
| Cholesterol | 1.8 ± 0.1 |
| Cholesterol + 2 μM StAR | 17.4 ± 1.3 |
| D3 | 6.7 ± 0.2 |
| D3 + 2 μM StAR | 17.9 ± 0.8 |
| D3 + 6 μM StAR | 26.9 ± 0.3 |
Data are the mean ± S.D. of triplicate assays.
3.3. Kinetics of metabolism of D3 by P450scc in vesicles
In phospholipid vesicles the Km of P450scc for D3 is very high compared to that for cholesterol (Table 2). As it is not possible to get more than approximately 0.4 mol D3 per mol phospholipid into the vesicle bilayer by sonication, a large extrapolation was involved in determining kcat, hence the large error associated with measurement of the Km and kcat values for D3 (Fig. 2A). Nevertheless, it is clear from kcat/Km values that D3 is metabolized by P450scc with lower efficiency than cholesterol in vesicles. The major product resulting from D3 metabolism by P450scc in the 5 min incubation time used to determine the kinetic parameters was 20(OH)D3 (approximately 85% of total products), with most of the remainder being 20,23(OH)2D3, consistent with our previous study (Tuckey et al., 2008).
Table 2.
Kinetic parameters for metabolism of D3 and hydroxyvitamin D3 derivatives by cytochrome P450scc in phospholipid vesicles
| Substrate | Km (mol/mol PL) | kcat (min−1) | kcat/Km ((mol/mol PL)−1 min−1) |
|---|---|---|---|
| Cholesterol | 0.21 ± 0.04 | 46 ± 5 | 218 |
| D3 | 3.3 ± 1.5 | 20 ± 8 | 6.1 |
| 20(OH)D3 | 0.15 ± 0.01 | 3.6 ± 0.1 | 24 |
| 20,23(OH)2D3 | 0.022 ± 0.006 | 1.5 ± 0.1 | 68 |
Kinetic constants were determined for cholesterol, D3, 20(OH)D3 and 20,23(OH)2D3 in vesicles prepared from dioleoyl phosphatidylcholine and cardiolipin, as described for Table 3. Values for Km and kcat are mean ± S.E. from the hyperbolic curve fitted to the data from one experiment.
Fig. 2.
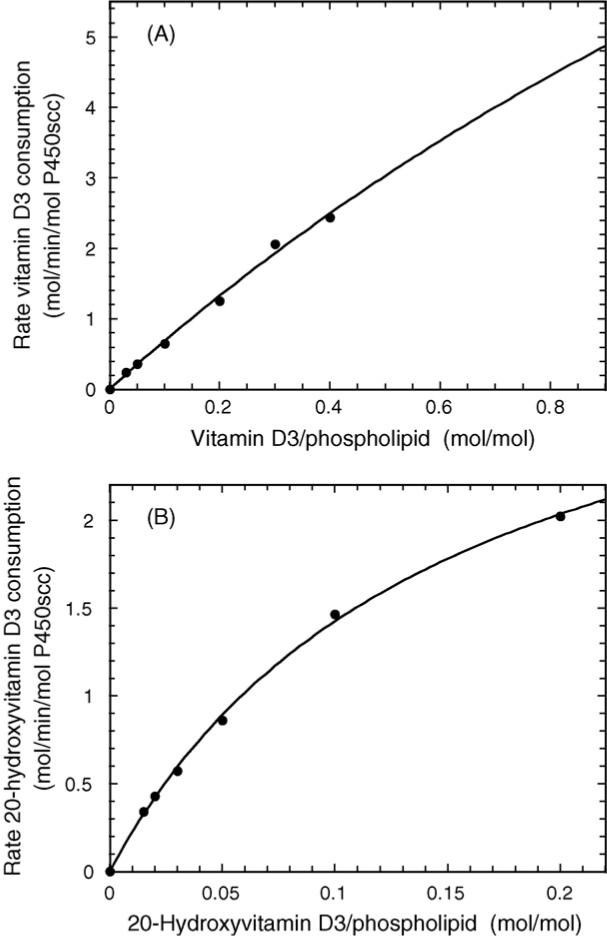
Michaelis–Menten plots for metabolism of D3 and 20(OH)D3 by P450scc. Cytochrome P450scc was incorporated into phospholipid vesicles containing D3 (A) or 20(OH)D3 (B) and incubated at 37 °C for 5 min in a reconstituted system containing adrenodoxin (15 μM) and adrenodoxin reductase (0.2 μM). Products were extracted and analyzed by reverse-phase HPLC. Hyperbolic curves were fitted by non-linear least squares analysis using Kaleidagraph 3.6. The correlation coefficients for the curve fits were 0.9975 and 0.9994 for D3 and 20(OH)D3, respectively.
When purified 20(OH)D3 was used as a substrate for P450scc, good adherence to Michaelis–Menten kinetics was observed for the substrate dissolved in the membrane bilayer (Fig. 2B). 20(OH)D3 gave a substantially lower Km compared to that observed for D3, but also caused a decrease in kcat (Table 2). The resulting kcat/Km value was 4-fold higher than that for D3, suggesting that once formed, 20(OH)D3 can compete effectively with D3 for further hydroxylation. The major product of 20(OH)D3 metabolism in the 3 min incubation time used to determine the kinetics was 20,23(OH)2D3 (Fig. 3). Some 17,23(OH)2D3 and a small amount of 17,20,23(OH)3D3 were also produced. The proportion of 17,20,23(OH)3D3 increased with longer incubation times (Fig. 3).
Fig. 3.
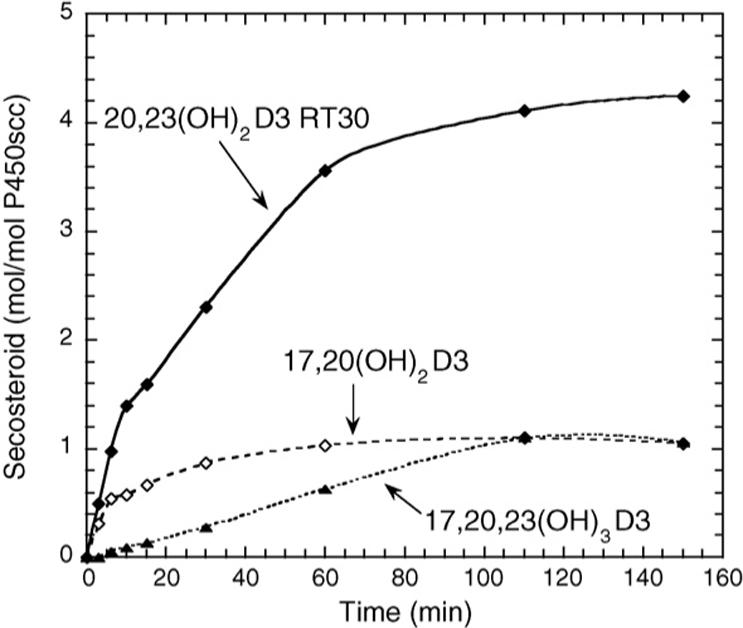
Time course for metabolism of 20(OH)D3 in phospholipid vesicles. Vesicles containing 0.1 mol 20(OH)D3/mol phospholipid (B) were incubated with 2.0 μM P450scc in a reconstituted system containing adrenodoxin and adrenodoxin reductase. Samples were taken at the times indicated and products measured by HPLC.
When purified 20,23(OH)2D3 was tested as a substrate for P450scc, it was hydroxylated with a kcat less than half that for 20(OH)D3, but with a Km 7-fold lower (Table 2). Thus the kcat/Km for 20,23(OH)2D3 is 3-fold higher than that for 20(OH)D3 and 11-fold higher than for D3. In the 3 min incubation time used to measure the kinetics of 20,23(OH)2D3 metabolism by P450scc, 17,20,23(OH)3D3 was the sole product.
Since there is a trend to lower Km values (suggesting tighter binding) as hydroxyl groups are added to D3 and the overall hydroxylation rate declines as products accumulate, we tested whether the final product, 17,20,23(OH)3D3, inhibits D3 metabolism. When purified 17α,20,23(OH)3D3 and D3 were included in the same vesicles at a molar ratio to phospholipid of 0.020 and 0.030, respectively, the initial rate of D3 metabolism was inhibited 22% compared to that for vesicle that contained just D3. When the molar ratios of 17α,20,23(OH)3D3 and D3 to phospholipid were 0.050 and 0.025, respectively, the inhibition increased to 65%.
3.4. Effect of cyclodextrin concentration on binding and kinetics of metabolism of cholesterol and D3 by P450scc
Cyclodextrin derivatives are commonly used to solubilize low solubility compounds, such as cholesterol and vitamin D, to increase the biological availability of these compounds in aqueous solutions (De Caprio et al., 1992; Wallimann et al., 1997). Compounds are initially made up in a high concentration of cyclodextrin (typically 45%) then can be diluted into culture or assay systems without the substrate precipitating. Our initial studies to determine the Km of P450scc for D3 and cholesterol using a final concentration of 4.5% cyclodextrin gave values orders of magnitude higher than other researchers have reported using this method of substrate solubilization (Guryev et al., 2003; Pikuleva et al., 2001). We therefore tested the effects of the cyclodextrin concentration on Km and kcat for these substrates (Table 3). The cyclodextrin concentration had a large influence on Km values for both D3 and cholesterol, with a 10-fold decrease in cyclodextrin causing a 124-fold decrease in the Km for D3 and 130-fold for cholesterol. The catalytic rate constants (kcat) decreased about 2.5-fold for cholesterol and 5-fold for D2 with the 10-fold decrease in cyclodextrin concentration, so the overall efficiency of the enzyme (given by kcat/Km) increased by 50-and 25-fold, respectively, with the shift to lower cyclodextrin concentration. D3 displayed a higher kcat and higher Km than cholesterol at both cyclodextrin concentrations. 20(OH)D3 displayed a higher Km and lower kcat than D3 in 0.45% cyclodextrin resulting in a 6-fold decrease in kcat/Km.
Table 3.
The effect of cyclodextrin concentration on the kinetic parameters for metabolism of cholesterol and D3 by P450scc
| Substrate | 0.45% Cyclodextrin |
4.5% Cyclodextrin |
||||
|---|---|---|---|---|---|---|
| Km (μM) | kcat (min−1) | kcat/Km (mM−1 min−1) | Km (μM) | kcat (min−1) | kcat/Km (mM−1 min−1) | |
| Cholesterol | 9.1 ± 1.7 | 6.1 ± 0.4 | 670 | 1180 ± 290 | 14.9 ± 2.7 | 12.7 |
| D3 | 29.6 ± 2.4 | 19.7 ± 0.9 | 666 | 3670 ± 610 | 96 ± 13 | 26.1 |
| 20(OH)D3 | 67.0 ± 13 | 7.4 ± 1.0 | 110 | ND | ND | ND |
Kinetic constants were determined for cholesterol, D3 and 20(OH)D3 from the rate of substrate consumption as described in Section 2. Values for Km and kcat are mean ± S.E. from the hyperbolic curve fitted to the data from one experiment by least-squares non-linear regression using Kaleidagraph 3.6. ND, not determined.
To further test the effect of cyclodextrin concentration on P450scc, we measured the Kd for cholesterol binding from the spin-state change (Fig. 4). The Kd decreased from 372 μM to 3.2 μM with a decrease in cyclodextrin concentration from 4.5% to 0.45%. With 4.5% cyclodextrin the P450scc appeared almost completely low spin. With 0.45% cyclodextrin the P450scc was partially high spin with a distinct shoulder at 392 nm, indicating that a portion of the endogenous cholesterol that co-purified with the P450scc remained bound (Fig. 5A). The ΔAmax in Fig. 4 is less with 0.45% cyclodextrin than with 4.5% since the cytochrome is initially in a higher spin state. When the cyclodextrin concentration was further reduced to 0.09% the P450scc was almost completely high spin (Fig. 5A), indicating even tighter binding of the endogenous cholesterol and hence the Kd for binding of exogenous cholesterol could not be determined. Adding 12 μM D3 to P450scc in 0.45% cyclodextrin that had a mixed spin state due to the addition of 4 μM cholesterol, failed to induce a change to either higher or lower spin (Fig. 5B), indicating that D3 binding to the oxidized cytochrome is much weaker than cholesterol binding.
Fig. 4.
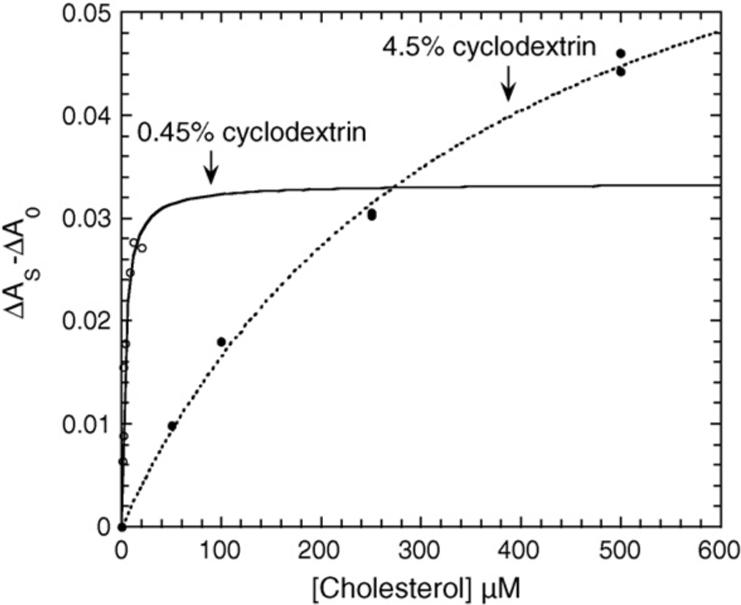
The effect of cyclodextrin concentration on the Kd for cholesterol binding to cytochrome P450scc. Cytochrome P450scc (0.7 μM) was incubated with cholesterol dissolved in cyclodextrin to a final concentration of either 0.45% or 4.5% and spectra recorded from 500 nm to 350 nm. ΔAs is the absorbance difference (416−392 nm) in the presence of cholesterol, ΔA0 is the absorbance difference (416−392 nm) in the absence of cholesterol. Hyperbolic binding curves were fitted using non-linear least squares analysis with Kaleidagraph 3.6.
Fig. 5.
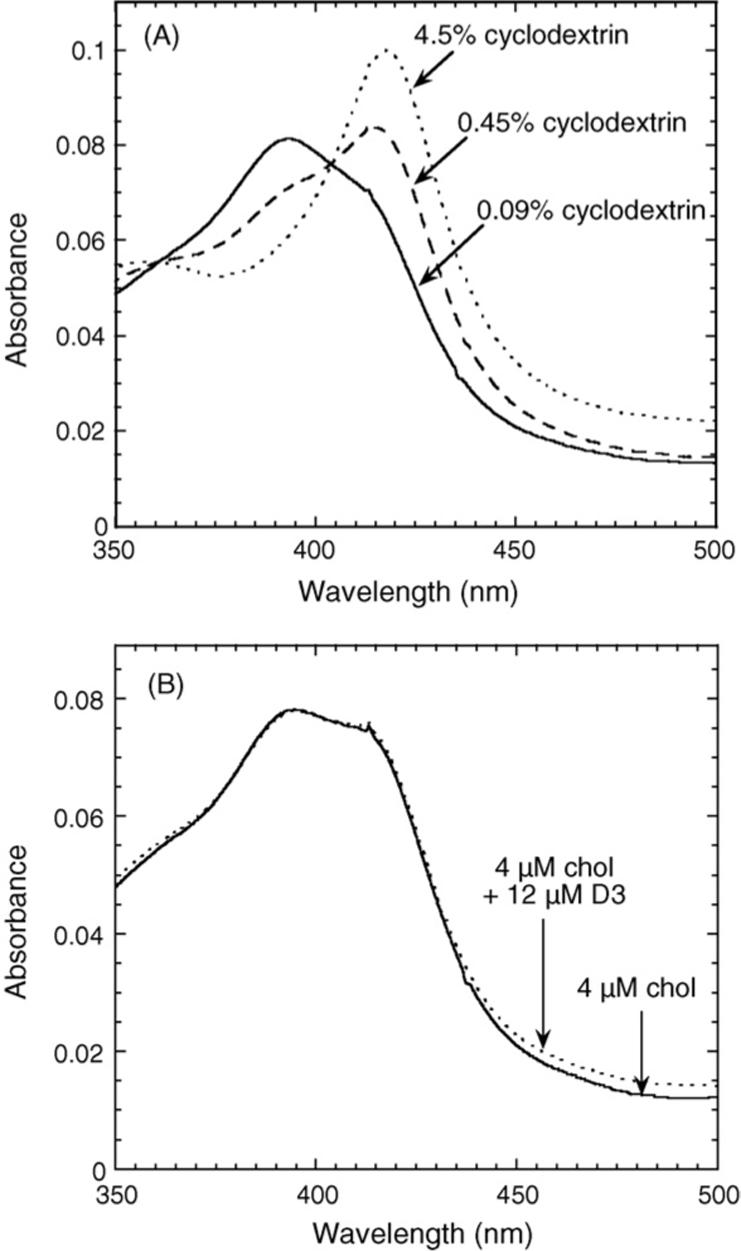
Effects of cyclodextrin concentration and substrates on the spin state of cytochrome P450scc. (A) Spectra of purified bovine adrenal P450scc (0.7 μM) were recorded at the indicated cyclodextrin concentrations. (B) The spectrum of P450scc (0.7 μM) was recorded in 0.45% cyclodextrin containing 4 μM exogenous cholesterol (chol), or 4 μM exogenous cholesterol plus 12 μM D3.
4. Discussion
Despite the hydrophobic nature of D3 and its metabolism by membrane-associated enzymes, there is a shortage of information on the interaction of D3 with phospholipid membranes. It has been shown that D3 associates with saturated phospholipids in multilamellar liposomes and at high molar ratios to phospholipid can abolish the phase transition (Bondar and Rowe, 1995; Castelli et al., 1990). D3 and some hydroxyvitamin D3 derivatives have been reported to be efficiently incorporated into the bilayer of egg phosphatidylcholine liposomes as a vehicle for drug delivery (Merz and Sternberg, 1994). D2 has been reported to associate with dipalmitoyl phosphatidylcholine membranes with low concentrations promoting membrane ordering and high concentrations (12 mol%) causing membrane disorder (Kazanci et al., 2001; Toyran and Severcan, 2003, 2007). It is proposed that the hydroxyl group of D2 is near the hydrophilic surface of the membrane. Our study shows that when unilamellar phospholipid vesicles are prepared by sonication, D3 quantitatively associates with the phospholipid membrane. This D3 is able to exchange between membranes at a rate higher than that for cholesterol exchange, suggesting that D3 is more loosely associated with the phospholipid bilayer than cholesterol. Cholesterol is delivered to the inner mitochondrial membrane where P450scc resides by the StAR protein, a step that regulates the rate of steroid synthesis in the adrenal cortex, corpus luteum and testis (Miller, 2007; Stocco, 2000). Our study shows that N-62 StAR stimulates D3 exchange between artificial membranes, although to a lesser degree than that seen for cholesterol. N-62 StAR has 62 amino acids deleted form the N-terminus to facilitate bacterial expression (Bose et al., 1998). These are not necessary for StAR to transport cholesterol with the essential START domain of the protein which binds cholesterol being intact (Bose et al., 1998; Soccio and Breslow, 2003). The ability of D3 to exchange between membranes more rapidly than cholesterol may be important for the intracellular movement of D3 to the inner mitochondrial membrane for metabolism by P450scc or to the microsomal membrane for 25-hydroxylation by CYP2R1 or other P450s (Prosser and Jones, 2004). Specific transporters such as the StAR protein, or other START domain proteins with uncharacterized functions (Miller, 2007; Soccio and Breslow, 2003), could also play a role in intracellular D3 transport.
β-Cyclodextrins bind hydrophobic substrates such as cholesterol and D3 and hold them in solution (De Caprio et al., 1992; Wallimann et al., 1997). Cholesterol binds to β-cyclodextrin with a Kd of 62 μM. Binding strength decreases with increasing steroid solubility (Wallimann et al., 1997). Our study shows that the concentration of 2-hydroxypropyl-β-cyclodextrin has a dramatic effect on the Kd and Km values for the interaction of cholesterol and D3 with P450scc. A decrease in the cyclodextrin concentration from 4.5% to 0.45% caused more than a 100-fold decrease in these parameters. Binding of cholesterol and D3 to P450scc must compete with binding of these molecules to the cyclodextrin. With the high sterol concentrations achievable with 4.5% cyclodextrin, most of the cholesterol and D3 will be cyclodextrin-bound. Thus, there will be little free sterol to bind to P450scc and hence the high “apparent” Km or Kd values for interaction with P450scc when these parameters are expressed in terms of the total sterol (free and cyclodextrin-bound) concentration. D3 has been reported to be encapsulated by two molecules of dimethyl β-cyclodextrin and such stoichiometry might also occur for cholesterol at high cyclodextrin concentrations (Wallimann et al., 1997). Therefore, the amount of D3 bound to this cyclodextrin will vary with the square of the β-cyclodextrin concentration. Such an effect could explain the 100-fold change in the Km of P450scc for these substrates with only a 10-fold change in the 2-hydroxypropyl-β-cyclodextrin concentration seen in the present study.
In vesicles, the rate of hydroxylation at C20 is given by the kcat obtained using D3 as substrate since 20(OH)D3 represents more than 85% of the product in the short incubation time used (5 min). Similarly, using 20(OH)D3 as substrate gives an estimate of the rate of hydroxylation at C23 since 20,23(OH)2D3 represents more than 70% of the products and using 20,23(OH)2D3 gives a measure of hydroxylation at C17. Hydroxylation at C20 is clearly favoured with the hydroxylation rate being 5-fold higher than at C23 and 13-fold higher than at C17. This is consistent with time courses we have previously reported for metabolism of D3 by P450scc, where D3 itself is the direct substrate for hydroxylation at the three positions. For short incubation times, 20(OH)D3 is produced well in excess of 23(OH)D3 and 17(OH)D3 (Tuckey et al., 2008). We did not measure the rate of all three hydroxylations in 0.45% cyclodextrin but hydroxylation at C20 occurs at a rate 2.7-fold higher than that at C23, consistent with the trend seen in vesicles. The present study was done with bovine P450scc and whether the human P450scc displays similar kinetics remains to be established. Preliminary studies with the human enzyme show that, like the bovine enzyme, the major product is 20(OH)D3.
It is not possible to get a high enough concentration of D3 into the vesicle membrane to saturate P450scc and thus D3 metabolism is essentially first order with respect to substrate concentration over the range of D3 concentrations that can be incorporated into the vesicle membrane. Both 20(OH)D3 and 20,23(OH)2D3 display considerably lower Km values than D3 in vesicles. Hence, as these products accumulate they are used in preference to D3 and the D3 consumption rate falls leaving much of the D3 unmetabolized, as seen in the time course for incubation of D3 with P450scc in vesicles (Tuckey et al., 2008). The final product of D3 metabolism by P450scc, 17α,20,23(OH)3D3, acts as an inhibitor of D3 metabolism, presumably competitive as they both can occupy the active site. This inhibition is likely to contribute to the decline in the rate of D3 metabolism as products accumulate.
In cyclodextrin, 20(OH)D3 is metabolized by P450scc with a higher Km than for D3, thus D3 competes effectively with this product for subsequent turnover by the enzyme. Hence almost complete consumption of D3 can be achieved in cyclodextrin, as we have reported previously (Tuckey et al., 2008). The cyclodextrin system for holding D3 in solution for metabolism by P450scc therefore offers some advantage over phospholipid vesicles for large-scale enzymatic production of the major metabolites. While the kcat values for metabolism of D3 in vesicles and 0.45% cyclodextrin are similar, the ability to solubilize substrate at a concentration higher than its Km also makes the cyclodextrin system more efficient for producing the hydroxyvitamin D3 metabolites for biological testing.
In contrast to cholesterol metabolism by P450scc where intermediates remain enzyme bound (Lambeth et al., 1982; Tuckey, 1990), conversion of D3 to 20(OH)D3 is accompanied by the dissociation of intermediates and their subsequent accumulation. In vesicles, 20(OH)D3 and 20,23(OH)2D3 have lower Km values than D3, but these values are still larger than those reported for intermediates in the conversion of cholesterol to pregnenolone, 22-hydroxycholesterol and 20α,22R-dihydroxycholesterol (Lambeth et al., 1982). It would appear that the dissociation of intermediates in the conversion of D3 to 20(OH)D3 is caused, at least in part, by their relatively weak binding to the active site of P450scc. The lower kcat displayed by D3, 20(OH)D3 and 20,23(OH)2D3, compared to that for cholesterol, might also contribute by providing a longer time in the P450scc catalytic cycle for the intermediates to escape.
In conclusion, our study shows that D3 incorporates into the bilayer of phospholipid membranes and can exchange between membranes at a faster basal rate than cholesterol. As for cholesterol, the transfer between membranes can be stimulated by the StAR protein. This provides a mechanism by which D3 may enter the inner mitochondrial membrane of steroidogenic tissues such as the adrenal cortex, to be metabolized by P450scc. Metabolism would be in competition with cholesterol. In phospholipid vesicles, cholesterol is the preferred substrate displaying lower Km and higher kcat values than those for D3. However, since cholesterol is subsaturating for P450scc in the adrenal cortex (Jefcoate et al., 1973), free enzyme would normally be available for metabolizing D3, especially during periods of low ACTH secretion, so competition would be small. Our previous study showing the production of hydroxyvitamin D3 metabolites when D3 is added to isolated rat adrenal mitochondria containing cholesterol, supports this view that D3 can be metabolized in competition with cholesterol (Slominski et al., 2005b). Some metabolism of D3 by P450scc in vivo would therefore seem likely and may have important physiological consequences since 20(OH)D3 is a potent inhibitor of proliferation and promoter of differentiation of human keratinocytes (Zbytek et al., in press).
Acknowledgements
This work was supported by NIH grant R01AR052190 to AS and RT and by the University of Western Australia.
References
- Bikle DD. Vitamin D regulated keratinocyte differentiation. J Cell Biochem. 2004;92:436–44. doi: 10.1002/jcb.20095. [DOI] [PubMed] [Google Scholar]
- Bondar PP, Rowe ES. Differential scanning calorimetric study of the effect of vitamin D3 on the thermotropic phase behavior of lipids model systems. Biochim Biophys Acta. 1995;1240:125–32. doi: 10.1016/0005-2736(95)00182-4. [DOI] [PubMed] [Google Scholar]
- Bose HS, Baldwin MA, Miller WL. Incorrect folding of steroidogenic acute regulatory protein (StAR) in congenital lipoid adrenal hyperplasia. Biochemistry. 1998;37:9768–75. doi: 10.1021/bi980588a. [DOI] [PubMed] [Google Scholar]
- Castelli F, Raudino A, Gurrieri S. Calcium ion influence on thermotropic behaviour of dipalmitoylphosphatidylcholine-vitamin D3 systems. Chem Phys Lipids. 1990;52:129–38. doi: 10.1016/0009-3084(90)90156-l. [DOI] [PubMed] [Google Scholar]
- De Caprio J, Yun J, Javitt NB. Bile acid and sterol solubilization in 2-hydroxypropyl-β-cyclodextrin. J Lipid Res. 1992;33:441–3. [PubMed] [Google Scholar]
- Guryev O, Carvalho RA, Usanov S, Gilep A, Estabrook RW. A pathway for the metabolism of vitamin D3: unique hydroxylated metabolites formed during catalysis with cytochrome P450scc (CYP11A1). Proc Natl Acad Sci USA. 2003;100:14754–9. doi: 10.1073/pnas.2336107100. [DOI] [PMC free article] [PubMed] [Google Scholar]
- Hiwatashi A, Nishii Y, Ichikawa Y. Purification of cytochrome P-450D1α (25-hydroxyvitamin D3-1α-hydroxylase) of bovine kidney mitochondria. Biochem Biophys Res Commun. 1982;105:320–7. doi: 10.1016/s0006-291x(82)80047-8. [DOI] [PubMed] [Google Scholar]
- Holick MF. Evolution and function of vitamin D. Recent Results Cancer Res. 2003a;164:3–28. doi: 10.1007/978-3-642-55580-0_1. [DOI] [PubMed] [Google Scholar]
- Holick MF. Vitamin D: a millenium perspective. J Cell Biochem. 2003b;88:296–307. doi: 10.1002/jcb.10338. [DOI] [PubMed] [Google Scholar]
- Hume R, Kelly RW, Taylor PL, Boyd GS. The catalytic cycle of cytochrome P-450scc and intermediates in the conversion of cholesterol to pregnenolone. Eur J Biochem. 1984;140:583–91. doi: 10.1111/j.1432-1033.1984.tb08142.x. [DOI] [PubMed] [Google Scholar]
- Jefcoate CR, Simpson ER, Boyd GS, Brownie AC, Orme-Johnson WH. The detection of different states of the P-450 cytochromes in adrenal mitochondria; changes induced by ACTH. Ann NY Acad Sci. 1973;212:243–61. doi: 10.1111/j.1749-6632.1973.tb47600.x. [DOI] [PubMed] [Google Scholar]
- Kazanci N, Toyran N, Haris PI, Severcan F. Vitamin D2 at high and low concentrations exert opposing effects on molecular order and dynamics of dipalmitoyl phosphatidylcholine membranes. Spectroscopy. 2001;15:47–55. [Google Scholar]
- Kisselev P, Tuckey RC, Woods S, Triantopolous T, Schwarz D. Enzymatic properties of vesicle-reconstituted human cytochrome P450scc (CYP11A1). Differences in functioning of the mitochondrial electron transfer chain using human and bovine adrenodoxin and activation by cardiolipin. Eur J Biochem. 1999;260:768–73. doi: 10.1046/j.1432-1327.1999.00206.x. [DOI] [PubMed] [Google Scholar]
- Lambeth JD, Kitchen SE, Farooqui AA, Tuckey R, Kamin H. Cytochrome P450scc-substrate interactions. Studies of binding and catalytic activity using hydroxycholesterols. J Biol Chem. 1982;257:1876–84. [PubMed] [Google Scholar]
- Merz K, Sternberg B. Incorporation of vitamin D3-derivatives into liposomes of different lipid types. J Drug Target. 1994;2:411–7. doi: 10.3109/10611869408996817. [DOI] [PubMed] [Google Scholar]
- Miller WL. Steroidogenic acute regulatory protein (StAR), a novel mitochondrial cholesterol transporter. Biochim Biophys Acta. 2007;1771:663–76. doi: 10.1016/j.bbalip.2007.02.012. [DOI] [PubMed] [Google Scholar]
- Omura T, Sato R. The carbon monoxide binding pigment of liver microsomes. I. Evidence for its hemoprotein nature. J Biol Chem. 1964;239:2370–8. [PubMed] [Google Scholar]
- Pikuleva IA, Puchkaev A, Bjorkhem I. Putative helix F contributes to regioselectivity of hydroxylation in mitochondrial cytochrome P450 27A1. Biochemistry. 2001;40:7621–9. doi: 10.1021/bi010193i. [DOI] [PubMed] [Google Scholar]
- Prosser DE, Jones G. Enzymes involved in the activation and inactivation of vitamin D. Trends Biochem Sci. 2004;29:664–73. doi: 10.1016/j.tibs.2004.10.005. [DOI] [PubMed] [Google Scholar]
- Slominski A, Semak I, Wortsman J, Zjawiony J, Li W, Zbytek B, et al. An alternative pathway of vitamin D2 metabolism. Cytochrome P450scc (CYP11A1)-mediated conversion to 20-hydroxyvitamin D2 and 17,20-dihydroxyvitamin D2. FEBS J. 2006;273:2891–901. doi: 10.1111/j.1742-4658.2006.05302.x. [DOI] [PMC free article] [PubMed] [Google Scholar]
- Slominski A, Semak I, Zjawiony J, Wortsman J, Gandy MN, Li J, et al. Enzymatic metabolism of ergosterol by cytochrome p450scc to biologically active 17alpha, 24-dihydroxyergosterol. Chem Biol. 2005a;12:931–9. doi: 10.1016/j.chembiol.2005.06.010. [DOI] [PubMed] [Google Scholar]
- Slominski A, Semak I, Zjawiony J, Wortsman J, Li W, Szczesniewski A, et al. The cytochrome P450scc system opens an alternate pathway of vitamin D3 metabolism. FEBS J. 2005b;272:4080–90. doi: 10.1111/j.1742-4658.2005.04819.x. [DOI] [PMC free article] [PubMed] [Google Scholar]
- Slominski A, Zjawiony J, Wortsman J, Semak I, Stewart J, Pisarchik A, et al. A novel pathway for sequential transformation of 7-dehydrocholesterol and expression of the P450scc system in mammalian skin. Eur J Biochem. 2004;271:4178–88. doi: 10.1111/j.1432-1033.2004.04356.x. [DOI] [PMC free article] [PubMed] [Google Scholar]
- Soccio RE, Breslow JL. StAR-related lipid transfer proteins: mediators of intracellular lipid metabolism. J Biol Chem. 2003;278:22183–6. doi: 10.1074/jbc.R300003200. [DOI] [PubMed] [Google Scholar]
- Stocco DM. Intramitochondrial cholesterol transfer. Biochim Biophys Acta. 2000;1486:184–97. doi: 10.1016/s1388-1981(00)00056-1. [DOI] [PubMed] [Google Scholar]
- Toyran N, Severcan F. Competitive effect of vitamin D2 and Ca2+ on phospholipid model membranes: an FTIR study. Chem Phys Lipids. 2003;123:165–76. doi: 10.1016/s0009-3084(02)00194-9. [DOI] [PubMed] [Google Scholar]
- Toyran N, Severcan F. Interaction between vitamin D2 and magnesium in liposomes: differential scanning calorimetry and FTIR spectroscopy studies. J Mol Struct. 2007;839:19–27. [Google Scholar]
- Tuckey RC. Side chain cleavage of cholesterol sulfate by ovarian mitochondria. J Steroid Biochem Mol Biol. 1990;37:121–7. doi: 10.1016/0960-0760(90)90380-4. [DOI] [PubMed] [Google Scholar]
- Tuckey RC. Progesterone synthesis by the human placenta. Placenta. 2005;26:273–81. doi: 10.1016/j.placenta.2004.06.012. [DOI] [PubMed] [Google Scholar]
- Tuckey RC, Bose HS, Czerwionka I, Miller WL. Molten globule structure and steroidogenic activity of N-218 MLN64 in human placental mitochondria. Endocrinology. 2004;145:1700–7. doi: 10.1210/en.2003-1034. [DOI] [PubMed] [Google Scholar]
- Tuckey RC, Headlam MJ, Bose HS, Miller WL. Transfer of cholesterol between phospholipid vesicles mediated by the steroidogenic acute regulatory protein. J Biol Chem. 2002;277:47123–8. doi: 10.1074/jbc.M206965200. [DOI] [PubMed] [Google Scholar]
- Tuckey RC, Kamin H. Kinetics of the incorporation of adrenal cytochrome P-450scc into phosphatidylcholine vesicles. J Biol Chem. 1982;257:2887–93. [PubMed] [Google Scholar]
- Tuckey RC, Li W, Zjawiony JK, Zmijewski MA, Nguyen MN, Sweatman T, et al. Pathways and products for the metabolism of vitamin D3 by cytochrome P450scc (CYP11A1). FEBS J. 2008;275:2585–96. doi: 10.1111/j.1742-4658.2008.06406.x. [DOI] [PMC free article] [PubMed] [Google Scholar]
- Tuckey RC, Stevenson PM. Properties of ferredoxin reductase and ferredoxin from the bovine corpus luteum. Int J Biochem. 1984a;16:489–95. doi: 10.1016/0020-711x(84)90165-4. [DOI] [PubMed] [Google Scholar]
- Tuckey RC, Stevenson PM. Properties of bovine luteal cytochrome P-450scc incorporated into artificial phospholipid vesicles. Int J Biochem. 1984b;16:497–503. doi: 10.1016/0020-711x(84)90166-6. [DOI] [PubMed] [Google Scholar]
- Wallimann P, Marti T, Furer A, Diederich F. Steroids in molecular recognition. Chem Rev. 1997;97:1567–608. doi: 10.1021/cr960373b. [DOI] [PubMed] [Google Scholar]
- Woods ST, Sadleir J, Downs T, Triantopoulos T, Headlam MJ, Tuckey RC. Expression of catalytically active human cytochrome P450scc in Escherichia coli and mutagenesis of isoleucine-462. Arch Biochem Biophys. 1998;353:109–15. doi: 10.1006/abbi.1998.0621. [DOI] [PubMed] [Google Scholar]
- Zbytek B, Janjetovic Z, Tuckey RC, Zmijewski MA, Sweatman T, Jones E, et al. 20-Hydroxycholecalciferol, a product of vitamin D3 hydroxylation by cytochrome P450sc, stimulates keratinocytes differentiation. J Invest Dermatol. doi: 10.1038/jid.2008.62. http://www.nature.com/doifinder/10.1038/jid.2008.62 in press. [DOI] [PMC free article] [PubMed]