

Abstract
Developing cartilaginous and ossified skeletal anlagen is encapsulated within a membranous sheath of flattened, elongated cells called, respectively, the perichondrium and the periosteum. These periskeletal tissues are organized in distinct morphological layers that have been proposed to support distinct functions. Classical experiments, particularly those using an in vitro organ culture system, demonstrated that these tissues play important roles in regulating the differentiation of the subjacent skeletal elements. However, there has been a lack of molecular markers that would allow analysis of these interactions. To understand the molecular bases for the roles played by the periskeletal tissues, we generated microarrays from perichondrium and periosteum cDNA libraries and used them to compare the gene expression profiles of these two tissues. In situ hybridization analysis of genes identified on the microarrays revealed many unique markers for these tissues and demonstrated that the histologically distinct layers of the perichondrium and periosteum are associated with distinct molecular expression domains. Moreover our marker analysis identified new domains that had not been previously recognized as distinct within these tissues as well as a previously uncharacterized molecular domain along the lateral edges of the adjacent developing cartilage that experimental analysis showed to be dependent upon the perichondrium.
INTRODUCTION
The endochondral skeletal elements form from chondrogenic condensations surrounded by a membranous sheath of flattened, elongated cells termed the perichondrium. The cells within the condensation differentiate through a series of well characterized steps. Hypertrophic differentiation is the terminal differentiation step of this process after which the cartilage cells undergo apoptosis and are replaced by bone-forming osteoblasts (Karsenty, 2003; Kronenberg, 2003). The sheath of cells surrounding the bone forming region of a long bone is referred to as the periosteum.
From morphological studies it is generally thought that the perichondrium differentiates into the periosteum (Bairati et al., 1996; Scott-Savage and Hall, 1980) in concert with the differentiation of the underlying skeletal tissue. However, as no definitive molecular markers exist to identify these tissues this model has not been definitively addressed. Both the perichondrium and the periosteum are reported to have two morphologically distinct layers. While the inner layer is proposed to contribute to appositional growth of cartilage and bone (Bairati et al., 1996; Pathi et al., 1999) the outer fibroblastic layer is thought to perform a structural role by offering attachment sites for tendons and ligaments (Scott-Savage and Hall, 1980).
Previous studies have shown that the signals from the perichondrium and the periosteum also play important roles in regulating events within the skeletal elements themselves. For example, it has been shown that two secreted signals, Indian hedgehog (Ihh) and parathyroid hormone-related peptide (PTHrP) form a negative feedback loop regulating the rate of hypertrophic differentiation (Lanske et al., 1996; Vortkamp et al., 1996). In this context Ihh produced by the prehypertrophic chondrocytes, regulates expression of PTHrP in the perichondrium at the articular surface of the cartilage and PTHrP in turn acts on the proliferating chondrocytes to block their further differentiation (Lanske et al., 1996; Vortkamp et al., 1996). In this regulatory pathway Ihh is thought to act directly on the perichondrium adjacent to the prehypertrophic cells. However, the mechanism by which the action of Ihh is transduced from the perichondrium to the peri-articular site of PTHrP production remains controversial (Alvarez et al., 2002; Koziel et al., 2004). One potential mechanism for this transduction has been proposed in which WSB-1, a hedgehog (Hh) inducible ubiquitin ligase, is specifically upregulated in the perichondrium. WSB-1 has been shown to modulate the local availability of an active form of thyroid hormone which in turn regulates the expression of PTHrP in the articular surface (Dentice et al., 2005).
Fgf18 is another signal made by the perichondrium that plays a key role in modulating growth of the subjacent skeletal elements. Fgf18 is required both for chondrocyte proliferation and for osteogenesis, acting through two distinct receptors (Liu et al., 2002; Ohbayashi et al., 2002). Fgf18 is regulated in the mouse perichondrium by Runx2 (Hinoi et al., 2006) although this transcription factor is not expressed in the chick perichondrium (data not shown). In vitro studies using mouse metatarsal organ culture have shown that Fgf18 expression in the perichondrium is also modulated by Tgfß signaling (Mukherjee et al., 2005).
Regulatory roles of the perichondrium, and the periosteum, on cartilage growth have also been explored in an organ culture assay system utilizing chick embryonic skeletal tissue (Long and Linsenmayer, 1998) in which cartilage growth can be compared in an intact long bone (tibiotarsus) rudiment to a tibiotarsus from which the perichondrium and periosteum have been removed. Results using this assay (Di Nino et al., 2002; Di Nino and Linsenmayer, 2003; Di Nino et al., 2001), suggest that multiple, diffusible regulatory factors – both positive and negative – are produced by the perichondrium and the periosteum, and that the interplay of these factors is essential for the proper formation of long bones. While some of these factors have been identified most remain elusive (Di Nino et al., 2002; Di Nino and Linsenmayer, 2003; Di Nino et al., 2001). These recent strides further underscore the need to decipher the gene expression program in the periskeletal tissues.
To lay the ground work for addressing the different roles played by the perichondrium and the periosteum during skeletal development, we generated microarrays from perichondrium and periosteum cDNA libraries and used them to compare the gene expression profiles of these two tissues. A number of genes were identified potentially having expression patterns restricted to these tissues. We validated these microarray results by in situ mRNA expression analysis. Our expression analysis revealed that the perichondrium and periosteum are indeed molecularly distinct tissues. In keeping with the existing knowledge, we observed that both the perichondrium and the periosteum have an inner layer and an outer layer which are molecularly distinct. Moreover, we identified a distinct third layer in the periosteum. The specific patterns we observed have important implications for the mechanisms of appositional growth and attachment of connective tissues to the skeletal elements. Finally, we describe two previously uncharacterized molecular domains within the developing cartilage itself and show that these domains are regulated by signals involving TGFβ produced by the perichondrium.
MATERIALS AND METHODS
Microarray construction
To construct a microarray of embryonic perichondrium and periosteum cDNAs, the respective tissues were harvested, by manual dissection, from E12 (stage 38) chicken tibiotarsi. At this stage the perichondrium and periosteum loosely surround the developing tibiotarsus and can be easily microdissected. The separation is clean enough that controls for cell contamination were deemed unnecessary. This supposition was largely validated by the in situ hybridization of clones isolated in the screen (see below). mRNA isolated from each tissue using the MicroFast Track Kit (Invitrogen) was used to create cDNA libraries for each tissue using the pBluescript II XR cDNA Library Construction Kit (Stratagene). The QBot (Genetix) automatic colony picking system was used to transfer colonies (33,729 perichondrium and 33,837 periosteum) into 384-well plates (Genetix) and also to replicate both libraries in triplicate for glycerol stocks. To amplify the inserts, colony PCR was performed using T3 and T7 primers and the PCR products were purified using 384-well MultiScreen PCR purification plates (Millipore) on the Biomek FX Liquid Handling System (Beckman Coulter). The purified PCR products were recovered from the filter plates by re-suspension in water, transferred into 2 sets of printing plates (MJ Research), and then stored at −80°C. Just prior to printing, one set of printing plates was allowed to air dry over night at room temperature. The PCR products were then resuspended in 3X SSC and stored at −80°C. The microarray was printed on UltraGAPs slides (Corning) using a Gene Machines OmniGrid arrayer (Genomic Solutions). Half of each library was printed onto each of 2 slides, along with an additional 850 clones of known identity and a microarray list of the printed clones was generated using the OmniGrid software.
Microarray hybridization and data gathering
To generate probes for microarray hybridization, 1μg of mRNA from the perichondrium, periosteum, bone tissue, and non-hypertrophic cartilage of stage 38 chicken tibiotarsi was reverse transcribed and amplified. Then the cDNA was labeled by incorporation of amino allyl-dUTP using oligo-dT and random hexamer-primed primer extension. The labeled cDNA was purified over a G50 column, and then reacted with either Cy3 or Cy5 NHS-ester dye. The Cy-dye labeled cDNA was then purified using a CyScribe GFX column. Microarrays were prehybridized with poly-adenylic acid and sheared salmon sperm DNA for at least 40 minutes before a 42-hour hybridization with paired Cy3 and Cy5-labeled probes in the presence of poly-adenylic acid and sheared salmon sperm DNA. Microarrays were rinsed at room temperature with 1xSSC, 0.2% SDS and washed twice in 1xSSC, 0.2% SDS for 5 minutes each. This was followed by one wash in 0.1xSSC, 0.2% SDS for 5 minutes, and 2 washes in 0.1x SSC for 1 minute each. Hybridized microarrays were scanned with the Packard ScanArray 4000 (Perkin Elmer) and images were imported into Imagene (BioDiscovery).
Microarray experimental design and Data analysis
Because each microarray experiment consisted of two slides (chips), the Imagene data from both slides were combined upon import in the GeneSpring software program (Agilent Technologies). The following criteria were used to normalize the data: a dye-swap was performed with the perichondrium and periosteum probes, the signal channel and control channel measurements for periosteum samples labeled with Cy5 and perichondrium samples labeled with Cy3 were reversed. Values below 0.01 were set to 0.01. A Lowess curve was fit to the log-intensity versus the log-ratio plot. 20.0% of the data was used to calculate the Lowess fit at each point. This curve was used to adjust the control value for each measurement. If the control channel was lower than 10 then 10 was used. To calculate average base/proportional values a quality control filter for genes using the Cross Gene Error Model was performed. This value was based on the control channel values, and indicated the point in the data set where error became constant. All genes with high error values were eliminated. Data for two perichondrium to periosteum dye swap experiments were combined. The values used were averages of the two experiments. All microarray data were filtered on expression using the normalized data values for 2-fold up- and down-regulated, and the gene lists were saved. The gene lists were joined using a Venn diagram to show the overlap of genes within groups. Genes up-regulated in the perichondrium were determined using the up-regulated genes in the combined perichondrium to periosteum experiments and the perichondrium to non-hypertrophic cartilage (NHC) experiment, and excluded up-regulated genes in the periosteum to bone experiment. Genes that were common in these two groups were then considered differentially expressed in the perichondrium. Genes up-regulated in the periosteum were determined using the up-regulated genes in the periosteum to bone experiment and the down-regulated genes in the combined perichondrium to periosteum experiments, while excluding the up-regulated genes in the perichondrium to NHC experiment. Genes that were common in these two groups were then considered differentially expressed for periosteum.
The array information is submitted to Array Express.
| PhysicalArrayDesign name: | LINSENMAYER G. gallus PCPO Chip B 23K |
| ArrayExpress accession: | A-MEXP-1149 |
| Specified release date: | 2008-06-01. |
| PhysicalArrayDesign name: | LINSENMAYER G. gallus PCPO Chip A |
| ArrayExpress accession: | A-MEXP-1153 |
| Specified release date: | 2008-06-01. |
DNA sequencing and in situ hybridization
For DNA sequencing, cDNA inserts in the pBluescript SK (+) vector from bacterial clones were amplified by PCR using T3 and T7 primers. PCR products were purified using the QIAquick PCR purification kit (Qiagen) and then sequenced by dye-terminator fluorescent sequencing (performed by the Biopolymers facility at Harvard Medical School). Sequences were compared to the NCBI database by BLASTN as well as to the BBSRC Chick EST database by BLAST and the UCSC Genome Bioinformatics database by Blat algorithms. To remove the primer sequences from the clones that had no known homologue, the sequences were edited with EditSeq (DNAStar), and then to determine the number of clones with non-overlapping, unique sequence, the edited sequences were aligned using MegAlign (DNAStar).
75 clones generated in this study have been submitted to the dbEST database of NCBI. The accession numbers range from FG356171 to FG356245. (Please see Supplementary data). All the clones available from Addgene (http://www.addgene.org/pgvec1).
In situ hybridizations were performed as described in Murtaugh et al. (1999) with slight modifications. Briefly, purified PCR products from up-regulated clones were transcribed with T7 RNA polymerase to obtain digoxigenin labeled anti-sense probes according to the manufacture’s recommendations (Roche). Paraffin-embedded tissue sections were deparaffinized in xylene and rehydrated through ethanol series. For detection, tissue sections were incubated with anti-digoxigenin alkaline phosphatase Fab fragments (Roche) overnight at 4°C and then treated with NBT/BCIP (Sigma) at room temperature or 4°C until a colorimetric change was detected.
Tibiotarsal Organ Culture
Tibiotarsal organ cultures were performed as previously described (Di Nino et al., 2001) with slight modifications. Briefly, E12 tibiotarsi were dissected as pairs from individual embryos. For these pairs one tibiotarsus was cultured with the perichondrium and periosteum intact and one was cultured with the tibiotarsus removed. Each tibiotarsus was placed on a piece of Millipore filter (Millipore HTTP4700) supported on a stainless steel mesh grid (Mesh Grid Co.) in an organ culture dish (Falcon). The cultures were maintained for 3 days (37°C; 7% CO2) in serum-free Dulbecco’s modified Eagle’s medium (DMEM) (Gibco), with or without the factor to be tested (see below), or serum-free “conditioned medium” obtained from perichondrium and/or periosteum cell cultures (Di Nino et al., 2001). The media were changed daily. Lyophilized human recombinant TGF-β1 (R&D Systems) was reconstituted in 4 mM hydrochloric acid containing 1 mg/ml bovine serum albumin (BSA; Sigma). This mixture was added to culture medium for a final concentration 300 pg/ml.
RESULTS
Perichondrium and periosteum are molecularly distinct tissues
To test the hypothesis that the perichondrium and periosteum are molecularly distinct tissues, and to identify specific molecular markers for each, we screened for genes specifically expressed in each of these tissues. We dissected the perichondrium and periosteum (Figure 1) from embryonic day 12 (E12) chick tibiotarsi and used these tissues to construct two cDNA libraries which were subsequently spotted on a glass slide. The resultant microarray was then hybridized with probes derived from mRNAs isolated from the same tissues and from adjacent skeletal tissues (See Materials and Methods, for details). 192 candidate cDNAs were identified as hybridizing exclusively to probes made from perichondrium and/or periosteum tissue, and not from probes derived from the subjacent tissues of the skeletal element on the microarray. Many of the 192 candidate cDNAs correspond to genes represented multiple times on the microarray. These genes seem to be highly enriched in the periskeletal tissue (Supplementary data). However there were 77 unique transcripts identified in this initial screen. These were investigated further by mRNA in situ hybridization on sectioned E12 chick tibiotarsi. While 36 clones did not yield any detectible hybridization signal, and 21 clones were expressed in other tissues, the remaining 20 genes displayed specific expression in the periskeletal tissues.
Figure 1. Perichondrium and periosteum in chick tibio-tarsus.
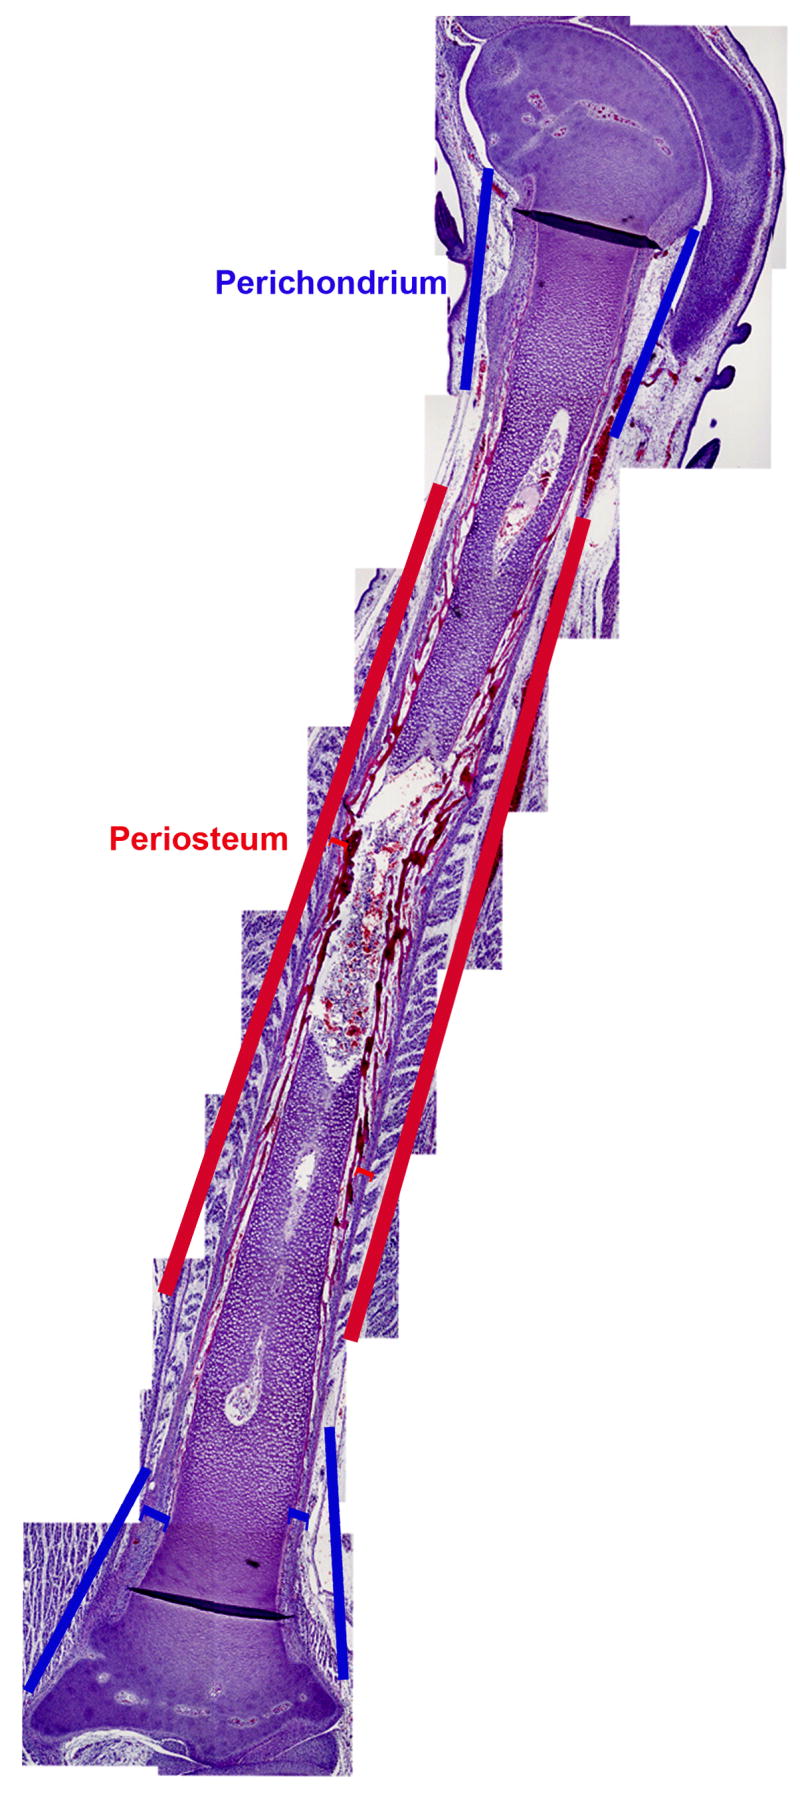
Perichondrium (Blue line) and periosteum (red line) are shown in a hematoxilin and eosin stained section of an embryonic day 12 chick tibio-tarsus.
The perichondrium and periosteum are continuous with each other and are primarily defined by the morphology of the subjacent skeletal tissues. Our expression data demonstrate that the periosteum is not merely an extension of the perichondrium, rather is a molecularly distinct tissue. For example, Thrombospondin 2 (Tsp2) has previously been shown to be expressed in the perichondrium (Tucker, 1993). Consistent with this, Tsp2 was identified in our screen as a molecule that is highly enriched in the perichondrium relative to the periosteum. In situ analysis indeed shows that Tsp2 is highly expressed in the perichondrium (Figure 2, panels A and B) but is significantly downregulated in the periosteum (Figure 2A). Two other perichondrium specific clones that we obtained corresponded to galectin-1 (Figure 2C) and the transcription factor MafB (Figure 3D). We could not detect any expression of galectin or MafB in the periosteum (data not shown).
Figure 2. Perichondrium and periosteum are molecularly distinct.
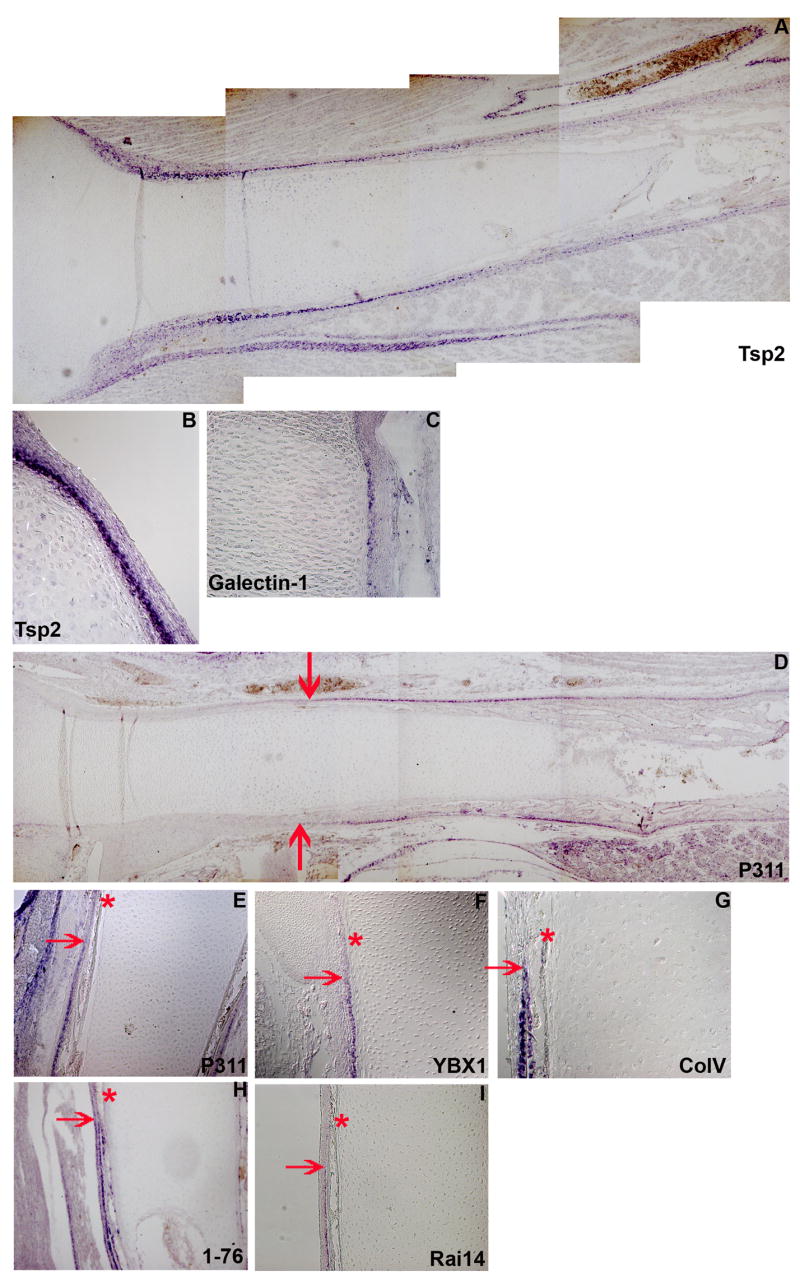
A. Expression pattern of Thrombospondin 2 mRNA in an embryonic day 12 chick tibio-tarsus. B and C show expression patterns of Thrombospondin 2 and lectin galactoside-binding soluble 1 (Lglas1) in the perichondrium. D. Expression pattern of Neuronal protein 3.1 (P311) mRNA in an embryonic day 12 chick tibio-tarsus. E through I shows expression patterns of P311 (E), Y-box binding protein 1 (YBX1) (F), Type V collagen (G), an unknown mRNA (H), Retinoic acid induced 14 (RAI14) (I) in the periosteum. The red arrows show the onset of expression of these periosteum specific mRNAs. The red asterisks show the beginning of the leading edge of bone collar.
Figure 3. There are distinct molecular layers within perichondrium and periosteum.
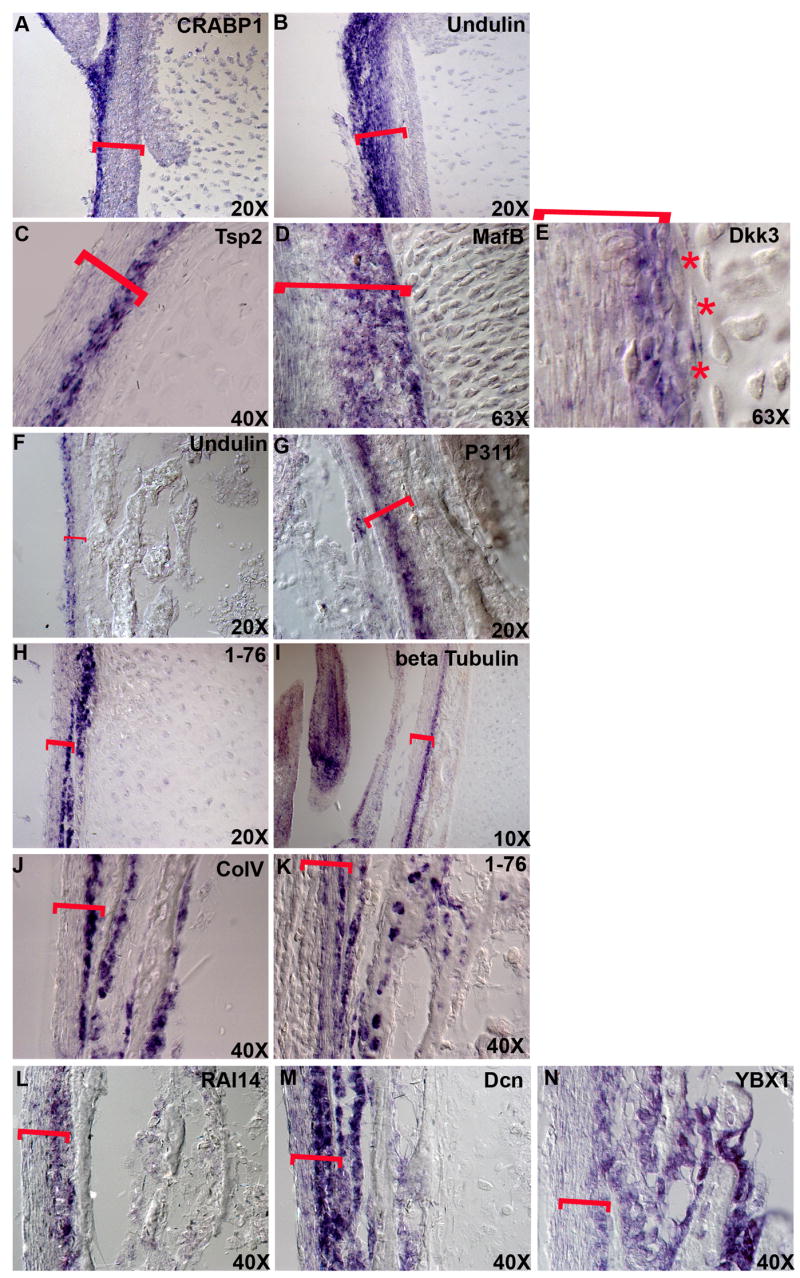
A-I, Expression patterns of CRABP1 (A), Undulin (B), Tsp2 (C), MafB (D), Dkk3 (E), Undulin (F), P311 (G), an unknown mRNA (H) and chicken beta tubulin (I). The magnifications are shown. K through L show expression patterns of ColV (K), an unknown mRNA (L), RAI14 (M), Decorin (N) and YBX1 (O) at high magnification to show the morphology of the cells these mRNAs are expressed in. Red brackets show the width of the periskeletal tissues.
We also identified many genes in our screen that are specifically expressed in the periosteum. Patterns of expression for some of these clones are shown in Figure 2. As can be seen in Figure 2, Neuronal protein 3.1 (P311) (Figure 2E), Y-box binding protein 1 (YBX-1) (Figure 2F), Type V collagen (Figure 2G), Retinoic acid induced 14 (RAI14) (Figure 2I) as well as a novel transcript we refer to as 1–76 (Figure 2H), are all expressed in similar domains (red arrow in Figure 2E–I). The expression of these genes start just distal to the beginning of the bone collar (asterisk in Figure 2E–I) which is consistent with the morphological definition of the periosteum as the periskeletal tissue overlying the bone and bone collar within the diaphysis of the growing skeletal element. Other genes that we have identified as specifically expressed in the periosteum include the alpha2 chain of type I collagen and Decorin (see below). As many different mRNAs are preferentially expressed in either the perichondrium or in the periosteum, it is clear that these tissues are molecularly distinct.
There are distinct molecular layers within the perichondrium and periosteum
Morphologically, both the perichondrium and periosteum are composed of two layers, the inner cambial layer and the outer fibroblastic layer. Consistent with this, it has previously been reported that type IIA procollagen is expressed specifically in the inner cambial layer (Duynstee et al., 2002; Nah et al., 2001). In our in situ mRNA expression analyses we observed that several of the transcripts identified in our screen are localized to this inner cambial layer of the perichondrium, including Tsp2 (Figure 3C), MafB (Figure 3D), Dkk3 (Figure 3E) and galectin-1 (Figure 2C). We also observed that cellular retinoic acid binding protein-I (CRABP-I) and Undulin (COL14A1) are expressed in the outer layer of the perichondrium (Figure 3A and B). These molecular differences in gene expression closely correlate with the very distinct morphologies of the two layers (Figure 3C–E).
Interestingly, while Dkk3 is primarily expressed in the inner layer of the perichondrium, a few Dkk3 expressing cells were also observed within the cartilage immediately adjacent to the perichondrium (Figure 3E). These Dkk3 expressing cells have a very distinct morphology from the neighboring proliferating chondrocytes. While the rest of the chondrocytes are oriented perpendicular to the long axis of the skeletal element, the Dkk3 expressing cells are parallel to this axis. Furthermore, the Dkk3 expressing cells in the cartilage have the same orientation as those in the perichondrium (Figure 3E, red asterisks).
As in the perichondrium, we observed distinct mRNA expression domains in several different layers of the periosteum. Based on morphological criteria, the periosteum is proposed to have two layers similar to the perichondrium, however, we observe three molecularly distinct layers in this tissue. Undulin, which is expressed in the outer layer of the perichondrium continues to be expressed in the outer layer of the periosteum as well (Figure 3F). Neuronal protein 3.1 (P311) is expressed neither in the inner layer nor in the outer layer, but rather, it is expressed in a middle, third layer of the periosteum (Figure 3G). Clone 1–76 (Figure 3H), β-tubulin (Figure 3I), Type V collagen (Figure 3J), RAI14 (Figure 3L), Decorin (Figure 3M) and YBX-1 (Figure 3N) are all expressed in the inner layer of the periosteum.
In keeping with the accepted notion that periosteum is osteogenic and serves to support appositional growth of the developing bone (Lim et al., 2005; Nakahara et al., 1990; Youn et al., 2005) we observed that most of the genes that are expressed in the inner layer of the periosteum are also expressed in the osteoblasts (Figure 3J–N) as well as in the osteocytes (Figure 3K and N). In contrast the genes that are expressed in the middle and/or outer layers such as undulin and P311 are not expressed in these cell types. Thus we find there are at least two distinct molecular layers within the perichondrium and three distinct molecular layers within the periosteum.
Onset of osteogenesis in chick tibio-tarsus
We observed that many of the periosteum specific transcripts that localized within the inner layer of the periosteum were also expressed in osteoblasts. This provided the opportunity to use these markers to gain insight into the stage at which osteoblasts first appear within these tissues. For this purpose, we analyzed the time course of expression of Decorin, Type I Collagen alpha 2 chain (ColIA2) and 1–76. The expression patterns of these clones were investigated from HH stage 34 through 38 (approximately E8 through E12). It was observed that none of these clones are expressed in the developing chick tibiotarsus at HH stage 34 (data not shown). At HH stage 35 the expression of Decorin (Figure 4A) and ColIA2 (Figure 4E) were observed in very few cells, whereas no cells expressing transcript 1–76 were observed at this stage (Figure 4I). At HH stage 36, the expression of Decorin, ColIA2 and 1–76 was sharply upregulated in the developing chick tibiotarsus. While few fibroblastic cells in the outer layer of the periosteum were observed to express these genes, the expression of these genes was very prominent in cells that had acquired a distinct rounded morphology (Figures 4B, 4F and 4J, blue arrows in Figure 4B). The appearance of these cells is concomitant with the appearance of a distinct bone collar (Red arrow in 4B). At this stage abundant erythrocytes are also observed in this region of the developing chick tibiotarsus (Red asterisk in Figure 4B). During HH stages 37 and 38 the expression of these genes continues in the osteoblasts as well as in the periosteum (Figures 4C, D, G, H, K, L). It should be noted that ColIA2 is expressed at very low levels in the periosteum but is highly expressed in the osteoblasts (Figures 4F–H). However, the expression of this gene was never detected in the osteocytes (red arrows in Figures 4F). On the other hand, Decorin expression has been occasionally observed in the osteocytes (data not shown) and, as is demonstrated in Figures 4J and K (red arrows), 1–76 is very prominently expressed in these cells suggesting ColIA2 may be a very specific osteoblast marker. Taken together these expression data indicate that osteogenesis in chick tibiotarsus begins at approximately HH stage 35.
Figure 4. Time course of expression of periosteum markers.

Expression of Decorin (A–D), Type I collagen chain alpha 2 (E–H) and an unknown mRNA (I–L) in developing chick tibiotarsus at stages 35 (A, E and I), 36 (B, F and J), 37 (C, G and K) and 38 (D, H and L). Blue arrows in B and C show early osteoblasts. Thin red arrow in B shows bone collar and the red asterisk in B shows erythrocytes within the skeletal element. The short red arrows in F, J and K show osteocytes embedded in the mineralized matrix.
Genes specifically expressed in the connective tissue attachment sites
While the inner layer of the periskeletal tissues is proposed to support appositional growth (Duynstee et al., 2002; Lim et al., 2005; Nah et al., 2001; Nakahara et al., 1990; Youn et al., 2005) the outer fibroblastic layer is hypothesized to perform a structural role, in particular to provide sites for attachment of tendons and ligaments (Scott-Savage and Hall, 1980). However, the molecular details of the process by which these connective tissues attach to the skeleton are currently unknown. We found that CRABP-I is expressed in the outer layer of the perichondrium (Figure 3A). CRABP-I is also expressed at a low level in the outer layer of the periosteum (data not shown). More importantly, this gene is expressed in the connective tissues (Figure 5A, green arrow) and is also highly expressed at the attachment site of connective tissues to the skeletal element (Figure 5A, blue arrow). In addition another gene isolated in our screen, ABI3BP, while not expressed in the majority of the perichondrium (Figure 5C, purple arrow), is strongly expressed in areas of perichondrium that participate in connective tissue attachment (Figure 5B and D, red arrows). ABI3BP is also expressed in the connective tissue itself (Figure 5C, green arrow), however, the expression is greatly upregulated in both the perichondrium and the connective tissue at the site of attachment (Figure 5 B–D, blue arrows).
Figure 5. Genes expressed in the perichondrium may be involved in attachment of connective tissues to bone.

A, Expression of CRABP1 mRNA and B–D expression of ABI3BP mRNA. Green arrows in A and C show connective tissue, while blue arrows in A–D show attachment sites of connective tissues to embryonic day 12 chick tibio-tarsus. Red arrow in B shows expression of ABI3BP mRNA in the perichondrium while purple arrow in C shows lack of ABI3BP mRNA expression in the perichondrium.
Novel molecular domains within the cartilage
In the microarray screen one clone was obtained that unexpectedly is expressed not in the peri-skeletal tissues but rather, in the cartilage itself. Matrilin4 is a recently identified (Wagener et al., 1998) extracellular matrix (ECM) protein. Matrilins are known to be expressed in the cartilage, however, no study of the expression of Matrilin 4 in developing chick cartilage has been done. We therefore investigated the expression pattern of Matrilin 4 in developing chick tibiotarsus between HH stages 34 and 38. At HH stage 34 Matrilin4 is expressed throughout the developing chick tibiotarsus with the exception of the proliferating zone of chondrocytes. Indeed Matrilin 4 was never observed in the flattened proliferating chondrocytes at any stage examined (Figure 6 B–E). Furthermore, the expression is significantly downregulated in the center of the element (Figure 6A). At subsequent developmental stages the Matrilin 4 expression resolves into two separate domains near each end of the chick tibiotarsus. The cells in the middle of the element lacking Matrilin 4 expression have a very distinct hypertrophic morphology (Figure 6F and G). At HH stage 38 the Matrilin 4 expression domain is restricted to a small domain of the developing cartilage. At all stages there is a gradient of Matrilin 4 expression, highest near the periphery and lowest near the center of the developing chick tibio-tarsus. It is likely that this high level of expression in the peripheral chondrocytes abutting the perichondrium is responsible for its isolation in our screen. The cells that turn off Matrilin 4 expression towards the center of the element have a hypertrophic morphology thus we examined whether the Matrilin 4 mRNA expression domain overlaps with the hypertrophic domain. For this purpose the sections hybridized for Matrilin 4 mRNA expression were also labeled for Type X collagen (ColX) protein (a marker for hypertrophic chondrocytes) using a ColX specific monoclonal antibody (AC-9). It was observed that the Matrilin 4 mRNA expression domain and the ColX protein expression domain are mutually exclusive (Figure 6 H, I). To our knowledge such a molecular domain within the developing cartilage has not previously been reported in any species.
Figure 6. Two distinct domains within the chick tibio-tarsus cartilage marked by expressions of Matrilin4 and Matrix-Gla.

Expression of Matrilin 4 mRNA in developing chick tibio-tarsus (A–I). A–E, Low magnification images of Matrilin 4 mRNA expression patterns within stages 34 (A and B), 35 (C), 37 (D) and 38 (E) tibio-tarsus. High magnification images of Matrilin 4 mRNA expression in stage 34 (F) and stage 37 (G) tibio-tarsus. H and I, Type X Collagen protein and Matrilin 4 mRNA expression in stage 37 chick tibio-tarsus. Low magnification (H) and high magnification (I) images. J–R, expression of Matrix-Gla mRNA in developing chick tibio-tarsus. Expression domain of Matrix-Gla mRNA in stage 34 and 35 tibiotarsus. Two distinct expression domains of Matrix-Gla mRNA in stage 36 chick tibio-tarsus (L). The domain of expression adjacent to the proliferating chondrocytes is shown by a blue bracket while that in the hypertrophic chondrocytes is shown by a red bracket. M–R, Matrix-Gla mRNA expression in stage 36 (M, N), stage 37 (O, P) and stage 38 (Q, R) tibio-tarsus. M, O and Q show expression domain next to the proliferating chondrocytes while N, P and R show expression domain within the hypertrophic chondrocytes.
The unique expression pattern of Matrilin4 within the cartilage drew our attention to another gene that has also been described as having a distinct expression domain during chondrogenesis. The expression of Matrix Gla (M-Gla), another ECM protein, was first reported in mouse (Luo et al., 1997) and subsequently, in the chick (Yagami et al., 1999). In the mouse M-Gla is expressed in all chondrocytes, particularly in the hypertrophic chondrocytes (Luo et al., 1997). However, in chick the expression is more restricted. Importantly, M-Gla is expressed along the lateral edges of the developing chick tibiotarsus within the domain of the proliferating chondrocytes (Yagami et al., 1999). This interesting expression pattern, however, (Yagami et al., 1999) was not examined at a high resolution. While the expression of M-Gla and Matrilin 4 differ in their presence or absence in proliferating chondrocytes, they are similar in their peripheral expression. We therefore looked more closely at M-Gla expression during cartilage development in the chick. M-Gla expression is detectable as early as HH stage 34. During HH stage 34 and 35 M-Gla expression is localized in a continuous domain within the diaphysis. The cells expressing M-Gla have a distinct rounded morphology as compared to the flattened appearance of the neighboring proliferating cells (Figure 6J, K). At HH stage 36 two distinct domains of M-Gla expression appear (Figure 6L). One domain of expression is next to the proliferating cells (Figure 6L, Blue line) where the cells expressing M-Gla maintain their round and distinct morphology. This expression is consistent through HH stage 38 (Figure 6M, O and Q). The second domain is localized within the hypertrophic cells (Figure 6L, red line) and is more diffuse throughout the hypertrophic cells (Figure 6N, P and R). However, even within this domain a group of cells that are elongated in morphology and are parallel to the long axis of chick tibio-tarsus express M-Gla at a very high level.
Regulation of gene expression in the cartilage by cells of the PC
The fact that both Matrilin 4 and Matrix Gla mRNA expression is highest near the lateral edges of the developing chick tibiotarsus in a domain juxtaposed to the overlying PC led us to speculate that these expressions may be regulated by the periskeletal tissue. To test this hypothesis we turned to tibiotarsus organ culture (Long and Linsenmayer, 1998). Tibiotarsi from HH stage 38 chick embryos were harvested and were cultured for 3 days with or without the periskeletal tissue. The expression of both Matrilin 4 mRNA (compare Figure 7 A with Figure 7 B) and Matrix Gla mRNA (compare Figure 7 F with Figure 7 G) is extinguished in the absence of the periskeletal tissues. This observation suggests that the cells of the periskeletal tissues regulate the expression of Matrilin 4 and M-Gla. To test whether this is dependent on secretion of a diffusible factor, the expression of Matrilin 4 and M-Gla were monitored in perichondrium-denuded tibiotarsi cultured in the presence of conditioned media derived from perichondrium or periosteum cell cultures. Conditioned media failed to rescue the expression of M-Gla in the lateral edge chondrocytes (not shown). However, as is shown in Figure 7C, perichondrium-conditioned media rescued the expression of Matrilin 4 mRNA in the lateral edge chondrocytes. In contrast the periosteum-conditioned media did not rescue Matrilin 4 expression (Figure 7D), indicating that the diffusible factor(s) that positively regulate the expression of Matrilin 4 are specifically expressed in the perichondrium. One important factor expressed in the perichondrium is TGF-β (Crochiere et al., 2008). TGF-β is known to inhibit hypertrophic differentiation (Ballock et al., 1993; Serra et al., 1997; Yang et al., 2001). This made TGF-β a plausible candidate for the Matrilin-4 regulating factor as Matrilin-4 is downregulated in hypertrophic cells. We therefore cultured the tibiotarsi, following removal of the periskeletal tissues, in presence of human TGF-β1. Human TGF-β1 rescued the expression of Matrilin 4 mRNA to the level seen in the intact tibiotarsi (compare Figure 7 A with Figure 7 E), suggesting that TGF-β from the perichondrium positively regulates the expression of Matrilin 4 in the cartilage.
Figure 7. Matrilin 4 and Matrix-Gla mRNA expressions are controlled by the perichondrium. Matrilin 4 mRNA expression is positively regulated by TGF-β.

A–E, images of Matrilin 4 mRNA expression in embryonic day 12 chick tibio-tarsi following 3 days in organ culture. Intact (A) tibio-tarsus cultured in DMEM, PC/PO removed (B) tibio-tarsus cultured in DMEM, following PC/PO removal tibio-tarsus cultured in PC-conditioned DMEM media (C), PO conditioned DMEM media (D) and TGF-β added DMEM media (E). F and G images of Matrix-Gla mRNA expression in embryonic day 12 chick tibio-tarsi following 3 days in organ culture. Intact (F) tibio-tarsus and PC/PO removed (G) tibio-tarsus cultured in DMEM.
DISCUSSION
The last decade has seen enormous progress in our understanding of cartilage and bone development. However, the perichondrium and periosteum have received far less attention than the skeletal tissues themselves, leaving a major gap in our knowledge of the complex set of interactions mediating skeletogenesis. To start to fill in this gap, we have carried out a screen to identify markers for cell types within the perichondrium and periosteum. Our data not only define molecular differences between these tissues but also identify more distinct layers within the perichondrium and periosteum than had previously been recognized. Our data also lead to the recognition of a new molecular domain within the developing cartilage itself (Figure 8). In a final set of experiments we used the markers expressed uniquely in the new chondrocyte domain to begin to unravel the regulatory relationship between the periskeletal and skeletal tissues, highlighting the value of the new panel of molecular markers we have generated.
Figure 8.
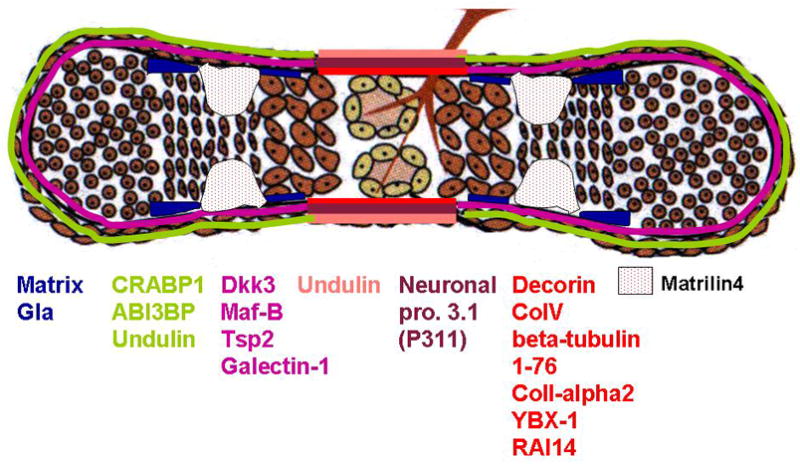
Distinct molecular domains within developing chick tibio-tarsus.
Molecularly distinct layers within the perichondrium and the periosteum
The perichondrium and periosteum have previously been stratified on the basis of cell morphology. The superficial fibroblastic layer of the periskeletal tissues has been proposed to play a structural role (Duynstee et al., 2002; Nah et al., 2001) and to support tendon and ligament attachment (Scott-Savage and Hall, 1980). Our observation that CRABP-I and, in particular, ABI3BP are expressed in this layer of the perichondrium as well as in the tendons and ligaments with a strong upregulation at the attachment site, indicate a structural relationship between these tissues. The expression of thrombospondin 2 (Tsp2) in the inner, chondrogenic layer of the PC is interesting as the nonhypertrophic cartilage is avascular. Tsp2 is known to be able to act as a potent inhibitor of angiogenesis (Streit et al., 1999), suggesting it may play a direct role in blocking vascularization of this tissue.
The inner layer of the perichondrium and the periosteum have been proposed to be involved in the appositional growth of the cartilage (Bairati et al., 1996) and the bone (Pathi et al., 1999), respectively. We have observed that Dkk3 is expressed in the inner layer of the perichondrium as well as in a few cells within the cartilage. These Dkk3 expressing cells have the same orientation as the cells of the perichondrium and are morphologically distinct from the majority of the proliferating chondrocytes. It is highly tempting to speculate that the Dkk3 expressing cells from the perichondrium delaminate and migrate into the cartilage to support appositional growth of the cartilage. Along the same line, we have identified many genes that are expressed specifically in the inner layer of the periosteum, e.g. 1–76, ColV, Dcn, RAI14, YBX-1 etc., which are also expressed in the early osteoblasts and osteocytes. However, we did not find any marker specific to other layers of the periosteum expressed in these differentiated cell types of the skeleton. Taken together, these observations provide support to the notions that the inner layer of the periosteum may be involved in the appositional growth of the bone (Pathi et al., 1999) and that the periosteum may be the tissue origin of bone (Colnot et al., 2004; Pathi et al., 1999). Finally, based on morphological criteria the periosteum is proposed to have two layers, however, we find that P311 is expressed in a distinct middle layer of the periosteum, which is not differentiable from the inner layer morphologically. While the function of the middle layer remains unknown at this time, this observation underscores the importance of such molecular analysis.
Unique molecular domains within the developing cartilage
While our study was directed towards discovering genes that are specifically expressed in the periskeletal tissues, we additionally identified one gene, Matrilin4, expressed in a unique domain within the cartilage. This domain is distinct from the Ihh expression domain (Vortkamp et al., 1996) and mutually exclusive with the ColX expression domain. Moreover, Matrilin4 is expressed in a graded manner with the highest level of expression subjacent to the perichondrium. We find that this expression domain is dependent upon the perichondrium and our data suggest that TGF-β from the perichondrium may be responsible for the maintenance of this domain. Since Matrilin4 is expressed in a domain mutually exclusive but bordering the Col X expression domain, and is positively regulated by TGF-β, a known inhibitor of hypertrophic differentiation (Ballock et al., 1993; Yang et al., 2001) produced by the perichondrium, it is tempting to speculate that a role of TGF-β activity produced by the perichondrium is to maintain a domain of chondrocytes that do not undergo hypertrophy.
Our analyses also showed that the perichondrium regulates the expression of a second marker, M-Gla. M-Gla was originally described in mice as a gene expressed in all chondrocytes (Luo et al., 1997). However, it was demonstrated to have a much more restricted domain of expression in chick skeletal tissue (Yagami et al., 1999), including two distinct domains: one in the hypertrophic domain and the other “along the lateral side of the proliferating and prehypertrophic zones” (Yagami et al., 1999). It is this later expression domain that drew our attention, since this domain of expression is also subjacent to the periskeletal tissue. Our data clearly show that M-Gla expression in the cartilage is regulated by the periskeletal tissue, however, we failed to rescue this expression with either periskeletal-tissue-conditioned media or with any purified signaling molecule. Both by loss of function (Luo et al., 1997) and by gain of function (Yagami et al., 1999) studies it was demonstrated that M-Gla has potent anti-mineralization activity. The lateral domain of expression along the edge of the developing skeleton may suggest that M-Gla prevents ectopic mineralization of this domain or as suggested by Yagami et. al. that M-Gla may function in roles other than prevention of mineralization, i.e. to promote chondrocyte maturation (Yagami et al., 1999).
Roles of other genes uniquely expressed in the perichondrium and periosteum
Apart from the examples discussed above, our current study uncovered a plethora of molecules that are specifically expressed in the periskeletal tissue. Many of these molecules may themselves play important roles in skeletogenesis, in addition to their utility as novel markers.
For example, CRABP-I, a molecule that is thought to function in RA trafficking (Levadoux-Martin et al., 2006), is preferentially expressed in the perichondrium. This putative role for CRABP-I is consistent with our observation that the perichondrium but not the periosteum responds to treatment with RA to produce a factor(s) that negatively regulates cartilage growth (Di Nino et al., 2002).
Chicken MafB is also expressed in the perichondrium but not in the periosteum. Chicken MafB is the homolog of rat maf-1 and both encode a bZip transcription factor. It is possible that this gene is also involved in RA signaling in this tissue as there is evidence that MafB is regulated downstream of retinoid signaling in the patterning and development of rhombomeres in the hindbrain.
We also identified several molecules which are localized in the periosteum. The expression in this tissue of neuronal protein 3.1, a molecule that has been implicated in TGF-β signal transduction, correlates with the inability of the periosteum to activate latent TGF-β to the active form (Crochiere et al., 2008). The perichondrium, by comparison, is able to activate latent TGF-β. Previous studies on NIH 3T3 cells have suggested that this protein inhibits auto-induction of TGF-β1 and -β2 by binding to the TGF-β latent associated peptide (Paliwal et al., 2004). More recently, we have shown that despite the presence of high amounts of total TGF-β in the conditioned medium from cultures of periosteum cells, TGF-β was not activated in response to treating the cultures with exogenous active TGF-β, as was observed in cultures of perichondrium cells (Crochiere et al., 2008). It is interesting to note that P311 protein contains several PEST domains, which are implicated in protein turnover. It is possible that the presence of this protein in the periosteum helps this tissue to rapidly respond to extracellular cues.
Finally, another periosteum marker, YBX-1 is a translational repressor protein that competes with the eIF4E translation initiation complex for binding to the 5′mRNA cap (Evdokimova et al., 2006). More study needs to be done to determine if YBX-1 mediated translational repression is important for the normal functional development of the periosteum and the bone.
Each of these molecules provides a starting point for further functional studies. Moreover, the set of markers we have defined will enable future work directed toward unraveling the molecular interactions that guide skeletogenesis.
Supplementary Material
Acknowledgments
This work was supported by a grant from the NIH, PO1 DK56246 to CJT and NIH Grant HD-23681 to TFL. We acknowledge Christian Daly and Tyler Aldridge of the Bauer Center for Genomics Research of Harvard University for their help with the production of the microarray. We acknowledge Dr. Ernestina Schipani and Kim Atkin of Histology Core at the Endocrine Unit of Massachusetts General Hospital for excellent technical assistance. We also thank Mr. ShivRaj Gautam, Research Associate of AB at IIT-Kanpur, for his technical help.
References
- Alvarez J, Sohn P, Zeng X, Doetschman T, Robbins DJ, Serra R. TGFbeta2 mediates the effects of hedgehog on hypertrophic differentiation and PTHrP expression. Development. 2002;129:1913–24. doi: 10.1242/dev.129.8.1913. [DOI] [PubMed] [Google Scholar]
- Bairati A, Comazzi M, Gioria M. An ultrastructural study of the perichondrium in cartilages of the chick embryo. Anat Embryol (Berl) 1996;194:155–67. doi: 10.1007/BF00195009. [DOI] [PubMed] [Google Scholar]
- Ballock RT, Heydemann A, Wakefield LM, Flanders KC, Roberts AB, Sporn MB. TGF-beta 1 prevents hypertrophy of epiphyseal chondrocytes: regulation of gene expression for cartilage matrix proteins and metalloproteases. Dev Biol. 1993;158:414–29. doi: 10.1006/dbio.1993.1200. [DOI] [PubMed] [Google Scholar]
- Colnot C, Lu C, Hu D, Helms JA. Distinguishing the contributions of the perichondrium, cartilage, and vascular endothelium to skeletal development. Dev Biol. 2004;269:55–69. doi: 10.1016/j.ydbio.2004.01.011. [DOI] [PubMed] [Google Scholar]
- Crochiere ML, Kubilus JK, Linsenmayer TF. Perichondrial-mediated TGF-beta regulation of cartilage growth in avian long bone development. Int J Dev Biol. 2008;52:63–70. doi: 10.1387/ijdb.072322mc. [DOI] [PubMed] [Google Scholar]
- Dentice M, Bandyopadhyay A, Gereben B, Callebaut I, Christoffolete MA, Kim BW, Nissim S, Mornon JP, Zavacki AM, Zeold A, Capelo LP, Curcio-Morelli C, Ribeiro R, Harney JW, Tabin CJ, Bianco AC. The Hedgehog-inducible ubiquitin ligase subunit WSB-1 modulates thyroid hormone activation and PTHrP secretion in the developing growth plate. Nat Cell Biol. 2005;7:698–705. doi: 10.1038/ncb1272. [DOI] [PMC free article] [PubMed] [Google Scholar]
- Di Nino DL, Crochiere ML, Linsenmayer TF. Multiple mechanisms of perichondrial regulation of cartilage growth. Dev Dyn. 2002;225:250–9. doi: 10.1002/dvdy.10160. [DOI] [PubMed] [Google Scholar]
- Di Nino DL, Linsenmayer TF. Positive regulation of endochondral cartilage growth by perichondrial and periosteal calcitonin. Endocrinology. 2003;144:1979–83. doi: 10.1210/en.2002-220905. [DOI] [PubMed] [Google Scholar]
- Di Nino DL, Long F, Linsenmayer TF. Regulation of endochondral cartilage growth in the developing avian limb: cooperative involvement of perichondrium and periosteum. Dev Biol. 2001;240:433–42. doi: 10.1006/dbio.2001.0471. [DOI] [PubMed] [Google Scholar]
- Duynstee ML, Verwoerd-Verhoef HL, Verwoerd CD, Van Osch GJ. The dual role of perichondrium in cartilage wound healing. Plast Reconstr Surg. 2002;110:1073–9. doi: 10.1097/01.PRS.0000020991.10201.6C. [DOI] [PubMed] [Google Scholar]
- Hinoi E, Bialek P, Chen YT, Rached MT, Groner Y, Behringer RR, Ornitz DM, Karsenty G. Runx2 inhibits chondrocyte proliferation and hypertrophy through its expression in the perichondrium. Genes Dev. 2006;20:2937–42. doi: 10.1101/gad.1482906. [DOI] [PMC free article] [PubMed] [Google Scholar]
- Karsenty G. The complexities of skeletal biology. Nature. 2003;423:316–8. doi: 10.1038/nature01654. [DOI] [PubMed] [Google Scholar]
- Koziel L, Kunath M, Kelly OG, Vortkamp A. Ext1-dependent heparan sulfate regulates the range of Ihh signaling during endochondral ossification. Dev Cell. 2004;6:801–13. doi: 10.1016/j.devcel.2004.05.009. [DOI] [PubMed] [Google Scholar]
- Kronenberg HM. Developmental regulation of the growth plate. Nature. 2003;423:332–6. doi: 10.1038/nature01657. [DOI] [PubMed] [Google Scholar]
- Lanske B, Karaplis AC, Lee K, Luz A, Vortkamp A, Pirro A, Karperien M, Defize LH, Ho C, Mulligan RC, Abou-Samra AB, Juppner H, Segre GV, Kronenberg HM. PTH/PTHrP receptor in early development and Indian hedgehog-regulated bone growth. Science. 1996;273:663–6. doi: 10.1126/science.273.5275.663. [DOI] [PubMed] [Google Scholar]
- Lim SM, Choi YS, Shin HC, Lee CW, Kim DI. Isolation of human periosteum-derived progenitor cells using immunophenotypes for chondrogenesis. Biotechnol Lett. 2005;27:607–11. doi: 10.1007/s10529-005-3625-5. [DOI] [PubMed] [Google Scholar]
- Liu Z, Xu J, Colvin JS, Ornitz DM. Coordination of chondrogenesis and osteogenesis by fibroblast growth factor 18. Genes Dev. 2002;16:859–69. doi: 10.1101/gad.965602. [DOI] [PMC free article] [PubMed] [Google Scholar]
- Long F, Linsenmayer TF. Regulation of growth region cartilage proliferation and differentiation by perichondrium. Development. 1998;125:1067–73. doi: 10.1242/dev.125.6.1067. [DOI] [PubMed] [Google Scholar]
- Luo G, Ducy P, McKee MD, Pinero GJ, Loyer E, Behringer RR, Karsenty G. Spontaneous calcification of arteries and cartilage in mice lacking matrix GLA protein. Nature. 1997;386:78–81. doi: 10.1038/386078a0. [DOI] [PubMed] [Google Scholar]
- Mukherjee A, Dong SS, Clemens T, Alvarez J, Serra R. Co-ordination of TGF-beta and FGF signaling pathways in bone organ cultures. Mech Dev. 2005;122:557–71. doi: 10.1016/j.mod.2004.11.006. [DOI] [PubMed] [Google Scholar]
- Nah HD, Swoboda B, Birk DE, Kirsch T. Type IIA procollagen: expression in developing chicken limb cartilage and human osteoarthritic articular cartilage. Dev Dyn. 2001;220:307–22. doi: 10.1002/dvdy.1109. [DOI] [PubMed] [Google Scholar]
- Nakahara H, Bruder SP, Goldberg VM, Caplan AI. In vivo osteochondrogenic potential of cultured cells derived from the periosteum. Clin Orthop Relat Res. 1990:223–32. [PubMed] [Google Scholar]
- Ohbayashi N, Shibayama M, Kurotaki Y, Imanishi M, Fujimori T, Itoh N, Takada S. FGF18 is required for normal cell proliferation and differentiation during osteogenesis and chondrogenesis. Genes Dev. 2002;16:870–9. doi: 10.1101/gad.965702. [DOI] [PMC free article] [PubMed] [Google Scholar]
- Pathi S, Rutenberg JB, Johnson RL, Vortkamp A. Interaction of Ihh and BMP/Noggin signaling during cartilage differentiation. Dev Biol. 1999;209:239–53. doi: 10.1006/dbio.1998.9181. [DOI] [PubMed] [Google Scholar]
- Scott-Savage P, Hall BK. Differentiative ability of the tibial periosteum for the embryonic chick. Acta Anat (Basel) 1980;106:129–40. doi: 10.1159/000145174. [DOI] [PubMed] [Google Scholar]
- Serra R, Johnson M, Filvaroff EH, LaBorde J, Sheehan DM, Derynck R, Moses HL. Expression of a truncated, kinase-defective TGF-beta type II receptor in mouse skeletal tissue promotes terminal chondrocyte differentiation and osteoarthritis. J Cell Biol. 1997;139:541–52. doi: 10.1083/jcb.139.2.541. [DOI] [PMC free article] [PubMed] [Google Scholar]
- Tucker RP. The in situ localization of tenascin splice variants and thrombospondin 2 mRNA in the avian embryo. Development. 1993;117:347–58. doi: 10.1242/dev.117.1.347. [DOI] [PubMed] [Google Scholar]
- Vortkamp A, Lee K, Lanske B, Segre GV, Kronenberg HM, Tabin CJ. Regulation of rate of cartilage differentiation by Indian hedgehog and PTH-related protein. Science. 1996;273:613–22. doi: 10.1126/science.273.5275.613. [DOI] [PubMed] [Google Scholar]
- Wagener R, Kobbe B, Paulsson M. Matrilin-4, a new member of the matrilin family of extracellular matrix proteins. FEBS Lett. 1998;436:123–7. doi: 10.1016/s0014-5793(98)01111-9. [DOI] [PubMed] [Google Scholar]
- Yagami K, Suh JY, Enomoto-Iwamoto M, Koyama E, Abrams WR, Shapiro IM, Pacifici M, Iwamoto M. Matrix GLA protein is a developmental regulator of chondrocyte mineralization and, when constitutively expressed, blocks endochondral and intramembranous ossification in the limb. J Cell Biol. 1999;147:1097–108. doi: 10.1083/jcb.147.5.1097. [DOI] [PMC free article] [PubMed] [Google Scholar]
- Yang X, Chen L, Xu X, Li C, Huang C, Deng CX. TGF-beta/Smad3 signals repress chondrocyte hypertrophic differentiation and are required for maintaining articular cartilage. J Cell Biol. 2001;153:35–46. doi: 10.1083/jcb.153.1.35. [DOI] [PMC free article] [PubMed] [Google Scholar]
- Youn I, Suh JK, Nauman EA, Jones DG. Differential phenotypic characteristics of heterogeneous cell population in the rabbit periosteum. Acta Orthop. 2005;76:442–50. [PubMed] [Google Scholar]
Associated Data
This section collects any data citations, data availability statements, or supplementary materials included in this article.