

Summary
The present study was performed to test the hypothesis that the reactive oxygen species (ROS)–angiotensinogen (AGT)–renin angiotensin system (RAS) axis is sequentially activated in the development of diabetic nephropathy in Zucker diabetic fatty (ZDF) obese rats.
Genetic pairs of male ZDF obese and control ZDF lean rats (n = 12 of each species) were killed every 3 weeks from 12 to 21 weeks of age (n = 6 at each time point).
The ZDF obese rats developed diabetes mellitus at 12 weeks. At that time, urinary excretion rates of 8-isoprostane were similar between the groups; however, urinary 8-isoprostane levels were significantly increased at 15 weeks in ZDF obese rats compared with controls (36 ± 6 vs 15 ± 2 ng/day, respectively). At 15 weeks, protein levels of cortical angiotensinogen were similar between groups; however, cortical angiotensinogen levels were significantly increased at 18 weeks in ZDF obese rats compared with controls (relative ratio of 2.32 ± 0.21 vs 1.00 ± 0.20, respectively). At 12 weeks, angiotensin (Ang) II-like immunoreactivity was similar between groups in both the glomeruli and tubules; however, AngII-like immunoreactivity was increased significantly at 21 weeks in ZDF obese rats compared with controls (relative ratios of 1.98 ± 0.55 vs 1.00 ± 0.03, respectively, for glomeruli and 1.58 ± 0.16 vs 1.00 ± 0.13, respectively, for tubules). Moreover, at 21 weeks, the desmin-positive area in the glomeruli (0.63 ± 0.08 vs 0.22 ± 0.05%) and Masson's trichrome stain-positive area in the interstitium (4.97 ± 0.05 vs 3.18 ± 0.41%) were significantly increased in ZDF obese rats compared with controls, even though these differences had not been observed earlier.
These data suggest that the sequential activation of the ROS–AGT–RAS axis plays an important role in the development of diabetic nephropathy in ZDF obese rats.
Keywords: angiotensinogen, diabetic nephropathy, reactive oxygen species, renin–angiotensin system, Type 2 diabetes
Introduction
In developed countries, diabetic nephropathy is the most common aetiology of end-stage renal failure in patients starting dialysis.1 Clinical trials have demonstrated that high glucose levels are the principal cause of renal injury in both Type 12 and Type 2 diabetes.3 The mechanisms underlying the development of diabetic nephropathy are extremely complex; however, activation of the intrarenal renin–angiotensin system (RAS) has been suggested.4–10
Angiotensinogen is the only known substrate for the enzyme renin, which cleaves angiotensinogen to release the biologically inactive decapeptide angiotensin (Ang) I.11 Angiotensin-converting enzyme cleaves a dipeptide from AngI to produce the biologically active peptide AngII.11 Angiotensin II stimulates aldosterone secretion, cell proliferation and migration,12 thrombosis13 and superoxide production.14–16 All these factors are involved in the development and progression of nephropathy. Previous reports suggest that AngII stimulates angiotensinogen synthesis and that enhancement of angiotensinogen may be a key component in the maintenance of elevated circulating and intrarenal levels of AngII.17–21
High glucose generates reactive oxygen species (ROS) as a result of glucose auto-oxidation, metabolism and formation of advanced glycation end-products.22 Angiotensin II also stimulates ROS generation.23 Reactive oxygen species are important mediators of vascular complications in diabetes.4,22
The Zucker diabetic fatty (ZDF) obese rat is considered to be an excellent animal model of Type 2 diabetes that presents a physiological and metabolic profile similar to that seen in humans.24,25 The ZDF obese rat is characterized by hyperglycaemia, hyperinsulinaemia, hyperlipidaemia, moderate hypertension, moderate obesity and progressive renal injury.26,27 The ZDF obese rat exhibits progressive diabetic nephropathy around 20 weeks of age;24,28–30 however, the mechanisms responsible remain unclear. Mizuno et al.25 demonstrated that pharmacological blockade of the RAS with an angiotensin AT1 receptor antagonist reduced proteinuria and delayed the progression of renal disease in diabetic nephropathy in ZDF obese rats. This suggested that the activated intrarenal RAS plays an important role in the development of diabetic nephropathy in ZDF obese rats. Meanwhile, we have shown previously that the ROS-related increase in angiotensinogen plays an important role in the development of renal injury in genetic salt-sensitive hypertension.31,32 Moreover, we have recently reported that the activated intrarenal ROS–angiotensinogen axis plays some role in the development of IgA nephropathy in patients at an early stage.33 These data prompted us to examine the possible involvement of enhanced ROS-associated augmentation of intrarenal angiotensinogen in the development of nephropathy at an early stage of diabetes in ZDF obese rats. Therefore, the present study was performed to test the hypothesis that the ROS–angiotensinogen–RAS axis is sequentially activated in the development of diabetic nephropathy in ZDF obese rats.
Methods
Animals
The experimental protocol was approved by the Animal Care and Use Committee of Tulane University. Genetic pairs of male ZDF obese rats (ZDF/GmiCrl-fa/fa) and age-matched control ZDF lean rats (ZDF/GmiCrl-+/fa) were purchased from Charles River Laboratories (Wilmington, MA, USA) at 9 weeks of age (n = 12 of each species). Rats were maintained from 9 to 21 weeks of age. Rats were housed in metabolic cages and maintained in a temperature-controlled room regulated on a 12 h light–dark cycle with free access to water. Rats were fed a commercially available rat chow containing normal salt and 16.7 kcal% fat (Formulab Diet 5008; LabDiet, St Louis, MO, USA).
Urinary measurements
Twenty-four hour urine samples were collected every 3 weeks in centrifuge tubes containing 10 μg/mL indomethacin and 0.005% butylated hydroxytoluene. Urine samples were centrifuged (1500 g at 4°C for 10 min) and each supernatant was separated and stored at −80°C until assayed for 8-isoprostane, which is the major urinary metabolite of F2-isoprostanes, is formed non-enzymatically from the action of superoxide radicals on arachidonic acid34 and is therefore used as a marker of oxidative stress. Urinary 8-isoprostane concentrations were measured by ELISA with a commercially available kit (Cayman, Ann Arbor, MI, USA).
Sample collections
Post-prandial blood glucose levels were monitored using a glucose analyser (TheraSense; Abbott Laboratories, Abbott Park, IL, USA). Rats were killed by decapitation every 3 weeks from 12 to 21 weeks of age (n = 6 at each time point) to harvest kidney samples. Immediately after removal, one kidney was snap-frozen in liquid nitrogen for protein extraction. The contralateral kidney was immersed in zinc-saturated formalin (Anatech, Battle Creek, MI, USA) for tissue fixation.
Western blot analysis
Protein extraction of renal cortex and western blot analysis for angiotensinogen were performed as described previously17–21 using an infrared imaging system (LI-COR Biosciences, Lincoln, NE, USA). Sheep polyclonal antibody against purified rat angiotensinogen was produced and characterized at the University of Queensland (Brisbane, Qld, Australia).35 Anti-β-actin antibody was purchased from Sigma (St Louis, MO, USA). Data of western blot analysis for angiotensinogen protein levels were normalized by β-actin protein levels.
Immunohistochemical analysis
Using zinc-saturated, formalin-fixed, paraffin-embedded renal sections, the intensity of AngII-like immunoreactivity was examined by immunohistochemistry with a commercially available antibody against AngII (Phoenix, Burlingame, CA, USA), as described previously.33,36–38 Immunohistochemistry was performed by a robotic system (Autostainer; Dako, Carpinteria, CA, USA) and samples were counter-stained with haematoxylin. Twenty glomeruli and 20 consecutive microscopic fields of tubules were examined for each rat and the intensity of AngII-like immunoreactivity (brown) was calculated. The averaged intensity of AngII-like immunoreactivity in glomeruli and tubules was then obtained for each rat.
In a similar manner, the desmin-positive area in the glomeruli, desmin being a marker of podocyte injury, was examined by immunohistochemistry using a commercially available antibody against desmin (Dako). The fraction of glomeruli occupied by desmin was determined using Image-Pro plus software (Media Cybernetics, Bethesda, MD, USA). For each glomerulus, the desmin-positive area (brown) was automatically calculated by the software and this affected area was, in turn, divided by the total area of the glomerulus. Twenty glomeruli were examined for each rat and the averaged percentages of the desmin-positive lesions were obtained for each rat.
Histological analysis
Using zinc-saturated, formalin-fixed, paraffin-embedded renal sections, the extent of the interstitial collagen-positive area was evaluated quantitatively by an automatic image analysis, which determined the area occupied by interstitial tissue staining positive for collagen in Masson's trichrome-stained sections (Mass Histology, Worcester, MA, USA), as described previously.33,36–38 The fraction of the renal cortex occupied by interstitial tissue was determined using Image-Pro plus software (Media Cybernetics). For each microscopic field, the collagen-positive area (blue) was automatically calculated by the software and this affected area was, in turn, divided by the total area of the microscopic field. Twenty consecutive microscopic fields were examined for each rat and the averaged percentages of the collagen-positive lesions were obtained for each rat.
The immunohistochemical and histological stains described above were performed by a robotic system (Autostainer; Dako) and an outsourcing company (Mass Histology), respectively; then, all quantitative analyses were performed using automatic image analysis software (Media Cybernetics) in a blinded manner to avoid any bias.
Statistical analysis
Statistical analysis was performed using a one-way factorial anova with post hoc Scheffé's F-test All data are presented as the mean±SEM. P < 0.05 was considered significant.
Results
General data
The ZDF obese rats developed diabetes mellitus at 12 weeks, as manifested by significant increases compared with age-matched ZDF lean rats in post-prandial blood glucose (241 ± 44 vs 76 ± 7 mg/dL, respectively), water intake (72 ± 14 vs 27 ± 1 mL/day, respectively) and urine volume (40 ± 12 vs 11 ± 1 mL/day, respectively).
Urinary 8-isoprostane
As shown in Fig. 1, urinary excretion of 8-isoprostane, a marker of intrarenal oxidative stress, was similar between the control lean and obese ZDF rats at 12 weeks (23 ± 5 vs 19 ± 3 ng/day, respectively). However, urinary excretion of 8-isoprostane was significantly increased at 15 weeks in ZDF obese rats compared with controls (36 ± 6 vs 15 ± 2 ng/day, respectively).
Fig. 1.

Urinary 8-isoprostane excretion from Zucker diabetic fatty (ZDF) obese (■) and control lean (□) rats. Urinary excretion of 8-isoprostane, a marker of intrarenal oxidative stress, was similar between the two groups at 12 weeks of age; however, urinary excretion of 8-isoprostane was significantly increased at 15 weeks in ZDF obese rats compared with controls. *P < 0.05 compared with control lean rats at the same age.
Intrarenal angiotensinogen
As shown in Fig. 2, intrarenal angiotensinogen protein levels were similar between the obese and control lean ZDF rats at 15 weeks (relative ratios of 0.90 ± 0.16 vs 1.00 ± 0.10, respectively). However, intrarenal angiotensinogen protein levels were significantly increased at 18 weeks in ZDF obese rats compared with controls (relative ratios of 2.32 ± 0.21 vs 1.00 ± 0.20, respectively). No differences were observed among samples in the amount of β-actin.
Fig. 2.
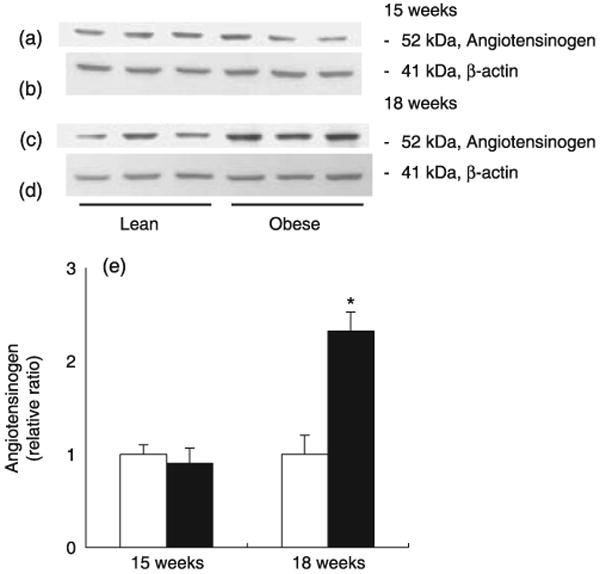
Intrarenal angiotensinogen protein levels in Zucker diabetic fatty (ZDF) obese (■) and control lean (□) rats. Intrarenal angiotensinogen protein levels were similar between the two groups at 15 weeks of age (a,e); however, intrarenal angiotensinogen protein levels were significantly increased at 18 weeks in ZDF obese rats compared with control (c,e). No differences in the amount of β-actin were observed among samples (b,d). *P < 0.05 compared with control lean rats at the same age.
Intrarenal AngII-like immunoreactivity
As shown in Fig. 3, relative ratios of intrarenal AngII-like immunoreactivity were similar between the control lean and obese ZDF rats in both the glomeruli (1.00 ± 0.12 vs 0.93 ± 0.03, respectively) and tubules (1.09 ± 0.57 vs 1.00 ± 0.20, respectively) at 12 weeks. However, at 21 weeks, intrarenal AngII-like immunoreactivity was significantly increased in ZDF obese rats compared with controls in both the glomeruli (1.98 ± 0.55 vs 1.00 ± 0.03, respectively) and tubules (1.58 ± 0.16 vs 1.00 ± 0.13, respectively).
Fig. 3.

(a–e) Intrarenal angiotensin (Ang) II-like immunoreactivity in the glomeruli of Zucker diabetic fatty (ZDF) obese (b,d) and control lean (a,c) rats at 12 and 21 weeks of age. Intrarenal AngII-like immunoreactivity in the glomeruli was similar between the groups at 12 weeks of age (a,b,e); however, intrarenal AngII-like immunoreactivity in the glomeruli increased significantly at 21 weeks in ZDF obese rats compared with controls (c–e). (□), ZDF lean; (■), ZDF obese. (f–j) Intrarenal AngII-like immunoreactivity in tubules of ZDF obese (g,i) and control lean (f,h) rats at 12 and 21 weeks of age. Intrarenal AngII-like immunoreactivity in tubules was similar between the groups at 12 weeks of age (f,g,j) but, increased significantly at 21 weeks in ZDF obese rats compared with controls (h–j). *P < 0.05 compared with the control lean rats at the same age.
Renal injury
As shown in Fig. 4a–e, the desmin-positive area in the glomeruli was significantly increased at 21 weeks in ZDF obese rats compared with controls (0.63 ± 0.08 vs 0.22 ± 0.05%, respectively), even though these changes were not observed at 12 weeks (0.15 ± 0.06 vs 0.09 ± 0.03% in obese and lean ZDF rats, respectively).
Fig. 4.
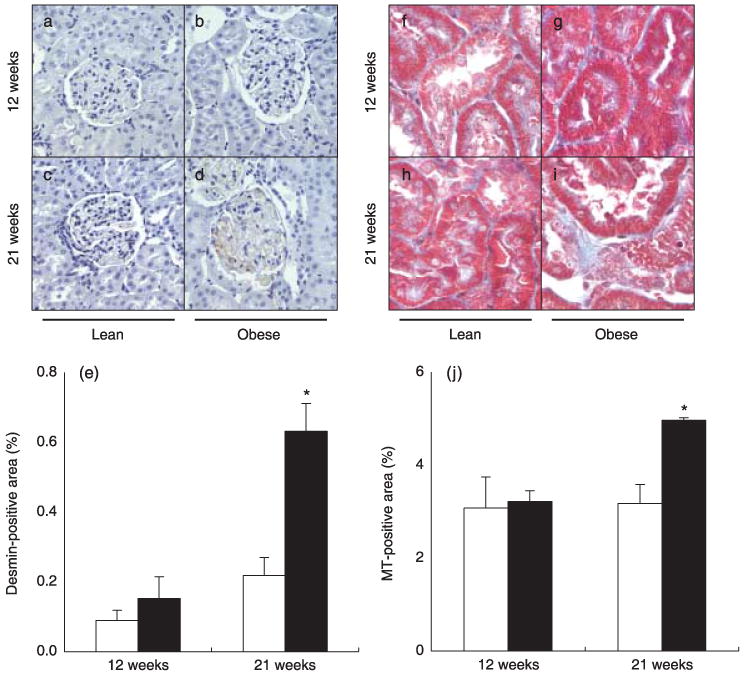
(a–e) Desmin-positive area in the glomeruli of Zucker diabetic fatty (ZDF) obese (b,d) and control lean (a,c) rats at 12 and 21 weeks of age. The desmin-positive area was similar between the groups at 12 weeks of age (a,b,e); however, the desmin-positive area was increased significantly at 21 weeks in ZDF obese rats compared with controls (c,d,e). (□), ZDF lean; (■), ZDF obese. (f–j) Masson's trichrome (MT)-positive area in the interstitium of ZDF obese (g,i) and control lean (f,h) rats. The MT-positive area was similar between the groups at 12 weeks of age (f,g,j), but increased significantly increased at 21 weeks in ZDF obese rats compared with controls (h–j). *P < 0.05 compared with control lean rats at the same age.
Similarly, as shown in Fig. 4f–j, the Masson's trichrome stain-positive area in the interstitium was significantly increased at 21 weeks in ZDF obese rats compared with controls (4.97 ± 0.05 vs 3.18 ± 0.41%, respectively), even though these changes were not evident at 12 weeks (3.22 ± 0.24 versus 3.08 ± 0.67% in obese and lean ZDF rats, respectively).
Discussion
Although the ZDF obese rat is considered an excellent animal model of Type 2 diabetes24–27 with progressive diabetic nephropathy,24,28–30 the detailed mechanisms responsible for these effects remain unclear. However, activation of the intrarenal RAS has been suggested recently.25 Meanwhile, we reported previously that the intrarenal ROS-related increase in angiotensinogen plays an important role in the development of renal injury in genetic salt-sensitive hypertensive animals,31,32 as well as in IgA nephropathy patients.33 These data prompted us to examine the possible involvement of enhanced ROS-associated augmentation of intrarenal angiotensinogen in the development of nephropathy at the early stage of diabetes in ZDF obese rats. In the present study, we clearly demonstrated that the ROS–angiotensinogen–RAS axis is activated sequentially in the development of diabetic nephropathy in ZDF obese rats.
In the present study, 8-isoprostane, a marker of oxidative stress, was significantly elevated in ZDF rats at 15 weeks of age. High glucose induces the generation of ROS generation via non-enzymatic glycation of proteins or glucose auto-oxidation.22 Hyperglycaemia, the main determinant of the initiation and progression of diabetic nephropathy, not only generates more reactive oxygen metabolites, but also attenuates anti-oxidative mechanisms through non-enzymatic glycation of anti-oxidant enzymes.39 It has been reported that 8-isoprostane is enhanced in the setting of diabetes in Type 140 and Type 2 diabetic patients.41 These studies support the concept that high glucose-induced ROS is involved in the setting of diabetic nephropathy.
Changes in angiotensinogen levels can control the activity of the RAS and its upregulation may lead to elevated AngII levels.42,43 Our previous report suggested that stimulation of angiotensinogen synthesis by AngII may be a key component in the maintenance of elevated intrarenal AngII levels, leading to renal injury.17–21 Interestingly, it has been reported that angiotensinogen gene expression is induced by high glucose in proximal tubular cells.44 In addition, Hsieh et al.45,46 demonstrated that the stimulatory action of high glucose on angiotensinogen gene expression in immortalized renal proximal tubular cells is mediated at least in part via ROS generation. Moreover, Brezniceanu et al.47 recently reported that kidney specific overexpression of rat catalase prevented the stimulation of ROS and angiotensinogen mRNA expression in tubules in streptozotocin-induced diabetic mice. We also showed that augmentation of angiotensinogen is caused by ROS in hypertensive rats.31,32 In addition, we have recently reported that the activated intrarenal ROS–angiotensinogen axis plays a role in the development of IgA nephropathy in patients.33 The present data also demonstrate that concomitant increases in ROS and angiotensinogen in ZDF obese rats compared with control lean rats are evident before renal injury in ZDF obese rats. Thus, the results of the present study suggest that ROS and ROS-mediated angiotensinogen activation may have an important role in the early mediation of diabetic nephropathy in ZDF obese rats.
In summary, we have demonstrated that the augmented oxidative stress, intrarenal angiotensinogen and intrarenal AngII were sequentially activated in the development of renal injury in ZDF obese rats. These data suggest that the sequential activation of the ROS–angiotensinogen–RAS axis plays an important role in the development of diabetic nephropathy in ZDF obese rats. These mechanisms may account, in part, for the renoprotective effects of AngII AT1 receptor antagonists and angiotensin-converting enzyme inhibitors in diabetic nephropathy.
Acknowledgments
This study was supported by grants from the National Institute of Diabetes and Digestive and Kidney Diseases (R01DK072408), the National Center for Research Resources (P20RR017659), the National Heart, Lung and Blood Institute (R01HL026371), the Health Excellence Fund from Louisiana Board of Regents and Sankyo Co. Ltd. (Tokyo, Japan). The authors acknowledge critical reviews and valuable comments of Ryousuke Satou, PhD, and L Gabriel Navar, PhD (Tulane University). The authors also acknowledge the excellent technical assistance of My-Linh Rauv, Duy V Tran and Dale M Seth (Tulane University).
References
- 1.Joss N, Paterson KR, Deighan CJ, Simpson K, Boulton-Jones JM. Diabetic nephropathy: How effective is treatment in clinical practice? Q J Med. 2002;95:41–9. doi: 10.1093/qjmed/95.1.41. [DOI] [PubMed] [Google Scholar]
- 2.The Diabetes Control and Complications Trial Research Group. The effect of intensive treatment of diabetes on the development and progression of long-term complications in insulin-dependent diabetes mellitus. N Engl J Med. 1993;329:977–86. doi: 10.1056/NEJM199309303291401. [DOI] [PubMed] [Google Scholar]
- 3.UK Prospective Diabetes Study (UKPDS) Group. Intensive blood-glucose control with sulphonylureas or insulin compared with conventional treatment and risk of complications in patients with type 2 diabetes (UKPDS 33) Lancet. 1998;352:837–53. [PubMed] [Google Scholar]
- 4.Nagai Y, Yao L, Kobori H, et al. Temporary angiotensin II blockade at the prediabetic stage attenuates the development of renal injury in type 2 diabetic rats. J Am Soc Nephrol. 2005;16:703–11. doi: 10.1681/ASN.2004080649. [DOI] [PMC free article] [PubMed] [Google Scholar]
- 5.Carey RM, Siragy HM. The intrarenal renin–angiotensin system and diabetic nephropathy. Trends Endocrinol Metab. 2003;14:274–81. doi: 10.1016/s1043-2760(03)00111-5. [DOI] [PubMed] [Google Scholar]
- 6.Brenner BM, Cooper ME, de Zeeuw D, et al. Effects of losartan on renal and cardiovascular outcomes in patients with type 2 diabetes and nephropathy. N Engl J Med. 2001;345:861–9. doi: 10.1056/NEJMoa011161. [DOI] [PubMed] [Google Scholar]
- 7.Lewis EJ, Hunsicker LG, Bain KP, Rhode RD. The effect of angiotensin-converting-enzyme inhibition on diabetic nephropathy. N Engl J Med. 1993;329:1456–62. doi: 10.1056/NEJM199311113292004. [DOI] [PubMed] [Google Scholar]
- 8.Barnett AH, Bain SC, Bouter P, et al. Angiotensin-receptor blockade versus converting-enzyme inhibition in type 2 diabetes and nephropathy. N Engl J Med. 2004;351:1952–61. doi: 10.1056/NEJMoa042274. [DOI] [PubMed] [Google Scholar]
- 9.Hollenberg NK. Renal implications of angiotensin receptor blockers. Am J Hypertens. 2001;14(Suppl):S237–41. doi: 10.1016/s0895-7061(01)02133-1. [DOI] [PubMed] [Google Scholar]
- 10.Kobori H, Nangaku M, Navar LG, Nishiyama A. The intrarenal renin–angiotensin system: From physiology to the pathobiology of hypertension and kidney disease. Pharmacol Rev. 2007;59:251–87. doi: 10.1124/pr.59.3.3. [DOI] [PubMed] [Google Scholar]
- 11.Skeggs LT, Jr, Kahn JR, Lentz K, Shumway NP. The preparation, purification, and amino acid sequence of a polypeptide renin substrate. J Exp Med. 1957;106:439–53. doi: 10.1084/jem.106.3.439. [DOI] [PMC free article] [PubMed] [Google Scholar]
- 12.Dubey RK, Jackson EK, Luscher TF. Nitric oxide inhibits angiotensin II-induced migration of rat aortic smooth muscle cell. Role of cyclic-nucleotides and angiotensin1 receptors. J Clin Invest. 1995;96:141–9. doi: 10.1172/JCI118014. [DOI] [PMC free article] [PubMed] [Google Scholar]
- 13.Vaughan DE, Lazos SA, Tong K. Angiotensin II regulates the expression of plasminogen activator inhibitor-1 in cultured endothelial cells. A potential link between the renin–angiotensin system and thrombosis. J Clin Invest. 1995;95:995–1001. doi: 10.1172/JCI117809. [DOI] [PMC free article] [PubMed] [Google Scholar]
- 14.Hannken T, Schroeder R, Stahl RA, Wolf G. Angiotensin II-mediated expression of p27Kip1 and induction of cellular hypertrophy in renal tubular cells depend on the generation of oxygen radicals. Kidney Int. 1998;54:1923–33. doi: 10.1046/j.1523-1755.1998.00212.x. [DOI] [PubMed] [Google Scholar]
- 15.Kawada N, Imai E, Karber A, Welch WJ, Wilcox CS. A mouse model of angiotensin II slow pressor response: Role of oxidative stress. J Am Soc Nephrol. 2002;13:2860–8. doi: 10.1097/01.asn.0000035087.11758.ed. [DOI] [PubMed] [Google Scholar]
- 16.Welch WJ, Mendonca M, Aslam S, Wilcox CS. Roles of oxidative stress and AT1 receptors in renal hemodynamics and oxygenation in the postclipped 2K,1C kidney. Hypertension. 2003;41:692–6. doi: 10.1161/01.HYP.0000052945.84627.8F. [DOI] [PubMed] [Google Scholar]
- 17.Kobori H, Harrison-Bernard LM, Navar LG. Expression of angiotensinogen mRNA and protein in angiotensin II-dependent hypertension. J Am Soc Nephrol. 2001;12:431–9. doi: 10.1681/asn.v123431. [DOI] [PMC free article] [PubMed] [Google Scholar]
- 18.Kobori H, Harrison-Bernard LM, Navar LG. Enhancement of angiotensinogen expression in angiotensin II-dependent hypertension. Hypertension. 2001;37:1329–35. doi: 10.1161/01.hyp.37.5.1329. [DOI] [PMC free article] [PubMed] [Google Scholar]
- 19.Kobori H, Harrison-Bernard LM, Navar LG. Urinary excretion of angiotensinogen reflects intrarenal angiotensinogen production. Kidney Int. 2002;61:579–85. doi: 10.1046/j.1523-1755.2002.00155.x. [DOI] [PMC free article] [PubMed] [Google Scholar]
- 20.Kobori H, Nishiyama A, Harrison-Bernard LM, Navar LG. Urinary angiotensinogen as an indicator of intrarenal angiotensin status in hypertension. Hypertension. 2003;41:42–9. doi: 10.1161/01.hyp.0000050102.90932.cf. [DOI] [PMC free article] [PubMed] [Google Scholar]
- 21.Kobori H, Prieto-Carrasquero MC, Ozawa Y, Navar LG. AT1 receptor mediated augmentation of intrarenal angiotensinogen in angiotensin II-dependent hypertension. Hypertension. 2004;43:1126–32. doi: 10.1161/01.HYP.0000122875.91100.28. [DOI] [PMC free article] [PubMed] [Google Scholar]
- 22.Ha H, Lee HB. Reactive oxygen species as glucose signaling molecules in mesangial cells cultured under high glucose. Kidney Int Suppl. 2000;77:S19–25. doi: 10.1046/j.1523-1755.2000.07704.x. [DOI] [PubMed] [Google Scholar]
- 23.Liu J, Yang F, Yang XP, Jankowski M, Pagano PJ. NAD(P)H oxidase mediates angiotensin II-induced vascular macrophage infiltration and medial hypertrophy. Arterioscler Thromb Vasc Biol. 2003;23:776–82. doi: 10.1161/01.ATV.0000066684.37829.16. [DOI] [PubMed] [Google Scholar]
- 24.Hoshi S, Shu Y, Yoshida F, et al. Podocyte injury promotes progressive nephropathy in zucker diabetic fatty rats. Lab Invest. 2002;82:25–35. doi: 10.1038/labinvest.3780392. [DOI] [PubMed] [Google Scholar]
- 25.Mizuno M, Sada T, Kato M, Koike H. Renoprotective effects of blockade of angiotensin II AT1 receptors in an animal model of type 2 diabetes. Hypertens Res. 2002;25:271–8. doi: 10.1291/hypres.25.271. [DOI] [PubMed] [Google Scholar]
- 26.Vora JP, Zimsen SM, Houghton DC, Anderson S. Evolution of metabolic and renal changes in the ZDF/drt-fa rat model of type II diabetes. J Am Soc Nephrol. 1996;7:113–17. doi: 10.1681/ASN.V71113. [DOI] [PubMed] [Google Scholar]
- 27.Etgen GJ, Oldham BA. Profiling of Zucker diabetic fatty rats in their progression to the overt diabetic state. Metabolism. 2000;49:684–8. doi: 10.1016/s0026-0495(00)80049-9. [DOI] [PubMed] [Google Scholar]
- 28.Schafer S, Linz W, Bube A, et al. Vasopeptidase inhibition prevents nephropathy in Zucker diabetic fatty rats. Cardiovasc Res. 2003;60:447–54. doi: 10.1016/s0008-6363(03)00544-3. [DOI] [PubMed] [Google Scholar]
- 29.Coimbra TM, Janssen U, Grone HJ, et al. Early events leading to renal injury in obese Zucker (fatty) rats with type II diabetes. Kidney Int. 2000;57:167–82. doi: 10.1046/j.1523-1755.2000.00836.x. [DOI] [PubMed] [Google Scholar]
- 30.Chander PN, Gealekman O, Brodsky SV, et al. Nephropathy in Zucker diabetic fat rat is associated with oxidative and nitrosative stress: Prevention by chronic therapy with a peroxynitrite scavenger ebselen. J Am Soc Nephrol. 2004;15:2391–403. doi: 10.1097/01.ASN.0000135971.88164.2C. [DOI] [PubMed] [Google Scholar]
- 31.Kobori H, Nishiyama A, Abe Y, Navar LG. Enhancement of intrarenal angiotensinogen in Dahl salt-sensitive rats on high salt diet. Hypertension. 2003;41:592–7. doi: 10.1161/01.HYP.0000056768.03657.B4. [DOI] [PMC free article] [PubMed] [Google Scholar]
- 32.Kobori H, Nishiyama A. Effects of tempol on renal angiotensinogen production in Dahl salt-sensitive rats. Biochem Biophys Res Commun. 2004;315:746–50. doi: 10.1016/j.bbrc.2004.01.120. [DOI] [PMC free article] [PubMed] [Google Scholar]
- 33.Kobori H, Katsurada A, Ozawa Y, et al. Enhanced intrarenal oxidative stress and angiotensinogen in IgA nephropathy patients. Biochem Biophys Res Commun. 2007;358:156–63. doi: 10.1016/j.bbrc.2007.04.105. [DOI] [PMC free article] [PubMed] [Google Scholar]
- 34.Patrono C, FitzGerald GA. Isoprostanes: Potential markers of oxidant stress in atherothrombotic disease. Arterioscler Thromb Vasc Biol. 1997;17:2309–15. doi: 10.1161/01.atv.17.11.2309. [DOI] [PubMed] [Google Scholar]
- 35.Thomas WG, Sernia C. Immunocytochemical localization of angiotensinogen in the rat brain. Neuroscience. 1988;25:319–41. doi: 10.1016/0306-4522(88)90029-2. [DOI] [PubMed] [Google Scholar]
- 36.Kobori H, Ozawa Y, Suzaki Y, Nishiyama A. Enhanced intrarenal angiotensinogen contributes to early renal injury in spontaneously hypertensive rats. J Am Soc Nephrol. 2005;16:2073–80. doi: 10.1681/ASN.2004080676. [DOI] [PMC free article] [PubMed] [Google Scholar]
- 37.Ozawa Y, Kobori H, Suzaki Y, Navar LG. Sustained renal interstitial macrophage infiltration following chronic angiotensin II infusions. Am J Physiol Renal Physiol. 2007;292:F330–9. doi: 10.1152/ajprenal.00059.2006. [DOI] [PMC free article] [PubMed] [Google Scholar]
- 38.Ozawa Y, Kobori H. Crucial role of Rho–nuclear factor-κB axis in angiotensin II-induced renal injury. Am J Physiol Renal Physiol. 2007;293:F100–9. doi: 10.1152/ajprenal.00520.2006. [DOI] [PMC free article] [PubMed] [Google Scholar]
- 39.Wolff SP, Jiang ZY, Hunt JV. Protein glycation and oxidative stress in diabetes mellitus and ageing. Free Radic Biol Med. 1991;10:339–52. doi: 10.1016/0891-5849(91)90040-a. [DOI] [PubMed] [Google Scholar]
- 40.Davi G, Chiarelli F, Santilli F, et al. Enhanced lipid peroxidation and platelet activation in the early phase of type 1 diabetes mellitus: Role of interleukin-6 and disease duration. Circulation. 2003;107:3199–203. doi: 10.1161/01.CIR.0000074205.17807.D0. [DOI] [PubMed] [Google Scholar]
- 41.Davi G, Ciabattoni G, Consoli A, et al. In vivo formation of 8-isoprostaglandin F2α and platelet activation in diabetes mellitus: Effects of improved metabolic control and vitamin e supplementation. Circulation. 1999;99:224–9. doi: 10.1161/01.cir.99.2.224. [DOI] [PubMed] [Google Scholar]
- 42.Navar LG, Harrison-Bernard LM, Nishiyama A, Kobori H. Regulation of intrarenal angiotensin II in hypertension. Hypertension. 2002;39:316–22. doi: 10.1161/hy0202.103821. [DOI] [PMC free article] [PubMed] [Google Scholar]
- 43.Kobori H, Ozawa Y, Suzaki Y, et al. Young scholars award lecture: Intratubular angiotensinogen in hypertension and kidney diseases. Am J Hypertens. 2006;19:541–50. doi: 10.1016/j.amjhyper.2005.11.014. [DOI] [PMC free article] [PubMed] [Google Scholar]
- 44.Wang TT, Wu XH, Zhang SL, Chan JS. Effect of glucose on the expression of the angiotensinogen gene in opossum kidney cells. Kidney Int. 1998;53:312–19. doi: 10.1046/j.1523-1755.1998.00775.x. [DOI] [PubMed] [Google Scholar]
- 45.Hsieh TJ, Zhang SL, Filep JG, Tang SS, Ingelfinger JR, Chan JS. High glucose stimulates angiotensinogen gene expression via reactive oxygen species generation in rat kidney proximal tubular cells. Endocrinology. 2002;143:2975–85. doi: 10.1210/endo.143.8.8931. [DOI] [PubMed] [Google Scholar]
- 46.Hsieh TJ, Fustier P, Wei CC, et al. Reactive oxygen species blockade and action of insulin on expression of angiotensinogen gene in proximal tubular cells. J Endocrinol. 2004;183:535–50. doi: 10.1677/joe.1.05871. [DOI] [PubMed] [Google Scholar]
- 47.Brezniceanu ML, Liu F, Wei CC, et al. Catalase overexpression attenuates angiotensinogen expression and apoptosis in diabetic mice. Kidney Int. 2007;71:921–3. doi: 10.1038/sj.ki.5002188. [DOI] [PubMed] [Google Scholar]