

Abstract
We previously showed that a vector:lipid delivery system, comprised of a plasmid DNA vector and cationic lipid (lipoplex), when injected into the cerebrospinal fluid (CSF) of rats can deliver reporter genes in vivo efficiently and with widespread expression to the Central Nervous System (CNS). To further characterize this delivery system, we now present experiments that demonstrate the in vivo time-to-peak expression of the reporter gene, firefly luciferase. We infused a formulated lipoplex containing the lipid MLRI [dissymmetric myristoyl (14:0) and lauroyl (12:1) rosenthal inhibitor–substituted compound formed from the tetraalkylammonium glycerol–based DORI] and pNDluc, a luciferase vector, into CSF in the cisterna magna (CM) of the rat. Luciferase activity was followed over time by bioluminescence imaging after injection of luciferin. Our results show that luciferase activity in the CNS of rats is widespread, peaks 72 hours after injection into CM and can be detected in vivo for at least 7–10 days after peak expression. We further show that in contrast to injection into CSF, enzyme activity is not widely distributed after injection of the vector into brain parenchyma, emphasizing the importance of CSF delivery to achieve widespread vector distribution. Finally, we confirm the distribution of firefly luciferase in brain by immunohistochemical staining from an animal that was euthanized at the peak of enzyme expression.
INTRODUCTION
The field of gene therapy encompasses a spectrum of methods designed to express therapeutic proteins in the intracellular environment of target tissues. The practical application of gene therapy depends on the design and characterization of an appropriate gene delivery system as much as it is on the target biology, for each specific clinical application. Some gene therapies depend on efficient and widespread distribution, uptake and nonspecific expression, while others may require expression only in a targeted subset of cells or tissues. The dose–response and time course of gene expression of the delivered gene should be fully understood for each delivery system.
A gene delivery system can be based on either viral or nonviral vectors. Methods for nonviral delivery include physical methods such as electroporation, hydrodynamic injection, naked DNA delivery, or lipid-mediated vector delivery.1,2 Each of these categories has advantages and disadvantages for particular clinical applications. Some viral-based gene delivery vectors can provide highly efficient protein expression in target tissues. Long-term gene expression can be achieved either by integration of the therapeutic gene into the target tissue’s DNA or by vector persistence as an episome. However, viral vector production is difficult, the viral sequences of these vectors can be highly immunogenic, and control of expression, silencing, and level of expression remain issues.3 Somatic cell genomic integration has, in some cases, caused additional disease in the host. For example, a leukemia-like disease has been reported in children treated with retroviral vectors for severe combined immunodefficiency disease.4–6
Both inefficient delivery to target tissues and transient expression have been viewed as problems of nonviral vectors. Recent advances have led to great improvements in the efficiency of gene transfer by nonviral vectors.7–9 Nonviral vectors are less immunogenic than viral vectors and do not typically integrate into the genome. In addition, short-term gene expression has many clinical applications, though not as chronic therapy for genetic diseases. Nonviral vector delivery of gene sequences may be preferable for any therapy where transient gene expression is advantageous. This might include, e.g., vector expression for brief gene silencing using small-interfering RNA or microRNA.
We are generally interested in the use of gene therapy to deliver sequences to the central nervous system (CNS). We are specifically interested in one such clinical application, the transient expression of neuroprotective proteins before surgeries known to carry a high risk of ischemic events, such as cardiac bypass surgery or neurosurgical resection. For this clinical application, we previously developed a gene delivery system made up of an optimized nonviral vector: cationic lipid complex (lipoplex). We showed that lipoplexes containing either DNA or mRNA provide widespread delivery and expression of reporter genes to cells of the CNS when injected into the cerebrospinal fluid (CSF) of the rat.10,11 To further characterize this delivery system, we use bioluminescence imaging of the intact animal to demonstrate gene expression over time after in vivo nonviral, lipid-mediated gene delivery. We focus on the preclinical development of delivery methods and routes of administration to the CNS that have a favorable risk benefit ratio. For that reason, we have chosen to optimize these nonviral delivery formulations, and, although we use delivery to the CSF, we concentrate on cisterna magna (CM) injection rather than the more invasive lateral ventricle (LV) injection, for eventual clinical application.
We present here experiments that measure transient expression of the firefly luciferase reporter gene in rat CNS after delivery of our nonviral DNA vector, cationic lipid lipoplexes to the CSF. We followed luciferase activity and, by extrapolation, gene expression in vivo using noninvasive optical bioluminescence imaging. A cooled charge-coupled device camera was used to detect photons emitted during the enzymatic breakdown of the substrate luciferin by luciferase. The peak expression and duration of luciferase activity was measured. Finally, standard immunohistochemistry was used to confirm widespread expression of the reporter gene in the CNS of the injected rats.
RESULTS
Time course of luciferase activity after a single IV luciferin injection
We used the detection of emitted light to follow the time course of luciferase activity in vivo. Emitted light is one product of adenosine triphosphate–requiring luciferase cleavage of the substrate luciferin. Our experimental results depend on this indirect measure of the presence of active luciferase in vivo. Cleavage of luciferin and the resultant light emission occurs rapidly, peaking minutes after intravenous (IV) injection of luciferin. Due to the kinetics of this reaction in vivo, it is important to measure light emission over time after each luciferin injection. This allows us to determine the peak (in minutes) after the injection of the enzyme substrate, luciferin, at each time point (in days) after the lipoplex delivery of the luciferase-encoding vector to the CSF.
To separate the rapid kinetics of this breakdown of luciferin by luciferase from the slower kinetics of luciferase gene expression, the maximum photon count at the time of peak luciferase activity after IV luciferin injection was used to represent luciferase activity at each daily interval. Measurements were made in each animal every 1–2 days until the peak was reached, then every several days until the signal intensity was substantially decreased. Peak luciferase activity after luciferin dosing was determined by IVIS imaging of each transfected rat before and every 2–5 minutes after IV luciferin was given. Regions of interest (ROIs) encompassing the areas of most intense light emission were created and counts in the ROIs were determined from each image. This same ROI was used to determine a background count in the image taken immediately before luciferin was injected in each animal. Table 1 reports photon results from measurements over 7 days in one rat expressing luciferase in the CNS after delivery of our lipid-mediated lipoplex vector to CSF of the LV. After background subtraction, counts were plotted versus time over ~30 min after luciferin injection. Figure 1 is a representative example of the whole animal image results from Table 1. Figure 1 shows results on day 3 after CNS injection, which is at or very close to the peak in luciferase expression after CSF delivery of the pND2.lux, MLRI [dissymmetric myristoyl (14:0) and lauroyl (12:1) rosenthal inhibitor–substituted compound formed from the tetraalkylammonium glycerol–based DORI] lipoplex to the rat brain. This figure shows that peak luciferase activity occurs ~5 minutes after luciferin injection. Figure 1 is representative of over 20 similar experiments in which we measured the time-to-peak expression, and the maximum ROI photon counts, after luciferin injection following CM, LV, or brain parenchymal injection. Luciferase activity peaks with a mean of 4.4 minutes (SD 2.5 minutes) after IV luciferin injection, with a range between 2 and 12 minutes. Therefore, IVIS imaging after luciferin injection was performed approximately every 2–5 minutes until a clear peak was observed for every 24–48-hour time point. Photon emission subsequently decreased over time and was generally not detectable over background within 1 hour after IV luciferin injection.
Table 1.
Photon counts after IV luciferin injection in rats expressing luciferase after CNS injection of lipid-mediated vector
| Time after IV luciferin injection | ROI | Background | ROI-BKG |
|---|---|---|---|
| 1.18 | |||
| 2 min | — | — | — |
| 5 min | 178,000 | 4,807 | 173,193 |
| 10 min | 238,000 | 1,204 | 236,796 |
| 15 min | 244,000 | 1,475 | 242,525 |
| 20 min | 233,000 | 997 | 232,003 |
| 30 min | 216,000 | 1,140 | 214,860 |
| 40 min | 190,000 | 554 | 189,446 |
| 1.19 | |||
| 2 min | |||
| 5 min | 400,000 | 1,906 | 398,094 |
| 10 min | 342,000 | 739 | 341,261 |
| 15 min | 297,000 | 1,047 | 295,953 |
| 20 min | 272,000 | 1,297 | 270,703 |
| 30 min | 209,000 | 1,487 | 207,513 |
| 1.20 | |||
| 2 min | 1,020,000 | 2,529 | 1,017,471 |
| 5 min | 1,620,000 | 3,420 | 1,616,580 |
| 10 min | 1,570,000 | 3,974 | 1,566,026 |
| 15 min | 1,490,000 | 4,339 | 1,485,661 |
| 20 min | 1,370,000 | 4,727 | 1,365,273 |
| 30 min | 1,210,000 | 1,977 | 1,208,023 |
| 1.21 | |||
| 2 min | 711,000 | 3,192 | 707,808 |
| 5 min | 789,000 | 2,759 | 786,241 |
| 10 min | 742,000 | 2,562 | 739,438 |
| 15 min | 724,000 | 2,372 | 721,628 |
| 20 min | 652,000 | 3,217 | 648,783 |
| 30 min | 563,000 | 3,708 | 559,292 |
| 1.24 | |||
| 2 min | |||
| 5 min | 31,054 | 129 | 30,925 |
| 10 min | 30,333 | 390 | 29,943 |
| 15 min | 30,799 | 242 | 30,557 |
| 20 min | 29,958 | 271 | 29,687 |
| 30 min | 25,574 | 708 | 24,866 |
| 1.25 | |||
| 2 min | 31,359 | 440 | 30,919 |
| 5 min | 30,499 | 143 | 30,356 |
| 10 min | 27,835 | 113 | 27,722 |
| 15 min | 24,550 | 254 | 24,296 |
| 20 min | 22,215 | 335 | 21,880 |
| 30 min | 14,394 | 242 | 14,152 |
| 1.27 | |||
| 2 min | 37,872 | 994 | 36,878 |
| 5 min | 37,190 | 781 | 36,409 |
| 10 min | 28,631 | 510 | 28,121 |
| 15 min | 23,151 | 438 | 22,713 |
| 20 min | 18,899 | 558 | 18,341 |
| 30 min | 14,383 | 611 | 13,772 |
BKG, background; IV, intravenous; ROI, region of interest.
Figure 1. Time course of luciferase activity after a single intravenous luciferin injection at peak of luciferase expression in rat brain.
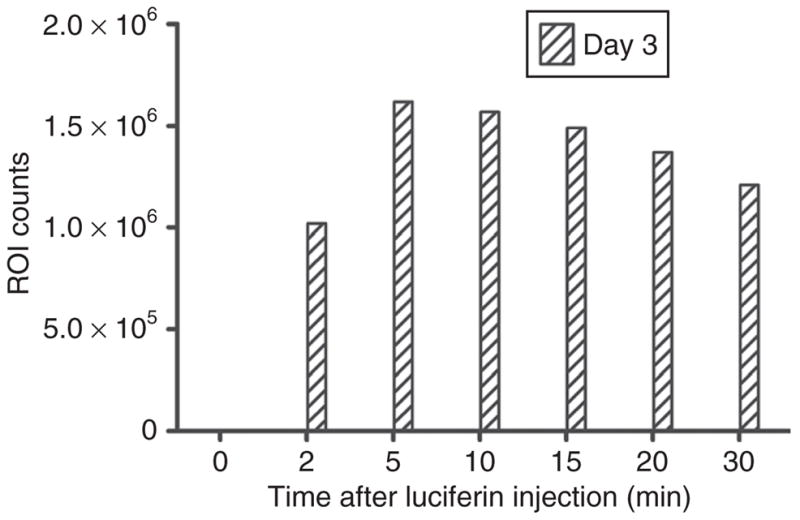
Animals previously transfected with DNA lipoplex encoding for luciferase (pNDluc:MLRI lipoplex) by injection into cerebrospinal fluid were imaged on successive days using the IVIS 100 for background region of interest (ROI) counts and then every 2–5 minutes after intravenous infusion of luciferin. ROI counts were determined for each time point, background subtracted, and plotted against time. One representative time course after a single luciferin injection is shown, corresponding to the image with the highest levels of photon emission and collection from the results of Table 1. Emitted photons decreased to background levels within 60 minutes after injection. MLRI, dissymmetric myristoyl (14:0) and lauroyl (12:1) rosenthal inhibitor–substituted compound formed from the tetraalkylammonium glycerol–based DORI.
Time course of luciferase activity after cDNA:lipid delivery to the CSF
Based on extensive in vitro studies (not reported here) we expected a peak in luciferase expression from 48 to 72 hours. We imaged three animals hourly 3–4 hours after in vivo complementary DNA (cDNA)/lipid lipoplex delivery. These images showed that luciferase activity can be detected over intact rat brain as early as 3 hours after injection, consistent with our in vitro results in a variety of cell types and continued to increase through at least 24 hours. An example of this early expression is seen in Figure 2a. For all subsequent experiments, the time course of luciferase expression was followed by bioluminescent imaging at 24-hour intervals until the peak in expression was determined, and then every several days until the expression had significantly decreased.
Figure 2. Daily time course of luciferase activity after cDNA:lipid lipoplex delivery to the cerebrospinal fluid (CSF).

Animals were imaged on the Xenogen IVIS 100 daily or every several days after injection into rat CSF of DNA lipoplex encoding for luciferase (pNDluc:MLRI lipoplex) via either the cisterna magna (CM) or the left lateral ventricle (LV). Animals were imaged before intravenous luciferin dosing, and then imaged every 2–5 minutes to determine peak luciferase activity, again after background subtraction. Images and region of interest (ROI) counts shown represent peak photon emission at each daily time point. (a) Representative example of light emission images after cisterna magna delivery of the DNA lipoplex encoding for luciferase by injection into CSF (N = 13). This animal was imaged repeatedly over 8 days. A total of 13 animals were injected via the CM. We attempted to image repeatedly daily or every several days, but due to animal-handling issues and animal deaths, not all 13 were imaged until signals had peaked. These images are representative examples. Included in this series of images is an example of relatively high expression already by 2.5 hours. Panels a and b each show one image with ROI marked in red for illustration. The counts in these ROI are displayed in the image just above the ROI, in what looks to be a size bar, as well as alongside the image. (b) Representative example of light emission images after lateral ventricle delivery of the DNA lipoplex encoding for luciferase by injection into CSF. This animal was imaged repeatedly over 10 days, and results are shown in Table 1 and Figure 1. Only two animals were injected in the lateral ventricle. (c) ROI counts from the experiments shown in a, injection into cisterna magna, are plotted against time, in days after injection. Only animals for which at least 3 days measurements were made are included in this statistical analysis. The number of animals averaged for each day is given above each column in c. Very few animals were injected via the lateral ventricle to allow averaging results from each day. MLRI, dissymmetric myristoyl (14:0) and lauroyl (12:1) rosenthal inhibitor–substituted compound formed from the tetraalkylammonium glycerol–based DORI.
Animals were imaged on the Xenogen IVIS 100 (Xenogen, Alameda, CA) daily or every several days after injection into rat CSF of DNA lipoplex encoding for luciferase (pNDluc:MLRI lipoplex) via either the CM or the left LV. Animals were imaged before IV luciferin dosing, and then imaged every 2–5 minutes to determine peak luciferase activity. To quantify the peak level of gene expression, photon counts were determined by first drawing a ROI around the light signal in each image, followed by background subtraction of the detected light signal within each ROI, as described in the Methods and Materials section. Images are shown that represent peak photon emission at each daily time point, and the background-subtracted ROI counts are reported adjacent to each image.
Figure 2a and b illustrate the time course of expression after CM and left LV injections, respectively. Due to the relative ease of CM injection, the invasiveness of the lateral ventricle approach, and the clear risk benefit advantages for preclinical use of the former, we concentrated on the CM route of delivery. Therefore, only two animals were injected via lateral ventricle, while we collected data on a total of 13 animal subjects that were injected via CM route (not all 13 animals were imaged every day nor survived until the signal had returned to near background). Figure 2a is a representative example of light-emission images after CM delivery of the DNA lipoplex encoding for luciferase by injection into CSF. Thirteen animals were injected via the CM. The animal in Figure 2a was imaged repeatedly over 8 days, and shows an example of early expression. Figure 2b is a representative example of light-emission images after LV delivery of the DNA lipoplex encoding for luciferase by injection into CSF. is animal was imaged repeatedly over 10 days. Results are shown in Table 1 and as a histogram in Figure 1 as well. Only two animals were injected in the lateral ventricle, for qualitative comparison only. Figure 2c illustrates the background-subtracted ROI counts from the experiments shown in Figure 2a, injection into CM, plotted against time in days after injection. Figure 2a and b each show one image with ROI marked in red for illustration. The counts in these ROI are displayed in the image just above the ROI, in what looks to be a size bar, as well as alongside the image. Too few animals were injected via the lateral ventricle to allow averaging results from each day.
Widespread distribution of luciferase activity is seen after CM injection of the cDNA:lipid complex, Figure 2a, which is representative of the patterns seen in 13 animals injected via this route, and imaged repeatedly daily or every several days for 10–14 days. Due to animal-handling issues and animal deaths, not all 13 animals were imaged every day nor survived until the signal had returned to near background. More luciferase activity is seen near the site of injection at early and late time points. Enzyme expression is detected over most of the rat’s head, which seems to correspond to the entire rat brain.
As noted earlier, Figure 2a is representative of the time course after CM injections (N = 13), while Figure 2b is an example of the time course after LV injection (N = 2).
Figure 2c illustrates representative photon counts within the ROI for CM-injected rats, plotted over time. The ROI counts of light emission for every animal for which we have at least 3 days measurements were used to calculate the average and SD for Figure 2c. The N for each column for Figure 2c is given above each column, of the 13 animals in total that were injected via the CM. is figure and the time course that is illustrated by these averages are representative of the results seen individually in these 13 animals.
The absolute level of light detected was variable, and this may reflect the level of luciferase activity or other biological factors as discussed later. The overall time course of enzyme activity, and therefore, we assume, the time course of gene expression, was consistent among animals, with a reproducible peak at 72 hours. In general, luciferase activity then decreased rapidly after 72 hours, although a low level of activity was detected for many days after injection. However, in one animal, an apparently stable and significant level of activity was detected as long as 5 weeks after injection. Figure 3 shows images of the time course of luciferase activity of this animal. More commonly, luciferase activity became undetectable by bioluminescence imaging 10–14 days after injection.
Figure 3. Unusually persistent luciferase activity after cisterna magna lipoplex delivery.

Animal transfected with the pNDluc:MLRI lipoplex via cisterna magna injection which displayed uncharacteristically persistent luciferase expression. Light emission after luciferin injection was then followed at 24-hour intervals for 5 days, then every third day and finally weekly up to 5 weeks after transfection. The image at peak photon emission/luciferase activity is shown at each time point. MLRI, dissymmetric myristoyl (14:0) and lauroyl (12:1) rosenthal inhibitor–substituted compound formed from the tetraalkylammonium glycerol–based DORI; ROI, region of interest.
Time course after parenchymal vector complex delivery
For comparison to CSF injections, the luciferase carrying vector:lipid complex was injected directly into the parenchyma of the rat brain. Figure 4 shows a time course of images taken at 24-hour intervals after a subcortical injection was administered adjacent to the left lateral ventricle. ROIs were created over the emitted light for each time point and the photons in each ROI were quantified after background subtraction. Light emission after 24 hours remains directly over the site of injection. Light emission and thus luciferase activity continued to increase over the 3 days this animal was followed, consistent with our other time-course results (Figure 2), although the ROI counts are markedly lower. The common and well-recognized phenomena of bioluminescence,12 most commonly attributed to the animal’s fur and bioluminescent gut bacteria, can also be observed due to the low absolute level of the luciferase signal. At 72 hours, some photon signal is seen on the contralateral side over the rat brain, but the signal is not nearly as widespread as that seen after CSF delivery.
Figure 4. Time course of luciferase activity after parenchymal injection.

For comparison, the animal shown was injected with pNDluc:MLRI lipoplex as described for lateral ventricle delivery (see Materials and Methods), but stereotaxic coordinates were adjusted so that lipoplex was delivered to brain parenchyma just lateral to the left lateral ventricle. IVIS images were collected at 24-hour intervals and peak region of interest (ROI) counts at each time point are shown. Due to the much lower photon emission collected in each ROI (reported numerically next to each image), low levels of background expression, luminescence artifact, and possible renal expression may be observed. This well-known phenomenon of low-level bioluminescence artifact is discussed in the text. MLRI, dissymmetric myristoyl (14:0) and lauroyl (12:1) rosenthal inhibitor–substituted compound formed from the tetraalkylammonium glycerol–based DORI.
Luciferase immunofluorescence
Distribution and expression of luciferase in rat brain after delivery and transfection with our vector:lipid lipoplex via CSF injection appears to be widespread as detected by photon emission, consistent with our previous immunohistochemistry results.10,11 This is in contrast to the limited distribution and expression seen after parenchymal injection of the vector lipid lipoplex. To confirm this result at the cellular level, the brains from a rat 72 hours after CM injection (the time of peak luciferase expression by in vivo imaging) of the vector:lipid lipoplex and a control rat (not injected) were sectioned and prepared as described (see Materials and Methods). Luciferase expression in these sections was detected using a rabbit polyclonal antibody against luciferase. Figure 5 shows several regions of rat brain from both the transfected and the control animals. Sections of transfected rat brain show widespread cellular staining for luciferase, while sections of tissue from the noninjected rat show no staining.
Figure 5. Immunohistochemical micrographs of rat brain parenchyma 72 hours after transfection with lipoplex via cisterna magna injection.

(a) IVIS image immediately before the injection of luciferin. (b) IVIS image at peak luciferase activity 72 hours after lipoplex transfection, just before euthanasia and perfusion. (c, e, and g) Nontransfected (control) rat brain parenchyma at ×10, ×20, and ×40 original magnifications. Panels (d, f, and h) show same magnifications of lipoplex-transfected brain parenchyma. Animals were euthanized and brains were prepared as described in Materials and Methods.
DISCUSSION
Bioluminescent imaging is most often used to follow tumor growth12 or viral vector delivery to tumors,13 or to track stem cell migration in brain.14 Delivery of reporter genes by nonviral vectors does not lead to integration of the delivered sequence into the target tissue genome and thus generally results in transient gene expression. We present experiments here that quantify the time-to-peak expression and relative intensity of our nonviral, lipid-mediated gene delivery system by following the transient expression of the reporter gene firefly luciferase. This system acts as a model for the delivery of vectors carrying therapeutic genes for transient, preoperative neuroprotection. This lipoplex delivery system is also a confirmation of the potential for widespread expression of any gene of interest. We followed luciferase expression in cells of the CNS by in vivo imaging after CSF delivery of the plasmid pNDluc complexed with the cationic lipid MLRI into rats. After vector delivery, rats were injected with the enzyme substrate, luciferin, at 24-hour intervals and light emission was quantified at peak enzyme activity after each luciferin injection.
Our results show peak enzyme activity 4–5 minutes after IV luciferin substrate administration. Previously published experiments15–17 have all been reported in mice, after luciferin was delivered via intraperitoneal or intratumor injection. The time of peak light emission in the earlier experiments usually ranged from 10 to 30 minutes, while Rettig et al.17 reported peak light emission only 4 minutes after intraperitoneal luciferin dose. Our results for the overall duration of the detectable reaction agree with these published experiments (see earlier text) and suggest that substrate luciferin is fully cleaved within our limits of detection ~1 hour after dosing.
Using photon counts at peak luciferase activity to follow gene expression in vivo, peak expression occurred 72 hours after delivery of the nonviral vector to the CSF, independent of the anatomical site of delivery. Luciferase activity, and by inference, gene expression, then declined rapidly and in most cases was no longer detected 10–14 days after transfection. These in vivo results are consistent with in vitro time-course experiments in CHO-K1, NIH3T3, and primary neuronal cells. All these cell types, when transfected with the same pND2.lux:MLRI vector complex, demonstrate peak luciferase activity ~72 hours after transfection (S.Z., K.S., M.H.N., and J.G.H., manuscript in preparation).
Figure 2a is a composite image showing the collected bioluminescent images at various time points after lipoplex injection into CM. Figure 2b is a similar composite showing time points after LV injection of an identical lipoplex. There appear to be distinct differences in the light emission patterns over time between animals injected at the two sites. Figure 2a shows widespread distribution of luciferase activity after CM injection of the cDNA:lipid complex. More luciferase activity is seen near the site of injection at early and late time points. Comparison of the 72-hour images in Figures 2a and b, however, suggest that after CM injection, enzyme expression is detected over more of the rat’s head, which seems to correspond to the entire rat brain. In contrast, 24 hours after LV vector delivery (Figure 2b, 24-hour image), luciferase activity is greater on the left than the right side of the animal’s head, but the light signal clearly crosses the midline of the skull. By 72 hours, light emission seems symmetric over the CNS, suggesting that the vector is transported through the ventricular system of the brain to allow for widespread distribution and uptake. As the time course continues and the signal diminishes, luciferase activity is most persistent in the region closest to the injection site (Figure 2a, 8 day image). After 72 hours, no light signal is detected over the CM and cerebellum after LV delivery of the vector:lipid complex (Figure 2b).
The results from Figures 2a and b, in which the differences in in vivo imaging after injection of lipoplex to either CM or lateral ventricle are compared, suggest that there is an injection site–dependent distribution of the vector:lipid complex, which may be due to the direction of CSF flow and mixing. However, because we focused on the CM injection route, very few animals were injected via the LV route, and hence we cannot draw conclusions about the suitability of Figure 2b) as a representation of distribution and expression patterns for all LV injections.
Our vector:lipid complex was injected into the CSF via either the lateral ventricle or the CM as well as into rat brain parenchyma. Comparison of the light emission pattern after CSF injection versus parenchymal injection showed distinctly different results. pNDluc:MLRI complex delivery to the brain parenchyma results in signal emission that remains closely localized to the site of delivery, although by 72 hours after injection, some photon signal is seen across the midline. This suggests that vector or protein migrates from the site of injection. In contrast, vector:lipid delivery to the CSF shows much more widespread signal emission, likely reflecting bulk transport of the vector:lipid complex throughout the rat brain region. At the peak of the time course, the signal appears symmetric over the rat’s skull. However, this is probably not the case, as the signal appears to be lower on the contralateral side both before and after the peak in expression following lateral ventricle injection. The distinctly different patterns of light emission seen after parenchymal versus CSF delivery of the vector help to confirm that the CSF injections reached the target. The symmetric signals detected after injection into CSF by either route after in vivo imaging is also consistent with our previous immunohistochemical results after later ventricle injection showing relatively uniform expression in both hemispheres.11 Injection into parenchyma also demonstrated a much lower ROI count, and Figure 3 is representative of several animals that were so injected (N = 3). Figure 3 also demonstrates the well-known artifact of bioluminescence seen with in vivo imaging.12 Light emission was used as a measure of enzyme activity and assumed to correlate with the time course of luciferase gene expression and its accumulation in vivo.12 Although the time course of gene expression in vivo from the same promoter/enhancer sequences (i.e., from the same vector construct) should be independent of the gene sequence expressed, the half-life of the expressed protein will be specific. Thus, the time course of expression of a reporter gene may be slightly different than the time course of expression of a therapeutic gene of interest, depending on protein binding, stability, and degradation.18,19 From the Promega web site20 the half-life of luciferase in mammalian cells is ~3 hours, and 3.5 hours in plant cells. Due to this intermediate half-life, there is a possibility for some protein accumulation, and therefore the time course of light emission may not reflect a direct measure of the time course of gene expression. Results from in vitro work in our laboratory in NIH3T3, CHO-K1, NT2, and primary neural cells confirm this time course of luciferase activity. The above cell types in culture were transfected with the pNDluc vector and the time course of luciferase activity was followed by in vitro assay. Again, peak luciferase expression occurred ~72 hours after vector delivery.
Light emission from transfected rats declines rapidly after peak expression and is detectable only at very low levels 10–14 days after transfection, confirming the suitability of these techniques for transient gene expression in selected clinical applications. One rat that was injected in the CM was an exception to this pattern. In this rat, peak expression declined after 72 hours to ~100,000 counts/time point by day 14, but then remained stable for the next 3 weeks until the animal was euthanized at 5 weeks (Figure 4). Experiments are planned to look at genomic and plasmid DNA from this rat brain to determine a reason for the presumed episomal persistence of expression in this animal. Variation is also noted in the intensity of light intensity measured in different animals at similar time points after gene delivery. Ongoing experiments will attempt to further elucidate the in vivo control of exogenous gene expression.
Although the time course of light emissions was reproducible, the distribution of the emission depended on the site of vector:lipid injection. Animals injected in the lateral ventricle did not show as much light emission from the region of the CNS corresponding to the CM, while those injected in CM did show emission over the lateral ventricles. This result is contrary to the assumed direction of CSF flow, out of the lateral ventricle, to the third and fourth ventricles, into the basal cisterns and finally into the subarachnoid space and around the spinal cord. It is likely that CSF bulk transport and perivascular cardiac oscillations are involved in the distribution of the vector complex.21 The small volume of the rat lateral ventricles (~50 μl) when infused with a volume of lipoplex approximately twice that volume, may also affect the usual CSF flow temporarily in the region of the infusion, and may also affect uptake into the perivascular parenchyma.
Detection of luciferase at the tissue/cellular level was performed by immunohistochemical analysis of rat’s brain tissue at the time of peak in vivo expression from a rat injected in the CM with pNDluc:MLRI. The rat was euthanized 72 hours after vector delivery and the brain tissue was prepared as described (see Materials and Methods). Results from these experiments show widespread distribution of the enzyme at its peak of expression. This widespread distribution of luciferase-positive cells by immunohistochemistry of transfected brain tissue repeats previous work from our laboratory10 and correlates with the distribution of luciferase activity seen in our in vivo imaging results after CM or lateral ventricle, but not parenchymal, injections.
Widespread distribution of expressed proteins will be critical for many clinical applications that use vectors carrying therapeutic genes. The number of copies of a given gene delivered to cells and the intracellular concentration of expressed protein from that gene that is needed to provide a therapeutic effect will vary with each clinical target, but widespread uptake and expression of the vector will be critical to successful therapy. Work presented here allows a demonstration of the time course and qualitative assessment of the intensity of luciferase expression in the CNS of the intact animal after nonviral gene delivery.
Materials and Methods
Nucleic acid vectors
Our expression vector for these studies, pNDluc, carries the cDNA sequence for firefly luciferase from the firefly Photinus pyralis (pGL2I+; Promega, Madison, WI) and is described in detail elsewhere.10,11 Briefly, the vector contains the following elements: human cytomegalovirus (CMV) immediate early promoter (HCMV IE1) and CMV IE1 intron, a polylinker cloning site, and the RNA terminator/polyadenylation site derived from bovine growth hormone.22 These elements are carried on a pUC19 expression vector and the luciferase gene was subcloned into the polylinker site. pNDluc DNA for injection was prepared using the Qiagen DNA Maxi-Prep kit and protocol (Qiagen, Valencia, CA) from overnight cultures of DH5a cells (Life Technologies, Gaithersburg, MD) transformed with the plasmid.
Tissue cell culture
CHO-K1 cells for initial in vitro optimization were obtained from the American Type Culture Collection (Rockville, MD). Cells were cultured in Kaighn’s Modified F-12K Nutrient Medium supplemented with 10% fetal bovine serum (GIBCO/Invitrogen, Carlsbad, CA) using standard cell culture techniques. Cells were maintained in a 37 °C humidified incubator having a 5% CO2 atmosphere. For passage, cells were released from culture dishes with Trypsin-0.25% ethylenediaminetetraacetic acid (EDTA; GIBCO).
Lipids and formulation of lipid:nucleic acid complexes (lipoplexes)
After in vitro comparisons with several commercially available lipids, the cationic lipid that performed best was MLRI.23,24 is lipid was then used for further transfections in vitro and in vivo. Stock MLRI was synthesized by Nantz et al.23,24 and was prepared by adding chloroform to dry MLRI and mixed with dioleoylphosphatidyl-ethanolamine (50:50 DOPE) in chloroform. cDNA:lipid complexes were formed by combining the described lipid preparation with plasmid DNA to create a 3:1 lipid-to-nucleic acid charge ratio. Mixtures for in vivo experiments contained only DNA solution and lipid to minimize injected volume. Mixtures were incubated at 37 °C for 30 minutes before delivery in vivo. Slow infusion to the rat CSF required ~15 minutes after the needle localization into the lateral ventricle or CM, resulting in a total effective incubation time of 45–60 minutes.
Assay of in vitro luciferase activity
Before in vivo delivery of the pND-luc lipid lipoplex, every preparation of our vector was tested for biological activity by successful transfection of cell cultures. Luciferase activity in pNDluc-transfected cells was assayed using the Enhanced Luciferase Assay Kit and Monolight 2010 Luminometer (BD Biosciences PharMingen, San Diego, CA). At 24 hours after transfection, cells were lysed according to the manufacturer’s protocol. Briefly, complete media were aspirated from each well, the cells were washed with 1× phosphate-buffered saline, and then 200 μl of cell lysis buffer was added. Cells were incubated in the lysis buffer for 5 minutes before collecting the entire cell lysate for assay. Luciferase activity was measured for 10 seconds as relative light units using a 10–50 μl aliquot (depending on signal intensity) of the cell lysate. Based on previous work we know that the peak after DNA transfection in vitro occurs at 48 to 72 hours.
In vivo delivery and transfection
After confirming robust luciferase activity in vitro, rats were anesthetized with isoflurane in an induction chamber (Stoelting, Woodale, IL). As described previously,14,13 they were then given an intraperitoneal anesthetic injection and mounted in a stereotaxic frame (Stoelting). Anesthesia was maintained in spontaneously breathing animal subjects (male Sprague Dawley rats, Charles River Laboratories, MA) with inhaled isoflurane through a nose cone with supplemental O2. A 24-gauge spinal needle was connected to a 250-μl Hamilton syringe mounted in a syringe pump via PE-20 tubing. pNDluc:MLRI complex (lipoplex) was then delivered to either the lateral ventricle or CM of the animal (detailed in the following text). These two sites of injection were used to identify differences in luciferase expression and distribution patterns that may be site specific.
For lateral ventricle delivery, the animal was secured in a stereotaxic frame as described, the skull was exposed after sterile prep, and a burr hole was made over the injection coordinates 0.9–1.0 mm posterior, 1.5 mm lateral of midline relative to Bregma. The spinal needle was advanced to a depth of 3.5–4.0 mm. 50 μg/kg of DNA vector encoding firefly luciferase was complexed with MLRI as described earlier and the formulated lipid:DNA complex was slowly infused over 10–15 minutes into the lateral ventricle. For CM delivery, the animal was again secured in the stereotaxic frame, skin incision was made over the Atlanto-occipital joint after sterile prep, and the muscle overlying the joint was moved by blunt dissection to expose the ligaments over the cranial suture. The spinal needle connected to the Hamilton syringe was advanced into the ligament overlying the suture until CSF was obtained. Lipid:DNA complex, prepared as described, was infused over 10–15 minutes.
After completion of the infusion to either lateral ventricle or CM, the needle used for delivery was kept in place for 10 minutes before withdrawal. The surgical site was then sutured; the animal was removed from the stereotaxic frame and allowed to recover. Animals were closely monitored for signs of discomfort, toxicity, or neurologic injury. On rare occasions, an animal died immediately after CM injection, probably as a result of inadvertent spinal cord or brainstem injection.
In vivo luciferase imaging
The Xenogen IVIS 100 was used to image the animals after vector delivery. An anesthetized animal was placed in the light tight imaging box. A light image (photograph) of the animal was taken, then an image of the photons of emitted light was collected by the cooled charge-coupled device camera of the IVIS 100 system over a period of 1 minute using medium binning. Our data acquisition time is comparable to that used for in vivo imaging in several reported experiments that used mice as animal models,16,17,25 with a range of 10 seconds to 2 minutes, adjusted so as to avoid pixel saturation. We imaged the anesthetized animal before the luciferase substrate, luciferin, was given to obtain a background level of light emission. Next, 150 mg/kg luciferin was injected IV and luciferase activity followed over time by light emission detection. Approximately 150 mg/kg of luciferin was our chosen initial dose of substrate as it is recommended by Xenogen and is also the most common dose reported in the literature,16,17,25,26 albeit for intraperitoneal injection. We varied luciferin dose in additional experiments, not reported here, to arrive at a balance between luciferase signal, luciferin expense, and luciferin buffer salt load to the animals. We found that the above dose of the luciferin was optimal, but that the substrate needed to be dissolved in sterile water to avoid delivering a salt load to the animal that could be fatal.
The peak and duration of luciferase activity after IV injection of luciferin were determined by IVIS imaging of animals every 2–5 minutes, with a constant image acquisition time of 1 minute, until a clear peak of light emission was detected. Because there was some variability in the time of peak luciferase activity, multiple IVIS images were taken after each IV luciferin injection in all experiments. Anatomical localization was obtained by the superposition of the luminescent image over the light image. Each image (i.e., time point) is thus a composite of a photograph of the animal and the acquired luminescent image. ROIs were created using LivingImage software (Xenogen) on a computer that was dedicated to the IVIS system for data acquisition. These ROIs identify the location of the most intense signal in the CNS after delivery of the substrate. An identical ROI (in size and shape) was then created over the luminescent image of the rat before substrate delivery and photon emission data was measured from this ROI. The photon counts in this control ROI were considered background counts and were subtracted from the experimental data.
To quantify the time course of gene expression, the time of peak luciferase activity was first determined after each luciferase injection at each measurement interval, usually 24 hours. Using the Living Image software (Xenogen), ROIs were created over areas of intense light emission and the photons emitted at each time point were quantified. Every 24 hours after injection of the vector, the rats were again IV injected with luciferin, and enzyme activity was followed by IVIS imaging until the peak of expression was determined, then every several days until light emission was no longer detected above background.
Tissue preparation for the reporter enzyme localization and immunohistochemistry
Two animals were imaged on the day of expected peak luciferase expression (72 hours after lipoplex injection) to confirm high-level luciferase expression. The animals were then deeply anesthetized, the left ventricle was catheterized, and the animals were perfused with chilled phosphate-buffered saline and then with precooled freshly made 4% phosphate-buffered saline–buffered paraformaldehyde. Brains were rapidly dissected, frozen, and processed as previously described.10,11
Acknowledgments
We gratefully acknowledge the assistance of the University of Pennsylvania Core Imaging Facility, Wadik El-Diery, Director, and Yvette Liu.
References
- 1.Li SD, Huang L. Gene therapy progress and prospects: non-viral gene therapy by systemic delivery. Gene The. 2006;13:1313–1319. doi: 10.1038/sj.gt.3302838. [DOI] [PubMed] [Google Scholar]
- 2.Gao X, Kim K, Liu D. Nonviral gene delivery, what we know and what is next. AAPS J. 2007;9:E92–E104. doi: 10.1208/aapsj0901009. [DOI] [PMC free article] [PubMed] [Google Scholar]
- 3.Flotte T. Gene therapy: the first two decades and the current state-of-the-art. J Cell Physiol. 2007;213:301–305. doi: 10.1002/jcp.21173. [DOI] [PubMed] [Google Scholar]
- 4.Nienhuis AW, Dunbar CE, Sorrentino BP. Genotoxicity of retroviral integration in hematopoietic cells. Mol Ther. 2006;13:1031–1049. doi: 10.1016/j.ymthe.2006.03.001. [DOI] [PubMed] [Google Scholar]
- 5.Hacein-Bey-Abina S, Von Kalle C, Schmidt M, McCormack MP, Wulffraat N, Leboulch P, et al. LMO2-associated clonal T cell proliferation in two patients after gene therapy for SCID-X1. Science. 2003;302:415–419. doi: 10.1126/science.1088547. [DOI] [PubMed] [Google Scholar]
- 6.Woods N, Bottero V, Schmidt M, von Kalle C, Verma I. Gene Therapy: therapeutic gene causing lymphoma. Nature. 2006;440:1123. doi: 10.1038/4401123a. [DOI] [PubMed] [Google Scholar]
- 7.Oh S, Pluhar GE, McNeil EA, Kroeger KM, Liu C, Castro MG, et al. Efficacy of nonviral gene transfer in the canine brain. J Neurosurg. 2007;107:136–144. doi: 10.3171/JNS-07/07/0136. [DOI] [PMC free article] [PubMed] [Google Scholar]
- 8.Ohlfest JR, Freese AB, Largaespada DA. Nonviral vectors for cancer gene therapy: prospects for integrating vectors and combination therapies. Curr Gene Ther. 2005;5:629–641. doi: 10.2174/156652305774964749. [DOI] [PubMed] [Google Scholar]
- 9.Niedzinski EJ, Fujii SK, Lizarzaburu ME, Hecker JG, Nantz MH. A versatile linker for nontoxic polyamine-mediated DNA transfection. Mol Ther. 2002;6:279–286. doi: 10.1006/mthe.2002.0645. [DOI] [PubMed] [Google Scholar]
- 10.Hecker JG, Hall LL, Irion VR. Non-viral gene delivery to the lateral ventricles in rat brain: initial evidence for widespread distribution and expression in the central nervous system. Mol Ther. 2001;3:375–384. doi: 10.1006/mthe.2001.0272. [DOI] [PubMed] [Google Scholar]
- 11.Anderson D, Hall LL, Ayyalapu A, Irion VR, Nantz MH, Hecker JG. Stability of mRNA/cationic lipid lipoplexes in human and rat cerebrospinal fluid: methods and evidence for non-viral mRNA gene delivery to the CNS. Hum Gene Ther. 2003;14:1–12. doi: 10.1089/10430340360535751. [DOI] [PubMed] [Google Scholar]
- 12.Josserand V, Texier-Nogues I, Huber P, Favrot M-C, Coll J-L. Non-invasive in vivo optical imaging of the lacZ and luc gene expression in mice. Gene Ther. 2007;14:1587–1593. doi: 10.1038/sj.gt.3303028. [DOI] [PubMed] [Google Scholar]
- 13.Rehemtulla A, Hall DE, Stegman LD, Prasad U, Chen G, Bhojani MS, et al. Molecular imaging of gene expression and efficacy following adenoviral-mediated brain tumor gene therapy. Mol Imaging. 2002;1:43–55. doi: 10.1162/15353500200200005. [DOI] [PubMed] [Google Scholar]
- 14.Pineda JR, Akerud P, Urban N, Badimon L, Arenas E, Alberch J, et al. Neuroprotection by GDNF-secreting stem cells in a Huntington’s disease model: optical neuroimage tracking of brain-grafted cells. Gene Ther. 2007;14:118–128. doi: 10.1038/sj.gt.3302847. [DOI] [PubMed] [Google Scholar]
- 15.Bhaumik S, Gambhir SS. Optical imaging of Renilla luciferase reporter gene expression in living mice. Proc Natl Acad Sci USA. 2002;99:377–382. doi: 10.1073/pnas.012611099. [DOI] [PMC free article] [PubMed] [Google Scholar]
- 16.Paroo Z, Bollinger RA, Braasch DA, Richer E, Corey DR, Anlich PP, et al. Validating bioluminescence imaging as a high-throughput, quantitative modality for assessing tumor burden. Mol Imaging. 2004;3:117–24. doi: 10.1162/15353500200403172. [DOI] [PubMed] [Google Scholar]
- 17.Rettig GR, McAnuff M, Liu D, Kim JS, Rice KG. Quantitative bioluminescence imaging of transgene expression in vivo. Anal Biochem. 2006;355:90–94. doi: 10.1016/j.ab.2006.04.026. [DOI] [PubMed] [Google Scholar]
- 18.Miloud T, Henrich C, Hammerling GJ. Quantitative comparison of click beetle and firefly luciferases for in vivo bioluminescence imaging. J Biomed Opt. 2007;12:054018. doi: 10.1117/1.2800386. [DOI] [PubMed] [Google Scholar]
- 19.Tannous BA, Kim D-E, Fernandez JL, Weissleder R, Breakefield XO. Codon-optimized Gaussia luciferase cDNA for mammalian gene expression in culture and in vivo. Mol Ther. 2005;11:435–445. doi: 10.1016/j.ymthe.2004.10.016. [DOI] [PubMed] [Google Scholar]
- 20.Promega Corporation. Luciferase Assay System and Reporter Vectors. Promega Corporation. 2007 < www.promega.com>.
- 21.Hadaczek P, Yamashita Y, Mirek H, Tamas L, Bohn MC, Noble C, et al. The “perivascular pump” driven by arterial pulsation is a powerful mechanism for the distribution of therapeutic molecules within the brain. Mol Ther. 2006;14:69–78. doi: 10.1016/j.ymthe.2006.02.018. [DOI] [PMC free article] [PubMed] [Google Scholar]
- 22.Chapman B, Thayer R, Vincent K, Haigwood N. Effect of intron A from human cytomegalovirus (Towne) immediate early gene on heterologous expression in mammalian cells. Nucleic Acids Res. 1991;19:3979–3986. doi: 10.1093/nar/19.14.3979. [DOI] [PMC free article] [PubMed] [Google Scholar]
- 23.Bennett M, Malone R, Nantz M. A flexible approach to synthetic lipid ammonium salts for polynucleotide transfection. Tetrahedron Lett. 1995;36:2207–2210. [Google Scholar]
- 24.Nantz M, Bennett M, Malone R. US patent 5,527,928. 1996. Cationic transport reagents. [Google Scholar]
- 25.Burgos JS, Rosol M, Moats RA, Khankaldyyan V, Kohn DB, Nelson MD, et al. Time course of bioluminescent signal in orthotopic and heterotopic brain tumors in nude mice. Biotechniques. 2003;34:1184–1188. doi: 10.2144/03346st01. [DOI] [PubMed] [Google Scholar]
- 26.Lee KH, Byun SS, Paik JY, Lee SY, Song SH, Choe YS, et al. Cell uptake and tissue distribution of radioiodine labeled D-luciferin: implications for luciferase based gene imaging. Nucl Med Commun. 2003;24:1003–1009. doi: 10.1097/00006231-200309000-00009. [DOI] [PubMed] [Google Scholar]