Abstract
Cyanobacteria perceive and move (phototax) in response to blue light. In this study, we demonstrate that the PixD blue light-sensing using FAD (BLUF) photoreceptor that governs this response undergoes changes in oligomerization state upon illumination. Under dark conditions we observed that PixD forms a large molecular weight complex with another protein called PixE. Stoicheometric analyses, coupled with sedimentation equilibrium and size exclusion chromatography, demonstrates that PixE drives aggregation of PixD dimers into a stable PixD10—PixE5 complex under dark conditions. Illumination of a flavin chromophore in PixD destabilizes the PixD10–PixE5 complex into monomers of PixE and dimers of PixD. A crystallographic structure of PixD, coupled with Gibbs free energy calculation between interacting faces of PixD, lends to a model in which a light induces a conformational change in a critical PixD-interfacing loop that results in destabilization of the PixD10–PixE5 complex.
Keywords: flavin chromophore, phototaxis, synechocystis
A recently described family of blue light-sensing photoreceptors using FAD (BLUF) has drawn attention for its ability to convert photochemical energy into a diverse set of cellular responses. The first identified BLUF protein was AppA from Rhodobacter sphaeroides that regulates photosystem synthesis in response to blue light and oxygen tension (1–4). Biochemical and structural studies with AppA have led to a generalized mechanism of light perception among BLUF proteins that involves light-stimulated hydrogen-bond rearrangement between the isocyclic ring of flavin and the peptide side chain (5–9). Accompanying the hydrogen-bond rearrangement is a conformational change of the fifth β-strand and a loop between the fourth and fifth β-strands (10–15).
What is not yet clear is how the observed light mediates hydrogen-bond rearrangements and tertiary structural changes in the BLUF domain control activity of an output domain. Among the large family of BLUF-containing proteins, there is considerable variability of different output domains, many of which have similarity to characterized enzymes. For example, PAC protein from Euglena has a BLUF domain located adjacent to an adenylate cyclase domain (16). Adenylate cyclase activity is controlled by light excitation of the BLUF-bound flavin through an undefined mechanism. Indeed, it remains to be solved how any BLUF domain controls an output signal.
In addition to AppA, another extensively studied BLUF protein is PixD (also called Slr1694) from the cyanobacterium Synechocystis sp. PCC 6803 (11, 17). PixD is involved in regulating phototactic motility of Synechocystis in response to blue light (18). Unlike most BLUF proteins that contain a large effector output domain, PixD only has a short ≈50-aa C-terminal effector domain that does not have any discernable features. Consequently, it has been proposed that PixD transfers a light signal by interacting with a downstream protein (20).
Recently, a yeast-two-hybrid screen has identified a PatA-like two-component response regulator called PixE (Slr1693) that interacts with PixD in vivo (17, 21). Loci coding for these two proteins are also located adjacent to each other in the Synechocystis genome. In this study, we have characterized the interaction between PixD and PixE in vitro and demonstrate that PixE drives oligomerization of PixD from a dimer into a decamer. We further show that light absorption by PixD promotes disruption of a higher-ordered PixD10–PixE5 complex into PixE monomers and PixD dimers. Analysis of PixD subunit interfaces provides a molecular model on how light absorption by the PixD-bound flavin affects stability of the PixD10–PixE5 complex.
Results
PixD and PixE Form a Complex in the Dark.
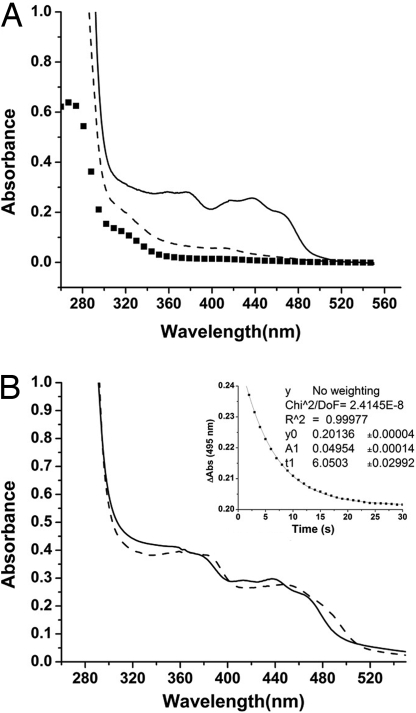
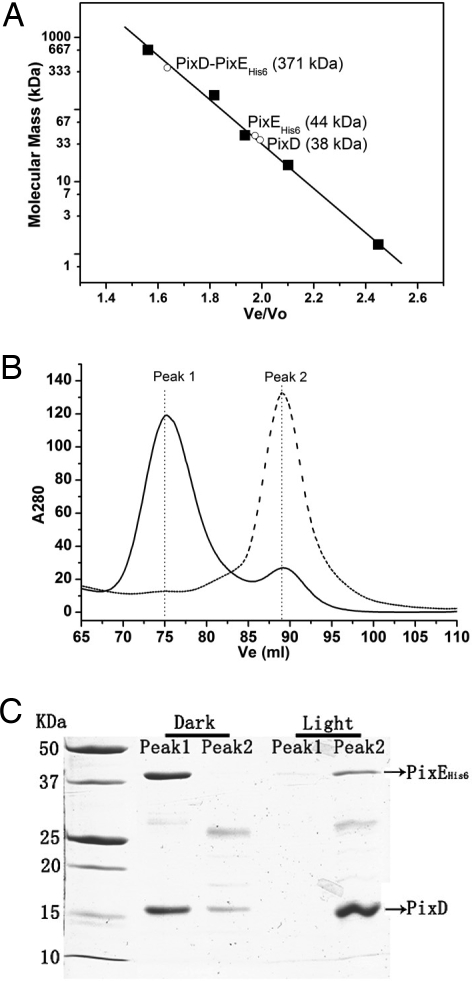
We directly accessed interactions between PixD and PixE by coexpressing both proteins in Escherichia coli from a single plasmid with PixD expressed as a tagless protein and PixE containing an amino terminus hexahistidine tag (designated PixEHis-6). These two proteins copurified under Ni2+ affinity chromatography conditions in the dark as assayed by the presence of an intense yellow color that undergoes a light-induced spectral shift that is characteristic of the flavin containing PixD (Fig. 1A, solid line). There are also major bands at ≈40 and 18 kDa corresponding to PixEHis-6 and PixD, respectively, when analyzed by SDS/PAGE analysis (Fig. 2C). Because only PixE contains an affinity tag, the presence of PixD after affinity purification indicates that there is a significant association between these two proteins. Interestingly, there was no copurification of PixD with PixEHis-6 when purification was performed in the presence of ≈997 μmol·m−2·s−1 white light (Fig. 1A, dashed line). This finding indicates that light exposure disrupts the stable interaction of PixD with PixEHis-6.
Fig. 1.
Absorption spectra and kinetics of copurified PixEHis-6–PixD. Solution containing both PixEHis-6 and PixD were bound to a nickel column and washed of unbound proteins under dark or light conditions. (A) Bound proteins were then eluted with imidazole under dark or light conditions and subjected to spectroscopic analysis. The solid line represents elution under dark conditions, and the dashed line is elution under light. The spectrum of PixEHis-6 alone is represented by squares. (B) Spectroscopic analysis of the dark-eluted PixEHis-6–PixD complex that exhibits a characteristic 10-nm light shift of the spectrum upon illumination. The solid line is a spectrum of dark-adapted protein, and the dashed spectrum is after white light illumination. (Inset) Decay kinetics of the PixEHis-6–PixD complex that exhibits a τ1/2 recovery to the ground state at ≈6 s, which is similar to the 5-s half-time of isolated PixD (11).
Fig. 2.
Gel filtration profile of purified PixD, PixE, and the PixD–PixEHis-6 complex under dark and light conditions. (A) Graph of molecular mass vs. elution volume (Ve/Vo) of molecular mass standards from Bio-Rad (■). The observed Ve/Vo of isolated PixD, PixE and the PixD–PixEHis-6 complex in the dark are shown as ○ with the calculated molecular mass indicated in brackets in kDa. (B) Dark Ni2+ affinity-purified PixD–PixEHis-6 complex was divided into two equal portions and then assayed for oligomerization state with Superose 6 10/300 gel filtration chromatography under dark (solid line) or illuminated conditions (dashed line). (C) Fractions from peaks 1 and 2 in B were analyzed by SDS/PAGE and stained with Coomassie brilliant blue G-250.
An interaction between PixD and PixEHis-6 was also assayed by performing Superose 6 size exclusion chromatography under dark and white light-illuminated conditions. When isolated PixD was chromatographed alone on Superose 6 the protein eluted with an observed molecular mass of ≈38 kDa (Fig. 2A). The same elution profile was observed under dark and white light conditions, which is similar to the ≈40-kDa size of PixD as assayed by similar chromatographic analysis by Okajima et al. (21). This mass corresponds to a PixD dimer as the calculated mass from the PixD peptide sequence is 17.6 kDa. Similar analysis was undertaken with isolated PixEHis-6, which gave a chromatographically observed molecular mass of ≈44 kDa under both dark and light conditions (Fig. 2A). This value is close to the calculated 43.7-kDa mass of PixEHis-6, indicating that purified PixEHis-6 exists in solution as a monomer. However, when PixD and PixEHis-6 are cochromatographed under dark conditions there are two peaks (Fig. 2B, solid line). The major peak 1 at fraction 75 ml corresponds to a molecular mass of ≈371 kDa whereas the minor peak 2 at fraction 89 ml corresponds to a mass of ≈40 kDa. SDS/PAGE analysis demonstrates that the high molecular mass peak 1 is comprised of both PixD and PixE (Fig. 2C). In contrast, when PixD and PixEHis-6 are exposed to white light and cochromatographed under illuminated conditions the 371-kDa peak 1 is nearly absent coupled with enhanced elution of the 40-kDa peak 2 (Fig. 2B, dashed line). These results indicate that a PixD–PixE complex is only stable under dark conditions.
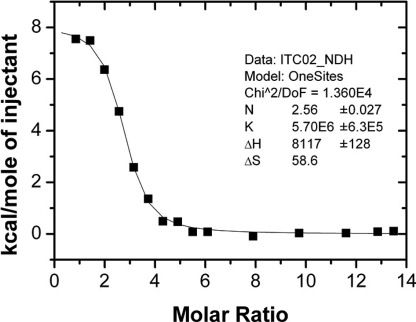
We also assayed for the strength of the interactions between PixD and PixE by using isothermal titration calorimetry with PixD as titrant and PixEHis-6 as cell solution (Fig. 3). The binding between PixD and PixEHis-6 was observed to be an endothermic reaction based on loss of heat as PixD titrant is increased. The data fitted to a single-binding site model giving a binding constant (Ka) of 5.70 ± 0.63 × 10⁶ M−1, an entropy change (ΔS) of 0.0586 kcal/(mol·K), and an enthalpy change (ΔH) of 8.12 ± 0.13 kcal/mol (Fig. 3). The stoichiometry (N) was fitted from the molar ratio of the inflection point of the titration curve with a value of ≈2.56 PixD per 1.0 PixE.
Fig. 3.
Isothermal titration calorimetry data fitted by using a single-site binding model for PixD titrated into PixEHis-6. The fitted parameters are: Ka binding constant = 5.70 ± 0.63 × 10⁶ M−1, n = 2.56 ± 0.027, ΔH = 8.12 ± 0.13 kcal/mol, and ΔS = 0.0586 kcal/(mol·K).
Molecular Mass and Stoichiometric Analysis of the PixD–PixEHis-6 Complex.
Several different molecular masses have been reported for PixD in solution as based on size exclusion chromatography. Our observed molecular mass for PixD of ≈38 kDa (Fig. 2A) is similar to the 40-kDa size as reported by Okajima et al. (21), which corresponds to a dimer of PixD. These values are slightly lower than a 60-kDa value for PixD that was reported by Masuda et al. (11), which would correspond to a trimer or tetramer. These inconsistencies are not surprising considering how changes in Stokes radius can significantly affect retention time on gel filtration chromatography and that even a small deviation of the retention time can result in a very different calculated molecular mass. To obtain a more accurate mass determination, we used sedimentation equilibrium that provides a soluble mass calculation that is independent of molecule shape. Using sedimentation equilibrium analyses [supporting information (SI) Fig. S1] we observed a fitted mass for PixD in solution of 34.8 kDa with a standard deviation (δ) of 1.6 kDa. This value is within error to the 35.2-kDa mass of a PixD dimer as deduced from amino acid composition. Similar analysis of the PixD–PixEHis-6 complex provided a derived mass of 391.4 kDa (δ = 5.7 kDa).
Several possible combinations of PixD and PixEHis-6 can give rise to a complex that has a calculated molecular mass near the sedimentation equilibrium observed 391.4 kDa mass. To estimate the molar ratio between PixD and PixEHis-6 in the complex, we analyzed the Coomassie blue-stained band intensity of PixD and PixE from replicate isolated PixD–PixEHis-6 complex that was subjected to SDS/PAGE separation at differing protein levels (Fig. 2C). The observed band intensity of PixD and PixEHis-6 divided by calculated molecular mass of PixD (17.6 kDa) and PixE (43.7 kDa), respectively, provides a molar ratio of 1.9 (±0.1) PixD per PixE in the complex, which is similar to the 2.56 PixD per PixE as calculated from isothermal titration calorimetry. To fit the observed sedimentation equilibrium-derived molecular mass of 391.4 kDa for the PixD–PixEHis-6 complex with a 2:1 PixD to PixE molar ratio, we can assign a complex comprised of 10 subunits of PixD with 5 subunits of PixE. Such a complex gives a theoretical molecular mass of 394.7 kDa that is very close to the sedimentation equilibrium-observed 391.4 kDa (±5.7 kDa) mass of the complex. This finding is also in good agreement with the crystal structure of PixD that forms a 10-subunit complex comprised of two stacked pentameric rings (10).
Protein Interfaces, Surfaces, and Assemblies (PISA) Analysis.
As discussed above, isolated PixD primarily exists in solution as a dimer that is capable of oligmerizing into a higher-ordered decamer in the presence of PixE. A PixD decamer comprised of two stacked pentameric rings is actually observed in the PixD crystal structure that does not contain PixE (Fig. 4) (10). Presumably, the PixD–PixE complex also forms a similar pair of pentameric PixD rings that are stabilized by PixE, and that in the absence of PixE, crystal packing drives conversion of PixD dimers into the observed crystal structure of stacked pentameric rings. In fact, we did observe higher oligomerization forms than dimer of PixD in crystallization buffer (data not shown) (10).
Fig. 4.
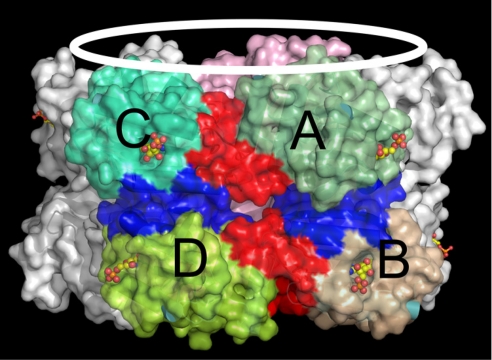
Probable quaternary dimers of PixD as based on the PixD crystal structure. The flavin molecules are represented in a stick–sphere model. Within the same asymmetry unit, the PixD dimers could be either between subunits from separate rings indicated as [AB] or between subunits within the same ring indicated as [AC]. The interfacing residues are colored red for [AC] type dimers or blue for [AB] type dimers. [AB]-interfacing residues include: I78, Y63, N60, C80, Y4, and Q68 for subunit A and Y4, H64, Q76, I77, I78, and C80 for subunit B. [AC]-interfacing residues include: I111, K112, Y113, S114, K120, D125, E127, and Q128 for subunit A and E55, I83, K84, K85, K86, and K84 for subunit C.
To obtain information on the type of interactions that may exist between subunits of PixD dimers, we performed PISA analysis (22). This analysis calculates Gibbs free energy values between subunits of PixD as based on solvation energy, entropy change, and contacts (e.g., hydrogen bond and salt bridge) that are present in the PixD crystal structure (22). Interactions that could stabilize a dimer in solution presumably occur either between neighboring subunits in the same ring (for example, subunits A and C in Fig. 4) or between subunits in different rings (for example, subunits A and B in Fig. 4). The major criterion for prediction of oligomeric association as based on PISA analysis is dissociation energy (ΔGdiss) with a more positive ΔGdiss, indicating a more stable assembly. As predicted by PISA analysis (Table 1), the formation of dimers between subunits in different stacked rings ([AB]) is more favorable than that observed between neighboring subunits in the same pentameric ring ([AC]), indicating that an [AB] dimer may exist in solution. This conclusion will ultimately need to be supported by a solution structure of PixD dimers as the 0.6–0.8 kcal/mol ΔGdiss values for the [AB] dimers indicate borderline stability. Detailed analyses of these two dimer forms are presented in Discussion.
Table 1.
Gibbs free energy values and complexation significance scores of interface regions on dimers in PixD
| Protein Data Bank ID code | Composition* | ΔGdiss,kcal/mol† | CSS‡ | Buried area, Å2 |
|---|---|---|---|---|
| 2HFN | [AB] | 0.8 | 0.378 | 627.6 |
| [AC] | \ | 0.000 | 539.2 | |
| 2HFO | [AB] | 0.6 | 0.038 | 675.5 |
| [AC] | \ | 0.000 | 538.2 |
*Monomeric units found in the interface. [AB] type interface is formed between two units from two stacked pentameric rings or [AC] type interface forms between two units within the same ring (see Fig. 4).
†Change in free energy associated with the assembly dissociation (ΔGdiss > 0 means the assembly is thermodynamically stable). Slashes indicate that this assembly is not recommended by PISA.
‡Complexation Significance Scores (CSS) are from 0 to 1 in which 1 indicates the most probable interface for a stable assembly.
Discussion
In this study we purified a stable PixD–PixE complex under dark conditions and demonstrated that it becomes destabilized when exposed to light (Figs. 1A and 2B). We also observed that isolated PixD exists as a dimer in solution and that PixE promotes oligomerization of PixD dimers into a larger complex. Based on the ≈2:1 PixD/PixE ratio, and a 391.4-kDa mass of the PixD–PixE complex, we can assign 10 subunits of PixD with 5 subunits of PixE. Furthermore, because crystal packing drives PixD dimers into a 10-subunit structure that is comprised of two stacked pentameric rings (10), we propose that PixE is responsible for in vivo dark conversion of PixD dimers into a similar structure of stacked pentameric rings.
PISA analysis of the PixD crystal structure suggests that there are two faces of PixD that can form homodimer interactions (Fig. 4). The [AB] region of interaction exists between two subunits from different pentameric rings as indicated in Fig. 4. A second region of interaction exists between two subunits from the same pentameric ring that is shown in Fig. 4 as the [AC] interaction. The [AB] dimer likely represents the stable PixD dimer in solution as based on several lines of evidence. First, ΔGdiss and Complexation Significance Scores of the [AB] dimer interface are more favorable than that of the [AC] form (Table 1). Second, five pairs of [AB] dimers can readily oligomerize to form a pair of stacked pentamer rings as observed in the PixD crystal structure. This is contrasted by [AC] dimers that would first have to form separate pentameric rings that would then have to subsequently interact to form a decamer (Fig. 4). Finally, the short BLUF protein, BlrB from R. sphaeroides, adapts a very similar [AB] dimer form in its crystal structure (Protein Data Bank ID code 2BYC) (23). Collectively, these results suggest that PixD exists in solution as a stable [AB] dimer that oligomerizes in the dark with the help of PixE to form a stacked set of pentameric rings (Fig. 4).
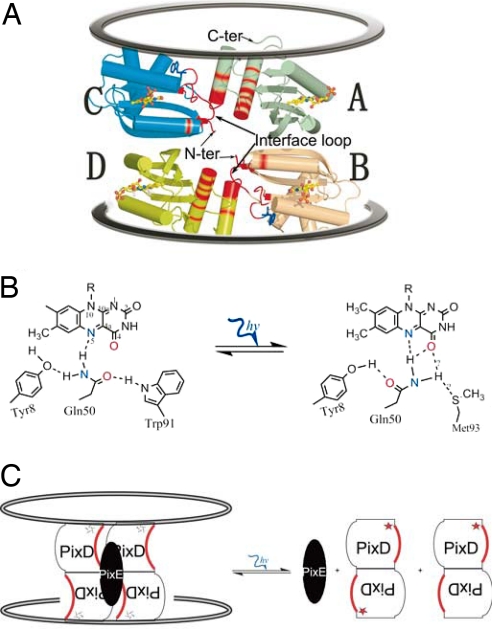
How does light excitation of PixD result in disruption of the PixD10–PixE5 complex? Highlighted in red in Fig. 5A are the interfacing residues that exist between two sets of [AB] dimers. The main interfacing residues occur along a loop (Ile-83–Val-90) located between the fourth and fifth β-strands, the start of the fifth β-strand (Trp-91–Met-93), and two C-terminal helices. At the joint between this loop and the fifth β-strand are highly conserved residues Trp-91 and Met-93 that undergo major conformational changes in response to light as suggested by crystallographic analysis of several BLUF proteins, FTIR, and static fluorescence studies (10, 11, 13, 24) (Fig. 5B). Considering that this loop, the Trp-91 joint, and the fifth β-strand comprise a significant portion of the [AB] dimer–dimer interfacing residues, it is reasonable to speculate that a light-induced conformational change of this region destabilizes dimer–dimer interactions along the [AB] interface that ultimately leads to disassembly of the PixD10–PixE5 complex when light is excited (Fig. 5C).
Fig. 5.
Critical interface contacts in an output loop between the fourth and fifth β-strands of PixD that undergoes significant movement upon light excitation. (A) Residues contributing to interface contacts are highlighted in red. Trp-91 is represented by a blue stick model and flavin by a yellow stick-sphere model. (B) The light signal induces the hydrogen-bond alteration around flavin, causing the flip of the Gln-50 side chain and the position switch between Trp-91 and Met-93. (C) Breaking the hydrogen bond between Trp-91 and Gln-50 transforms the light signal into the structural change around the Trp-91 (star) vicinity, including the loop that consists of the PixD dimer–dimer interface. As a result, the PixD decamer is broken into dimers and the PixD–PixE complex is disassembled.
It is likely that light-induced disassembly of the PixD–PixE complex constitutes the “output signal” that regulates a signal transduction pathway that controls motility of Synechocystis. Presumably changes in the oligomerization state of these proteins affect the interaction of either PixD or PixE with one or more downstream proteins that directly control the pillis-based twitching motility of this species. Identification of additional downstream partners, and how they interact with an assembled or disassembled PixD–PixE complex, should unravel additional details of phototaxis in this species.
Materials and Methods
Expression Plasmids Construction.
The coding segment of PixE was amplified from genomic DNA by PCR amplification using primers: 5′-GCGGCCATATGCATCATCATCATCATCACATGAGCAATTCAGTTTTGTCCAC-3′ and 5′-GCGGCGTCGACTCAGGAGTTGGTTTTATTGGTG-3′ (the hexahistidine tag coding region is underlined). The fragment was then cloned into the NdeI/SalI-digested pET29a vector (Novagen), resulting in an N-terminal hexahistidine tag before the pixE start codon to construct the recombinant peptide PixEHis-6. pCDFDuet-1 vector from Novagen was used to construct the plasmid pCDFDuet–PixDPixE to coexpress PixD and PixEHis-6. An NdeI/XhoI fragment of PixEHis-6 was first subcloned into the NdeI/XhoI sites of the vector pCDFDuet-1 to construct the plasmid pCDFDuet-PixEHis-6. The gene encoding PixD was then subcloned into the NcoI/EcoRI sites of pCDFDuet–PixEHis-6, resulting in the plasmid pDuet–PixDPixEHis-6, which coexpresses tagless PixD and hexahistidine-tagged PixE. To use the NcoI site during plasmid construction, the internal NcoI site of pixD was eliminated by constructing a silent mutation at codon 123 (GCG to GCC).
Protein Expression and Purification.
All proteins were expressed in Escherichia coli Tuner (DE3) cells. PixD alone was purified by chitin affinity chromatography (New England Biolabs) followed by gel filtration chromatography on a Superose 12 10/300 GL or Superose 6 10/300 GL column (GE Healthcare) in 0.02 M Tris·HCl (pH 8.0) and 0.1 M NaCl as described (10, 11). To coexpress PixD and PixEHis-6, 2 liters of cells were grown by shaking in Terrific Broth (TB) at 37°C until OD600 reached 0.6. The cells were chilled to 23°C before induction with 0.5 mM isopropyl β-d-thiogalactopyranoside at 23°C for 16 h. Cells were harvested by centrifugation (3,951 × g, 10 min), resuspended in binding buffer [0.05 M sodium phosphate (pH 8.0), 0.3 M NaCl, 10% glycerol, and 0.02 M imidazole; 10 ml of buffer per g of cell pellet], lysed at 4°C by using a continuous flow microfluidizer (Microfluidics) and then clarified by centrifugation at 31,270 × g for 30 min at 4°C. The supernatant fraction was then incubated with 10 ml of Ni2+-charged His6-tag binding resin (Novagen) at 4°C for 1 h with gentle shaking. The mixture was then loaded onto a 30-ml Econo-Pac gravity flow chromatography column (Bio-Rad). The column was washed extensively with 40 resin volumes of washing buffer (0.06 M imidazole in binding buffer) before bound protein was eluted with 12 ml of elution buffer (0.25 M imidazole in binding buffer; 1.5 ml/fraction × 8 fractions). All these steps were performed under dark or green safety light (LED, 525 ± 20 nm).
The elution from the Ni2+ column was subjected to Superose 6 10/300 GL chromatography with 0.02 M Tris (pH 8.0) and 0.1 M NaCl as a running buffer. An equal amount (≈1 mg/ml × 1.5 ml) of elution was used for the gel filtration experiment in the dark or with continuous white fluorescent light illumination (≈210 μmol·m−2·s−1). The protein from gel filtration was then concentrated to ≈1 mg/ml by using an Amicon Ultra centrifugal filter (Millipore) for subsequent experiments (analytical ultracentrifugation, spectroscopy, SDS/PAGE, etc.). Protein concentration was measured by using Advanced Protein Assay reagent (ADV01; Cytoskeleton). Molecular mass standards used for gel filtration chromatography were thyroglobulin (670 kDa), γ-globulin (158 kDa), ovalbumin (44 kDa), myoglobin (17 kDa), and vitamin B12 (1.35 kDa). The SDS/PAGE gel was stained with Coomassie blue G-250, and the band intensities were measured with the Odyssey infrared imaging system to estimate the molar ratio between PixD and PixE from the isolated PixD–PixE complex. Values were obtained by using varying dilutions of several independent isolates of the PixD–PixE complex. Validity of this analysis was also established by undertaking parallel analysis of the PpsR–AppA protein complex that is known to be present in a 2:1 PpsR/AppA ratio (2.0 ± 0.2 as measured) (2).
Analytical Ultracentrifugation.
Proteins from gel filtration chromatography were subjected to sedimentation equilibrium experiments using a Beckman XL-A Ultracentrifuge with an AN-Ti-60 rotor at 4°C. Multiple protein concentrations with OD280 ranging from 0.3 to 0.7 combined with at least three rotor speeds optimized for the expected molecular mass were used for each sedimentation equilibrium experiment. Absorbance data were collected at multiple wavelengths (≈230–500 nm), optimized for individual protein concentration, and recorded in a step model with a 0.001-cm radial step size and 50-point averages. All absorbance data that were recorded at multiple wavelengths were normalized to 280 nm. The extinction coefficient used for normalization for PixD was 1.3 × 10⁴ M−1·cm−1 calculated from multiple wavelength scans on different protein concentrations by using the global extinction fit function of UltraScan (25). No normalization of the PixD–PixE complex was undertaken as a single wavelength at 270 nm was used. The partial specific volume (0.730 ml/g for the PixD–PixE complex and 0.725 ml/g for PixD; both at 4°C) was calculated based on the amino acid composition embedded in UltraScan (25, 26). The UltraScan package was also used for global equilibrium fitting and statistics analysis.
Isothermal Titration Calorimetry.
Isothermal titration calorimetry experiments were performed at 25°C with a VP-ITC calorimeter (MicroCal). PixEHis-6 was used as cell solution at 17.6 μM with PixD at 186 μM as a titrant. PixD was injected at 4- to 10-μl volumes into a cell that contained 1.4 ml of PixEHis-6 to a maximum volume of 300 μl. Injections occurred at intervals of 10 min to allow complete equilibration between injections. The data were processed as a one-site binding model by using the Origin software package provided by MicroCal.
Supplementary Material
Acknowledgments.
We thank Vladimira Dragnea and Young-Ho Chung for technical advice. This study was funded by National Institutes of Health Grant GM40941 (to C.E.B.).
Footnotes
The authors declare no conflict of interest.
This article is a PNAS Direct Submission.
This article contains supporting information online at www.pnas.org/cgi/content/full/0802149105/DCSupplemental.
References
- 1.Masuda S, Bauer CE. The antirepressor AppA uses the novel flavin-binding BLUF domain as a blue-light-absorbing photoreceptor to control photosystem synthesis. In: Briggs WR, Spudich JL, editors. Handbook of Photosensory Receptors. New York: Wiley; 2004. pp. 433–445. [Google Scholar]
- 2.Masuda S, Bauer CE. AppA is a blue light photoreceptor that antirepresses photosynthesis gene expression in. Rhodobacter sphaeroides. Cell. 2002;110:613–623. doi: 10.1016/s0092-8674(02)00876-0. [DOI] [PubMed] [Google Scholar]
- 3.Gomelsky M, Kaplan S. appA, a novel gene encoding a trans-acting factor involved in the regulation of photosynthesis gene expression in Rhodobacter sphaeroides. J Bacteriol. 1995;177:4609–4618. doi: 10.1128/jb.177.16.4609-4618.1995. [DOI] [PMC free article] [PubMed] [Google Scholar]
- 4.Gomelsky M, Kaplan S. AppA, a redox regulator of photosystem formation in Rhodobacter sphaeroides 2.4.1, is a flavoprotein. Identification of a novel fad binding domain. J Biol Chem. 1998;273:35319–35325. doi: 10.1074/jbc.273.52.35319. [DOI] [PubMed] [Google Scholar]
- 5.Gauden M, et al. Hydrogen-bond switching through a radical pair mechanism in a flavin-binding photoreceptor. Proc Natl Acad Sci USA. 2006;103:10895–10900. doi: 10.1073/pnas.0600720103. [DOI] [PMC free article] [PubMed] [Google Scholar]
- 6.Dragnea V, et al. Time-resolved spectroscopic studies of the AppA blue-light receptor BLUF domain from Rhodobacter sphaeroides. Biochemistry. 2005;44:15978–15985. doi: 10.1021/bi050839x. [DOI] [PMC free article] [PubMed] [Google Scholar]
- 7.Jung A, et al. Crystal structures of the AppA BLUF domain photoreceptor provide insights into blue light-mediated signal transduction. J Mol Biol. 2006;362:717–732. doi: 10.1016/j.jmb.2006.07.024. [DOI] [PubMed] [Google Scholar]
- 8.Unno M, Masuda S, Ono TA, Yamauchi S. Orientation of a key glutamine residue in the BLUF domain from AppA revealed by mutagenesis, spectroscopy, and quantum chemical calculations. J Am Chem Soc. 2006;128:5638–5639. doi: 10.1021/ja060633z. [DOI] [PubMed] [Google Scholar]
- 9.Grinstead JS, et al. Light-induced flipping of a conserved glutamine side chain and its orientation in the AppA BLUF domain. J Am Chem Soc. 2006;128:15066–15067. doi: 10.1021/ja0660103. [DOI] [PubMed] [Google Scholar]
- 10.Yuan H, et al. Crystal structures of the synechocystis photoreceptor Slr1694 reveal distinct structural states related to signaling. Biochemistry. 2006;45:12687–12694. doi: 10.1021/bi061435n. [DOI] [PMC free article] [PubMed] [Google Scholar]
- 11.Masuda S, Hasegawa K, Ishii A, Ono TA. Light-induced structural changes in a putative blue-light receptor with a novel FAD binding fold sensor of blue-light using FAD (BLUF); Slr1694 of Synechocystis sp PCC6803. Biochemistry. 2004;43:5304–5313. doi: 10.1021/bi049836v. [DOI] [PubMed] [Google Scholar]
- 12.Masuda S, Tomida Y, Ohta H, Takamiya K. The critical role of a hydrogen bond between Gln63 and Trp104 in the blue-light sensing BLUF domain that controls AppA activity. J Mol Biol. 2007;368:1223–1230. doi: 10.1016/j.jmb.2007.02.087. [DOI] [PubMed] [Google Scholar]
- 13.Masuda S, Hasegawa K, Ono TA. Light-induced structural changes of apoprotein and chromophore in the sensor of blue light using FAD (BLUF) domain of AppA for a signaling state. Biochemistry. 2005;44:1215–1224. doi: 10.1021/bi047876t. [DOI] [PubMed] [Google Scholar]
- 14.Masuda S, Hasegawa K, Ono TA. Tryptophan at position 104 is involved in transforming light signal into changes of β-sheet structure for the signaling state in the BLUF domain of AppA. Plant Cell Physiol. 2005;46:1894–1901. doi: 10.1093/pcp/pci208. [DOI] [PubMed] [Google Scholar]
- 15.Gauden M, et al. On the role of aromatic side chains in the photoactivation of BLUF domains. Biochemistry. 2007;46:7405–7415. doi: 10.1021/bi7006433. [DOI] [PubMed] [Google Scholar]
- 16.Iseki M, et al. A blue-light-activated adenylyl cyclase mediates photoavoidance in Euglena gracilis. Nature. 2002;415:1047–1051. doi: 10.1038/4151047a. [DOI] [PubMed] [Google Scholar]
- 17.Kaneko T, et al. Sequence analysis of the genome of the unicellular cyanobacterium Synechocystis sp. strain PCC6803. II. Sequence determination of the entire genome and assignment of potential protein-coding regions. DNA Res. 1996;3:109–136. doi: 10.1093/dnares/3.3.109. [DOI] [PubMed] [Google Scholar]
- 18.Masuda S, Ono TA. Biochemical characterization of the major adenylyl cyclase, Cya1, in the cyanobacterium Synechocystis sp PCC 6803. FEBS Lett. 2004;577:255–258. doi: 10.1016/j.febslet.2004.09.086. [DOI] [PubMed] [Google Scholar]
- 19.Okajima K, et al. Structural and functional analysis of a novel flavoprotein in cyanobacteria. Plant Cell Physiol. 2003;44:S162. [Google Scholar]
- 20.Gomelsky M, Klug G. BLUF: A novel FAD–binding domain involved in sensory transduction in microorganisms. Trends Biochem Sci. 2002;27:497–500. doi: 10.1016/s0968-0004(02)02181-3. [DOI] [PubMed] [Google Scholar]
- 21.Okajima K, et al. Biochemical and functional characterization of BLUF-type flavin-binding proteins of two species of cyanobacteria. J Biochem (Tokyo) 2005;137:741–750. doi: 10.1093/jb/mvi089. [DOI] [PubMed] [Google Scholar]
- 22.Krissinel E, Henrick K. Inference of macromolecular assemblies from crystalline state. J Mol Biol. 2007;372:774–797. doi: 10.1016/j.jmb.2007.05.022. [DOI] [PubMed] [Google Scholar]
- 23.Jung A, et al. Structure of a bacterial BLUF photoreceptor: Insights into blue light-mediated signal transduction. Proc Natl Acad Sci USA. 2005;102:12350–12355. doi: 10.1073/pnas.0500722102. [DOI] [PMC free article] [PubMed] [Google Scholar]
- 24.Kraft BJ, et al. Spectroscopic and mutational analysis of the blue-light photoreceptor AppA: A novel photocycle involving flavin stacking with an aromatic amino acid. Biochemistry. 2003;42:6726–6734. doi: 10.1021/bi030055o. [DOI] [PubMed] [Google Scholar]
- 25.Demeler B. ltraScan: A comprehensive data analysis software package for analytical ultracentrifugation experiments. In: Scott DJ, Harding SE, Rowe AJ, editors. Modern Analytical Ultracentrifugation: Techniques and Methods. London: Royal Society of Chemistry; 2005. pp. 210–229. [Google Scholar]
- 26.Durchschlag H. Specific volumes of biological macromolecules and some other molecules of biological interest. In: Hinz H-J, editor. Thermodynamic Data for Biochemistry and Biotechnology. New York: Springer; 1986. pp. 45–128. [Google Scholar]
Associated Data
This section collects any data citations, data availability statements, or supplementary materials included in this article.


