Abstract
The detailing of the intermolecular interactions in dense solid oxygen is essential for an understanding of the rich polymorphism and remarkable properties of this element at high pressure. Synchrotron inelastic x-ray scattering measurements of oxygen K-edge excitations to 38 GPa reveal changes in electronic structure and bonding on compression of the molecular solid. The measurements show that O2 molecules interact predominantly through the half-filled 1πg* orbital <10 GPa. Enhanced intermolecular interactions develop because of increasing overlap of the 1πg* orbital in the low-pressure phases, leading to electron delocalization and ultimately intermolecular bonding between O2 molecules at the transition to the ε-phase. The ε-phase, which consists of (O2)4 clusters, displays the bonding characteristics of a closed-shell system. Increasing interactions between (O2)4 clusters develop upon compression of the ε-phase, and provide a potential mechanism for intercluster bonding in still higher-pressure phases.
Keywords: high pressure, high-pressure phases of oxygen, molecular interaction, x-ray Raman scattering
Molecular oxygen undergoes a series of phase transitions when compressed at room temperature. Fluid O2 exists to 5.5 GPa and solidifies upon further compression, forming the rombohedral β-phase (1) at 5.5 GPa, the orthorhmbic δ-phase (2) at 9.6 GPa, the monoclinic ε-phase (3, 4) at 10 GPa, and the modified monoclinic ζ-phase (5) at 96 GPa. These transformations are accompanied by marked changes in color, density, and vibrational dynamics (6–9), and by metallization (10), including the appearance of superconductivity at low temperatures (11). These remarkable phenomena in condensed oxygen are consequences of pressure-induced changes in electronic structure and bonding, an area of fundamental importance but previously inaccessible by in situ high-pressure studies. Raman and infrared observations of the ε-phase, specifically the anomaly in the intramolecular vibrational frequencies of O2 (6, 8) and the appearance of strong infrared absorption (7, 8), have led to suggestions of increased intermolecular interaction, electronic charge transfer, and a paired O2 model for the ε-phase. The tendency toward association of O2 molecules in the ε-phase was also proposed based on results of early density functional calculations (12). There has, however, been no direct characterization of the molecular interactions in oxygen phases at high pressure.
The recent discovery of (O2)4 molecular clusters in the ε-phase by x-ray diffraction (3, 4) has revived interest in the nature of the intermolecular interactions in dense fluid and solid oxygen, the evolution of these interactions with pressure, and the origin of the stability of the (O2)4-based structure of the ε-phase (13). Using oxygen K-edge inelastic x-ray scattering (IXS) spectroscopy (14), a unique high-pressure probe of local electronic structure and chemical bonding (15–17), we report an experimental characterization of the electronic structure and bonding changes in condensed phases of oxygen up to 38 GPa that provides direct information on intermolecular interactions on compression. These interactions primarily involve the half-filled 1πg* orbital of O2; an enhanced intermolecular interaction develops between 1πg* orbitals on adjacent molecules, with subsequent orbital delocalization in the low-pressure phases as molecules are brought close together with increasing pressure, leading to intermolecular bonding in the ε-phase. The chemical bonding in the ε-phase and its evolution with pressure are discussed.
Results and Discussion
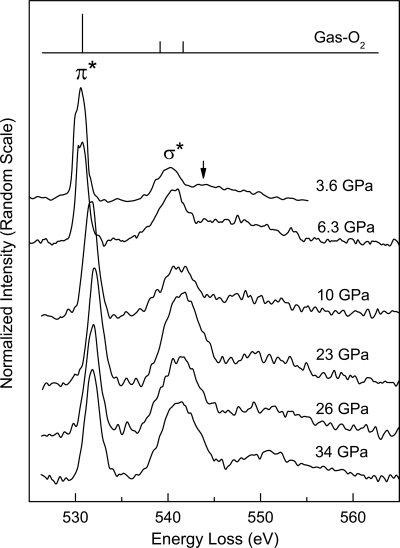
Representative oxygen K-edge spectra up to 38 GPa at room temperature, where oxygen exists in the dense fluid and solid β-, δ-, and ε-phases, are shown in Fig. 1. Compared with gas-phase O2 (18) schematically illustrated in Fig. 1, these high-pressure oxygen phases display similar spectral features because of the transitions of 1s core-level electrons to the antibonding 1πg* and 3σu* orbitals (hereafter referred to as π* and σ* transitions, respectively), which provide a direct indication of their molecular nature. An evident difference, best shown by the K-edge of fluid-O2 at 3.6 GPa (Fig. 1), is the substantially reduced and broadened second twin peak. This observation is similar to those given in previous reports for solid O2 films at low temperatures (19–21) and is attributed to a quenching or broadening of the Rydberg states in condensed phases.
Fig. 1.
Representative IXS K-edge spectra of condensed oxygen phases at high pressure, plotted as normalized scattering intensity (normalized to incident beam intensity) versus energy loss. The peaks labeled π* and σ* correspond to the 1s –1πg* and 1s–3σu* transitions, respectively. For comparison, the K-edge spectrum of gas-phase O2 is schematically shown, which consists of a strong π* peak at 530.8 eV and two weak peaks of comparable intensity at 539.2 eV and 541.7 eV (18) corresponding to the 3σu* transitions with Rydberg states primarily in the region of the higher energy peak of the doublet (19, 21, 23). The intensity reduction of this peak in fluid O2 is indicated by the arrow in the 3.6 GPa spectrum.
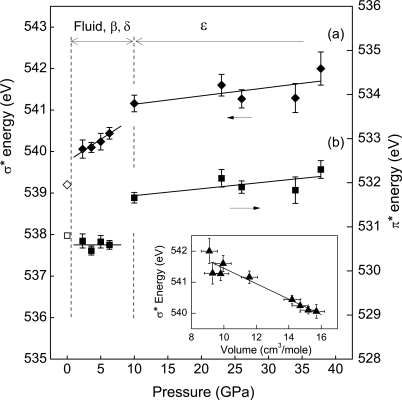
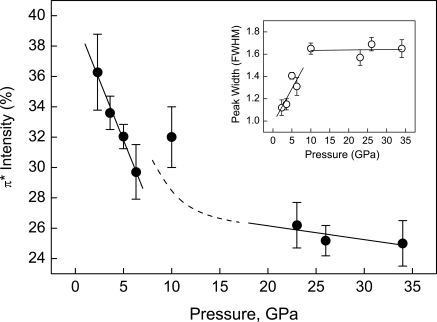
Marked changes in π* and σ* spectral features with compression are revealed through analysis of the high-pressure IXS spectra as shown in Figs. 2 and 3. These changes clearly define regions of the low-pressure phases and the ε-phase as a result of differences in the variation of transition energies with pressure. An important result is the distinctly different behavior of the π* and σ* transition energies in low-pressure phases (Fig. 2). Compared with that observed in gas-phase O2, the σ* energy displays a noticeable increase of 0.9 eV in the dense fluid phase, followed by a continuous increase with further compression to just below 10 GPa. This behavior is in clear contrast to the π* energy, which remains constant in this pressure range. At 10 GPa, corresponding to the transition to the ε-phase (6), there is a discontinuous shift of the π* transition to a higher energy by ∼1.1 eV. For the ε-phase between 10 and 38 GPa, both π* and σ* transition energies increase slightly with pressure. Along with the variation in transition energy, the relative intensity of the π* feature (Fig. 3), determined from the ratio of the area under the π* peak to the total signal from 525 eV to 555 eV, shows a considerable decrease with pressure in the low-pressure phases. The ε-phase is distinguished by a significantly reduced variation of intensity with pressure. These observations indicate pressure-induced changes in the intermolecular interactions between O2 molecules. The continuous variation in the transition energy and intensity <10 GPa shows that these low-pressure phases possess similar bonding characteristics; the ε-phase, on the other hand, represents a distinctive change in bonding nature.
Fig. 2.
Variation in the σ* and π* transition energies of oxygen with pressure, in (A) and (B) respectively. Open symbols represent data for gas-phase O2 (18), solid symbols the high-pressure phases, and the solid lines are linear fits to the data. The correlation between σ* transition energy and volume is shown in the Inset.
Fig. 3.
Pressure dependence of relative π* transition intensity. Linear fits to the data at low- and high-pressure regions are given by the solid lines, and the dashed line serves a guide to the eye. Inset shows the peak width (FWHM) of the π* peak as a function of pressure.
The π* and σ* features in a K-edge spectrum arise from resonant scattering of the excited 1s photoelectron between atoms within an O2 molecule. As a result, their energies should similarly depend on the intramolecular bond length (22, 23). The σ* energy has been found to be inversely proportional to the bond length of molecular oxygen chemisorbed on metal surfaces at low temperatures (24); similar correlations have also been observed in chemisorbed molecules with C–O bonds (22) and for the C–C bonds of gas-phase hydrocarbons (25). Gaussian-type-orbital calculations in the local density approximation have shown that the 3σu* orbital in O2 moves to a higher energy as the molecule is confined into a smaller volume in solid O2 films (20). The π* energy, on the other hand, displays a complex behaviors that has been attributed to molecular interactions through the π* orbital of the molecules (19, 22, 23).
When the σ* energies of the condensed phases of oxygen are plotted as a function of volume by using available equation of state data for the solid phases (1–3, 5) with volumes for the fluid phase estimated by extrapolating those of the β-phase, we find that the observed σ* transition energy indeed does increase with decreasing volume (Fig. 2 Inset), in a manner similar to those previously observed in chemisorbed molecules and gas-phase hydrocarbon molecules and as predicted theoretically for solid O2 films. Although there is some scatter in the region of the ε-phase, the overall variation can be largely accounted for by the volume change, providing evidence that the variation in the σ* transition energy is a consequence of the expected volume reduction under pressure. The decreased variation in the σ* transition energy >10 GPa is consistent with the low compressibility of the ε-phase as determined by x-ray diffraction (3, 5).
The contrasting behavior of the π* and σ* transition energies indicates the involvement of the 1πg* molecular orbitals on adjacent O2 molecules, an interaction which evolves as oxygen undergoes phase transitions at high pressure. Because the effective volume per O2 molecule from 2.3 to 9.6 GPa is ∼20–37% smaller than that of an O2 molecule in the gas phase (26), the overlap between half-filled antibonding 1πg* orbitals on adjacent O2 molecules increases dramatically in the dense fluid and solid phases. With the presence of unpaired electron spins in the 1πg* orbital, such a reduced volume and the consequent orbital overlap inevitably lead to increased interactions between neighboring molecules. In fact, such an interaction mechanism for O2 molecules was proposed by Pauling (27) to explain the disappearance of magnetism in low-temperature solutions of liquid oxygen at ambient pressure.
Previous experimental and theoretical studies have established that molecular interactions through the 1πg* orbital lead to changes in electron occupation of the orbital and/or to its delocalization, which consequently affects the spectral characteristics of the π* transition (22–24, 28, 29). Orbital delocalization results in the distribution of oscillator strength over a wider energy range, thereby reducing the energy and broadening the spectral feature (28–30). A reduction in energy and intensity of the π* peak has been observed in chemisorbed CO and is correlated to the delocalization the orbital (29).
Based on these previous findings, we interpret the observed substantial decrease in the relative intensity of the π* transition <10 GPa (Fig. 3), accompanied by peak broadening (Fig. 3 Inset), as resulting from a gradual delocalization of the 1πg* orbital, due to increased intermolecular interactions as O2 molecules are brought closer together upon compression. The enhanced orbital delocalization with pressure is consistent with the constant π* transition energy observed in this region. We point out that the decrease in π* energy due to the orbital delocalization should cancel the effect of the pressure-induced volume reduction that would move the π* transition to higher energies (23), resulting in a relatively constant energy for the transition with increasing pressure.
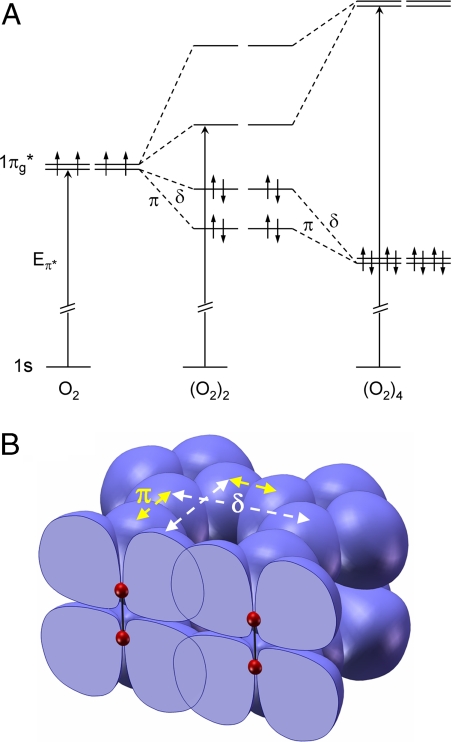
The discontinuous shift of the π* transition to a higher energy at 10 GPa (Fig. 2B) is evidence for the formation of intermolecular bonding brought about by the enhanced 1πg* orbital interaction between neighboring O2 molecules at low pressures. The fact that π*–π* interactions of constituent molecules lead to the formation of delocalized orbitals of a molecular cluster is well known in organic chemistry (31, 32). Furthermore, correlating the observed shift in π* transition energy with the development of intermolecular bonding is also consistent with a recently proposed molecular orbital scheme for the (O2)4 unit in the ε-structure (33), in which the eight degenerate 1πg* orbitals from four O2 molecules form bonding and antibonding orbitals of the molecular cluster. A schematic orbital energy-level diagram illustrating the essential features of this model is shown in Fig. 4A. Each of the 1πg* molecular orbitals of an O2 molecule interacts in a π fashion with a 1πg* orbital on one adjacent O2 molecule, and in δ-fashion with a 1πg* orbital on a different O2 molecule (Fig. 4B) to create the bonding and antibonding levels of the (O2)4 cluster. Tracing the evolution of the formation of this cluster through an (O2)2 dimer unit to the observed (O2)4, it is clear that the formation of the eight-atom cluster offers a dramatic increase in the HOMO–LUMO gap over that of the dimer as well as a significant increase in the energy of the π* transition upon formation of the (O2)4 cluster and provides a rationale for the stability of the cluster over the dimer. A similar change in the π* transition energy with a formation of intermolecular bonding through the 1πg* orbital of O2 has also been reported (19) for chemisorbed O2 on Pt (111) at low temperatures, in which the π* transition energy corresponding to the bonding direction is shifted to a higher energy while that in the nonbonded direction remains unchanged. In an arrangement of O2 molecules aligned with the molecular axes parallel in layered structures of the solid oxygen phases, the observed intermolecular interaction and bonding through 1πg* orbital suggests that the intermolecular bonding in (O2)4 is directional and perpendicular to the intramolecular axis of O2. The K-edge spectral features of the ε-phase at high pressure also yield information about the nature of its bonding. In contrast to the low-pressure phases, which are characterized by the distinctly different behavior of the π* and σ* transition energies due to the open-shell interactions of 1πg* orbitals, the ε-phase displays similarly increasing variations of both energies with pressure (Fig. 2). This observation suggests a closed-shell character for the molecular interactions, in agreement with recent theoretical studies (33, 34).
Fig. 4.
Molecular orbital scheme. (A) Schematic orbital energy level diagram showing the evolution of bonding and antibonding orbitals of the (O2)4 cluster from the interactions of eight degenerate π* orbitals of four O2 molecules. (B) Topology of π* orbital interactions in the (O2)4 cluster, illustrating the two different interactions in which each π* orbital participates as the cluster is formed from four O2 molecules. The energy levels of an idealized (O2)2 dimer in A illustrate the effect of the two interactions. A paired spin model is not proposed for the dimer, however.
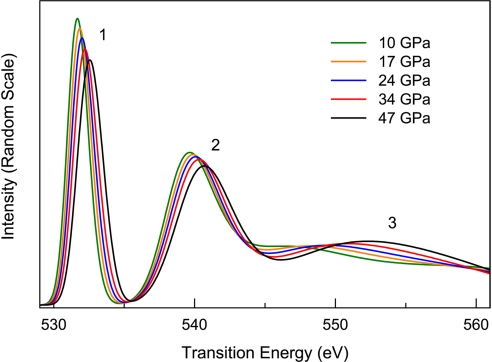
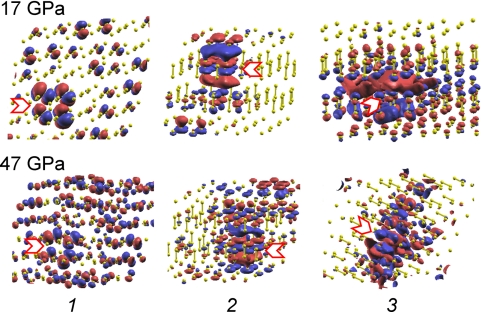
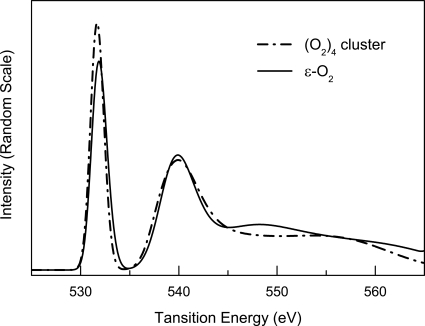
The evolution of the interactions in the ε-phase with pressure is further elucidated by theoretical calculations. Fig. 5 shows the calculated oxygen XAS K-edges of the ε-phase at selected pressures from 10 to 47 GPa, with the corresponding excited -state orbitals plotted in Fig. 6. The spectral features and the qualitative trends of the intensity and energy variations agree reasonably well with the experiment. The calculation also reproduces the appearance of a broad feature at high energies ∼550 eV as pressure is further increased in the ε-phase (K-edge at 34 GPa in Fig. 1). The intercluster interaction in the ε-phase through the π* orbital is revealed by comparing the K-edges of the solid ε-phase and an isolated (O2)4 cluster (Fig. 7). The reduced π* intensity in the ε-phase as compared with that in the isolated cluster indicates that this orbital in the ε-phase is more delocalized as a result of interactions between neighboring clusters. With further compression of the ε-phase, the orbital delocalization increases, as evidenced by the observed continuous decrease in the relative π* intensity; this conclusion is supported by the theoretical calculations (Figs. 5 and 6). Fig. 6 illustrates that the excited state is delocalized beyond a single (O2)4 cluster at 17 GPa, and the extent of this delocalization is increased at 47 GPa. These results suggest an increase in intercluster interactions with pressure in the ε-phase. The enhanced role of the σ* orbital in the high-pressure region of the ε-phase is further demonstrated by the appearance the broad feature at ∼550 eV, assigned to an admixture of the σ* orbital and the σ*-like continuum state. The increased intercluster interaction in the ε-phase is not surprising. Previous x-ray diffraction measurements (3) indicate a marked decrease in intercluster distance; at 47 GPa, the distance between neighboring clusters is comparable with the distance between O2 molecules within the cluster at 10 GPa. Such an intercluster interaction provides a possible mechanism for the formation of bonding between adjacent clusters in the ζ-phase of oxygen and the onset of metallization at still higher pressure (10).
Fig. 5.
Calculated oxygen K-edge spectra of the ε-phase at high pressures. Peaks labeled as “1,” “2,” and “3” correspond to transitions to π*, σ*, and the continuum states whose orbital plots at 17 GPa and 47 GPa are shown in Fig. 6.
Fig. 6.
Contour plots of the excited state orbitals, labeled as “1,” “2,” and “3,” corresponding to the three distinct regions of π*, σ*, and the continuum in Fig. 5 at 17 and 47 GPa. The blue and red colored lobes represent the phases of the wave function. The size of the lobes is proportional to the contribution of the atom to the wave function. Smaller lobes localized on an ionized O atom (position marked by arrows) and the concurrent appearance of the lobes in more distant atoms indicate that the final state wave function is more delocalized.
Fig. 7.
Comparison of calculated K-edge spectra of solid ε-O2 and an isolated (O2)4 cluster.
Materials and Methods
High-purity oxygen (99.999%) was cryogenically loaded into a sample chamber in an x-ray transparent beryllium gasket compressed in a panoramic diamond anvil cell (DAC). To prevent potential contamination, sample loading was conducted in a controlled environment. Before gas O2 was cryogenically liquidized for loading, air was removed from the loading chamber by replicating steps of vacuum pumping and O2 gas purging. The purity of the loaded samples was confirmed by optical spectroscopy.
Oxygen K-edge spectra were collected at high pressures by using the inelastic x-ray scattering (IXS) technique at beamlines 16ID-D (HPCAT) and 13ID-C (GSECARS) of the Advanced Photon Source. The two facilities have nearly identical IXS setups and use essentially the same major components for the collection of IXS data. By using a pair of meter-long KB mirrors, monochromatic x-rays from an undulator source were focused to a spot of area 50 μm × 15 μm at the sample position. With the DAC mounted on the rotation center of the IXS spectrometer, we collected oxygen K-edge spectra by scanning the incident beam energy from 525 to 565 eV above the analyzer elastic scattering energy of 9.6865 keV. The scattered x-rays were collected with a six-element Si (660) analyzer positioned at 870 mm from the sample at a 2-θ angle of 18°, and the intensity at the elastic energy reflected by the analyzer crystals was recorded in a near back-scattering (Bragg angle of 89°) geometry by using a AMPTEK Si detector. The analyzer elastic energy was determined after each experiment setup and the system reliability verified by using the K-edges of standard graphitic phases of carbon and boron nitride. Energies of K-edge spectral features, presented by energy loss (incident photon energy − analyzer elastic energy), are not affected by standard uncertainties in absolute energy calibration. To increase the signal to background ratio, a postsample slit at the 2-θ angle was used to discriminate the signal along the beam direction. Pressures were calibrated by the ruby luminescence method before and after each IXS measurement.
Theoretical O K-edge x-ray absorption spectra (XAS) of the ε-phase at high pressures were calculated by using the CPMD code (35) with a supercell model consisting of 216 atoms constructed with atomic positions derived from the corresponding fully optimized structure at each pressure by using the PWSCF code (www.pwscf.org). The calculations used the density function of Perdew et al. (36) with the 1s core represented by the Troullier–Martins norm-conserving pseudopotential for the O atom (37) and valence orbitals by a plane wave basis with an energy cutoff of 90 Ry. Only the Γ-point is used for energy sampling. A partially screened half-core hole (38, 39) with half of an electron removed from the 1s core level was used to mimic the ionized O atom. This transition-state model, in principle, takes into account the relaxation effect up to second order in the transition energy. Wave functions of empty orbitals from the transition-state potential, which had been shown to yield reliable oscillator strengths for core-level absorption spectra (40), were used to approximate the final state in the calculation of the K-edge XAS spectra. Oscillator strengths were obtained from the projection of the core wave function to the O 2p projected density of states. This approach has been shown to produce results in reasonable agreement with the experiment (39, 41, 42). Two thousand electronic states, including occupied orbitals, were generated for the calculation, yielding electronic excitations up to 577 eV. Trial calculations using a larger supercell with 512 atoms and 3,000 electronic states show no quantitative change in the calculated XAS profile.
Acknowledgments.
We thank S. K. Lee, B. Militzer, and J. B. Neaton for reviewing the manuscript; G. Cody and R. E. Cohen for comments and suggestions; and M. Phillips for coordinating manuscript-related communications. GeoSoilEnviro Consortium for Advanced Radiation Sources (GSECARS) is supported by Department of Energy (DOE)–Basic Energy Sciences (BES)–Geosciences, National Science Foundation (NSF)–Division of Earth Sciences (EAR), and the State of Illinois. The High-Pressure Collaborative Access Team facility is supported by DOE–BES, DOE–National Nuclear Security Administration (Carnegie DOE Alliance Center), NSF, Department of Defense–Tactical Army Command, and the W. M. Keck Foundation.
Footnotes
The authors declare no conflict of interest.
References
- 1.Schiferl D, Cromer DT, Mills RL. Structure of O2 at 5.5 GPa and 299 K. Acta Crystallogr B. 1981;37:1329–1332. [Google Scholar]
- 2.Schiferl D, Cromer DT, Schwalbe LA, Mills RL. Structure of ‘orange’ 18O2 at 9.6 GPa and 297 K. Acta Crystallogr B. 1983;39:153–157. [Google Scholar]
- 3.Fujihisa H, et al. O8 cluster structure of the epsilon phase of solid oxygen. Phys Rev Lett. 2006;97 doi: 10.1103/PhysRevLett.97.085503. 085503. [DOI] [PubMed] [Google Scholar]
- 4.Lundegaard LF, Weck G, McMahon MI, Desgreniers S, Loubeyre P. Observation of an O8 molecular lattice in the epsilon phase of solid oxygen. Nature. 2006;443:201–204. doi: 10.1038/nature05174. [DOI] [PubMed] [Google Scholar]
- 5.Akahama Y, Kawamura H, Hausermann D, Hanfland M, Shimomura O. New high-pressure structural transition of oxygen at 96 GPa associated with metallization in a molecular-solid. Phys Rev Lett. 1995;74:4690–4693. doi: 10.1103/PhysRevLett.74.4690. [DOI] [PubMed] [Google Scholar]
- 6.Nicol M, Hirsch KR, Holzapfel WB. Oxygen phase equilibria near 298 K. Chem Phys Lett. 1979;68:49–52. [Google Scholar]
- 7.Agnew SF, Swanson BI, Jones LH. Extended interactions in the epsilon-phase of oxygen. J Chem Phys. 1987;86:5239–5245. [Google Scholar]
- 8.Gorelli FA, Ulivi L, Santoro M, Bini R. The epsilon phase of solid oxygen: Evidence of an O-4 molecule lattice. Phys Rev Lett. 1999;83:4093–4096. [Google Scholar]
- 9.Akahama Y, Kawamura H. High-pressure infrared spectroscopy of solid oxygen. Phys Rev B. 2000;61:8801–8805. doi: 10.1103/physrevb.54.r15602. [DOI] [PubMed] [Google Scholar]
- 10.Desgreniers S, Vohra YK, Ruoff AL. Optical-response of very high-density solid oxygen to 132 GPa. J Phys Chem. 1990;94:1117–11122. [Google Scholar]
- 11.Shimizu K, Suhara K, Ikumo M, Eremets MI, Amaya K. Superconductivity in oxygen. Nature. 1998;393:767–769. [Google Scholar]
- 12.Neaton JB, Ashcroft NW. Low-energy linear structures in dense oxygen: Implications for the epsilon phase. Phys Rev Lett. 2002;88:205503. doi: 10.1103/PhysRevLett.88.205503. [DOI] [PubMed] [Google Scholar]
- 13.Militzer B, Hemley RJ. Solid oxygen takes shape. Nature. 2006;443:150–151. doi: 10.1038/443150a. [DOI] [PubMed] [Google Scholar]
- 14.Hamalainen K, Manninen S. Resonant and non-resonant inelastic x-ray scattering. J Phys Condens Matter. 2001;13:7539–7555. [Google Scholar]
- 15.Meng Y, et al. The formation of sp3 bonding in compressed BN. Nat Mater. 2004;3:111–114. doi: 10.1038/nmat1060. [DOI] [PubMed] [Google Scholar]
- 16.Mao WL, et al. Bonding changes in compressed superhard graphite. Science. 2003;302:425–427. doi: 10.1126/science.1089713. [DOI] [PubMed] [Google Scholar]
- 17.Lee SK, et al. Direct probing of binding changes in B2O3 glasses at high pressure with inelastic x-ray scattering. Nat Mater. 2005;4:851–854. [Google Scholar]
- 18.Hitchcook AP, Brion CE. K-shell excitation spectra of CO2, N2, and O2. J Electron Spectrosc Relat Phenom. 1980;18:1–21. [Google Scholar]
- 19.Wurth W, et al. Bonding, structure, and magnetism of physisorbed and chemisorbed O2 on Pt(111) Phys Rev Lett. 1990;65:2426–2429. doi: 10.1103/PhysRevLett.65.2426. [DOI] [PubMed] [Google Scholar]
- 20.Kuiper P, Dunlap BI. The σ* absorption peak at the oxygen 1s edge of O2: Exchange splitting ultrafast dissociation, and atomiclike Auger spectra. J Chem Phys. 1994;100:4087–4092. [Google Scholar]
- 21.Ruckman MW, Qiu SL, Chen J, Strongin M. Near-edge study of molecular oxygen and nitrogen clusters on a krypton surface. Phys Rev B. 1991;43:8603–8605. doi: 10.1103/physrevb.43.8603. [DOI] [PubMed] [Google Scholar]
- 22.Stohr J, et al. Bonding and bond lengths of chemisorbed molecules from near-edge x-ray-absorption fine-structure studies. Phys Rev Lett. 1983;51:2414–2417. [Google Scholar]
- 23.Ruckman MW, et al. Interpreting the near edges of O2 and O2− in alkali-metal superoxides. Phys Rev Lett. 1991;67:2533–2536. doi: 10.1103/PhysRevLett.67.2533. [DOI] [PubMed] [Google Scholar]
- 24.Outka DA, et al. Orientation and bond length of molecular-oxygen on Ag(110) and Pt(111): A near-edge x-ray-absorption fine-structure study. Phys Rev B. 1987;35:4119–4122. doi: 10.1103/physrevb.35.4119. [DOI] [PubMed] [Google Scholar]
- 25.Stohr J, Sette F, Johnson AL. Near-edge x-ray-absorption fine-structure studies of chemisorbed hydrocarbons—Bond lengths with a ruler. Phys Rev Lett. 1984;53:1684–1687. [Google Scholar]
- 26.Bader RFW, Henneker WH, Cade PE. Molecular charge distributions and chemical bonding. J Chem Phys. 1967;46:3341–3363. [Google Scholar]
- 27.Pauling L. The Nature of the Chemical Bond. Ithaca, New York: Cornell Univ Press; 1960. [Google Scholar]
- 28.Stohr J. NEXAFS Spectroscopy. Berlin: Springer; 1992. [Google Scholar]
- 29.Pettersson LGM, Agren H, Vahtras O, Carravetta V. Cluster modeling of core electron photoabsorption of CO absorbed on Cu(100) Surf Sci. 1996;365:581–590. [Google Scholar]
- 30.Ruhl E, Hitchcook AP. Inner-shell excitation of 3d transition-metal carbonyls [Mn2(CO)10, Mn(CO)5Br, and Mn(CO)5H] studied by electron energy loss spectroscopy. J Am Chem Soc. 1989;111:2614–2622. [Google Scholar]
- 31.Liebman JF, Greenberg A. Modern Models of Bonding and Delocalization. New York: VCH; 1988. [Google Scholar]
- 32.Albright TA, Burdett JK, Whangbo M H. Orbital Interactions in Chemistry. New York: Wiley; 1985. [Google Scholar]
- 33.Steudel R, Wong MW. Dark-red O8 molecules in solid oxygen: rhomboid clusters, not S8-like rings. Angew Chem Int Ed. 2007;46:1768–1771. doi: 10.1002/anie.200604410. [DOI] [PubMed] [Google Scholar]
- 34.Tse JS, Yao Y, Klug DD, Desgreniers S. Structure and bonding of the high pressure phases of oxygen. J Phys. 2008 Conference Series, in press. [Google Scholar]
- 35. CPMD copyright IBM corporation (1990–2004), copyright MPI für Festkorperforchung Stuttgart (1997–2001)
- 36.Perdew JP, Burke K, Ernzerhof M. Generalized gradient approximation made simple. Phys Rev Lett. 1996;77:3865–3868. doi: 10.1103/PhysRevLett.77.3865. [DOI] [PubMed] [Google Scholar]
- 37.Troullier N, Martins JL. Efficient pseudo-potentials for plane-wave calculations. Phys Rev B. 1991;43:1993–2006. doi: 10.1103/physrevb.43.1993. [DOI] [PubMed] [Google Scholar]
- 38.Slater JC. Quantum theory of molecules and solids. New York: McGraw-Hill; 1974. [Google Scholar]
- 39.Triguero L, Pettersson LGM. Calculations of near-edge x-ray-absorption spectra of gas phase and chemisorbed molecules by means of density-functional and transition-potential theory. Phys Rev B. 1998;58:8097–8110. [Google Scholar]
- 40.Tse JS, Liu ZF, Bozek JD, Bancroft GM. Multiple-scattering Xα study of the silicon and chlorine core-level photoabsorption spectra of SiCl4. Phys Rev A. 1989;39:1791–1799. doi: 10.1103/physreva.39.1791. [DOI] [PubMed] [Google Scholar]
- 41.Cavalleri M, Odelius M, Nordlund D, Nilsson A, Pettersson LGM. Half or full core hole in density functional theory x-ray absorption spectrum calculations of water? Phys Chem Chem Phys. 2005;7:2854. doi: 10.1039/b505723j. [DOI] [PubMed] [Google Scholar]
- 42.Iannuzzi M, Hutter J. Inner-shell spectroscopy by the Gaussian and augmented plane wave method. Phys Chem Chem Phys. 2007;9:1599. doi: 10.1039/b615522g. [DOI] [PubMed] [Google Scholar]


