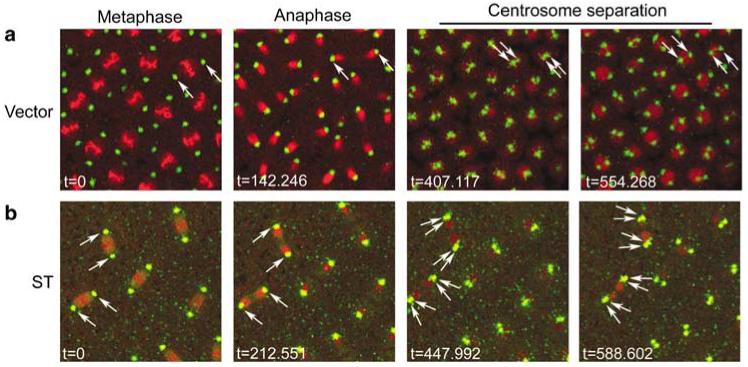
Figure 3.

Live imaging of small tumor antigen (ST) embryos shows cytokinesis failures. Syncytial blastoderm embryos that express eGFP-centrosomin (CNN) to label centrosomes (green) and His2Av-mRFP to label chromosomes (red) were imaged by time-lapse confocal microscopy in (a) vector control embryos, and (b) ST embryos. Movies corresponding to these still images are found in Supplementary materials (movies 1 and 2). In the vector time series (a), a pair of centrosomes is followed (arrows) through mitosis and centrosome splitting until cleavage is completed. In the ST series (b), two pairs of centrosomes (arrows) are followed through a cleavage cycle in which the nuclei collapse back onto each other and fuse during centrosome separation. The following cleavage cycle for this series shows that the two indicated polyploid nuclei, each associated with four centrosomes, fail to proceed into the next mitosis (see Supplementary movie 2).
