Abstract
Chronic infusion of angiotensin (Ang) II leads to the development of hypertension and enhances intrarenal Ang II content to levels greater than can be explained from the circulating concentrations of the peptide. We previously reported that renal angiotensinogen (Ao) mRNA is enhanced in Ang II–dependent hypertension and may contribute to augmented intrarenal Ang II levels, but the Ao protein levels were not significantly increased. Because a high-salt diet (H/S) has been shown to suppress renal expression of Ao mRNA, we examined the effects of chronic Ang II infusion on kidney and liver Ao mRNA and protein levels in male Sprague-Dawley rats (n=12) maintained on an 8% salt diet. Ang II was administered via osmotic minipumps (40 ng/min) to 1 group (n=6) while the remaining rats were sham-operated. A H/S diet alone did not alter systolic blood pressure in sham animals (109±6 mm Hg at day 12); however, Ang II infusions to the H/S rats significantly increased systolic blood pressure (167±7 at day 12) and intrarenal Ang II content (459±107 fmol/g versus 270±42) despite a marked suppression of plasma renin activity (0.9±0.2 ng Ang I·mL−1·h−1 versus 2.8±1.3). Ang II infusions significantly increased kidney Ao mRNA compared with the H/S diet alone by 1.9±0.1-fold. Western blot analysis of kidney protein extracts showed that the Ang II–infused rats had increased kidney Ao protein levels compared with the H/S diet alone (1.9±0.1-fold). Liver Ao mRNA and protein and plasma Ao protein were also significantly increased by Ang II infusions. These data demonstrate the effects of Ang II infusion to stimulate Ao mRNA and protein. Thus, the augmented intrarenal Ang II in Ang II–dependent hypertension may result, in part, by a positive amplification mechanism to activate renal expression of Ao.
Keywords: angiotensin II; angiotensinogen; kidney; sodium, dietary; Western blot; reverse transcriptase–polymerase chain reaction
Angiotensin (Ang) II, an extensively characterized peptide produced by successive proteolytic cleavages of its prohormone angiotensinogen (Ao), plays a critically important role in the regulation of renal hemodynamics and electrolyte homeostasis.1 Recent evidence on the basis of experimental animal models and transgenic mice has documented the involvement of Ao in the development of hypertension caused by activation of the renin-angiotensin system.2-6 In human genetic studies, a linkage has been established between the Ao gene and hypertension.7 Thus, there is considerable evidence supporting the involvement of inappropriately elevated intrarenal Ang II levels in many forms of hypertension.8,9 Chronic infusion of Ang II provides a useful experimental model of Ang II–dependent hypertension that resembles the 2-kidney, 1-clip Goldblatt hypertension model.10 The mechanisms responsible for the ability of moderate increases in circulating Ang II to cause progressive increases in arterial pressure remain incompletely understood. One possible mechanism by which Ang II produces its progressive hypertensinogenic effects may be related to the failure to downregulate renal and hepatic Ang II type 1 receptor mRNA and protein levels.11 When coupled with sustained increases in the circulating Ang II, a progressive Ang II–dependent hypertension results. We suggest that stimulation of Ao synthesis by Ang II may be a key component in the maintenance of elevated circulating and, more importantly, intrarenal Ang II levels.12
In a previous study, we observed that Ang II infusions resulted in significant increases in Ao mRNA in the kidney and liver and liver Ao protein; however, kidney Ao protein levels were not significantly increased.12 One possible reason for the failure to show a distinct effect on the Ao protein is that the control levels might have been already partially stimulated during normal dietary salt intake. It is known that a high-salt (H/S) diet suppresses the renal expression of Ao mRNA.13-15 Therefore, a H/S diet was given to the animals in an attempt to minimize the endogenous Ang II influences on basal Ao production and to allow full demonstration of the effects of Ang II infusions on Ao synthesis. Thus, rats maintained on a H/S diet might provide a more optimal model to evaluate the in vivo effects of Ang II to affect Ao mRNA and protein expression in an environment of suppressed Ao production. Accordingly, this study was performed to investigate the stimulatory effect of Ang II on Ao mRNA and protein under conditions of H/S intake.
Methods
Preparation of Animals and Tissue
The experimental protocol was approved by the Tulane University Animal Care and Use Committee. Male Sprague-Dawley rats (Charles River Laboratories) were housed in wire cages and maintained in a temperature-controlled room regulated on a 12-hour light/dark cycle for 3 weeks (1 week before Ang II infusion and 2 weeks during administration) with free access to water and commercially available rat chow that contained 8% sodium chloride (Harlan Teklad, TD 79119). Rats (body weight 158±10 g; n=12) were anesthetized with sodium pentobarbital (50 mg/kg, IP), and an osmotic minipump (Alza Corporation) was implanted subcutaneously at the dorsum of the neck. Rats were selected at random to receive Ang II infusion (n=6, Calbiochem-Novabiochem Corporation) at a rate of 40 ng/min for a period of 13 days or were subjected to a sham operation (n=6).
Systolic blood pressures were measured in conscious rats using tail-cuff plethysmography just before feeding a H/S diet, 1 day before surgery, and on days 3, 6, and 12 of the Ang II infusion. Blood and tissue samples (kidneys and liver) were harvested on day 13. After decapitation, trunk blood was collected into chilled tubes containing EDTA (5 mmol/L), enalaprilat (20 μmol/L), pepstatin A (10 μmol/L), and 1,10-phenanthroline (1.25 mmol/L). Plasma was separated and stored at 220°C until assayed for plasma renin activity,16 Ang II content,8 Ao activity,17 and protein determination, as previously described. Just after removal of kidneys, one half of a kidney was homogenized in cold methanol and processed for measurement of renal Ang II.18 The remaining kidney samples and liver were snap-frozen in liquid nitrogen and stored at −80°C until processed for total RNA and protein extraction.
Isolation of Total RNA
Because renal Ao mRNA is highly expressed in the proximal tubules,19 the inner medulla was removed from kidney samples. Total RNA was extracted from kidney cortex and liver (∼130 mg) according to the protocol of RNeasy Midi Kit (Qiagen).
Reverse Transcription of RNA
Total RNA from each kidney or liver was reverse-transcribed using the SuperScript Preamplification System for First Strand cDNA Synthesis (Gibco BRL) according to the manufacturer's protocol.
Preparation of Primers
Oligonucleotide primers were designed from the published cDNA sequences of Ao20 and GAPDH.21 GAPDH was used as an internal standard. The sequences of the Ao primers are sense 5′- TTG TTG AGA GCT TGG GTC CCT TCA -3′ (exon 2, bases +638 to +661) and antisense 5′- CAG ACA CTG AGG TGC TGT TGT CCA -3′ (exon 3, bases +901 to +878). The sequences of the GAPDH primers are sense 5′- TCC CTC AAG ATT GTC AGC AA -3′ (bases +421 to +440) and antisense 5′- AGA TCC ACA ACG GAT ACA TT -3′ (bases +728 to +709). The expected sizes of the amplified Ao and GAPDH polymerase chain reaction (PCR) products are 264 and 308 base pairs, respectively.
Semiquantitative PCR
Semiquantitative reverse transcription (RT)–PCR was performed as previously described.22 RT-PCR products for Ao and GAPDH from each animal were electrophoresed on a precast 4−12% PAGE-TBE gel (Novex). The gel was stained with SYBR Gold nucleic acid gel stain (Molecular Probes) and scanned with ultraviolet illumination using Digital Imaging and Analysis (Alpha Innotech Corporation) to obtain integrated densitometric values (IDV). No PCR products were detected in the absence of the RT enzyme, which excludes the possibility of contamination of genomic DNA in total RNA samples. Because GAPDH mRNA did not differ between groups, Ao mRNA expression was evaluated as the ratio of the IDV for Ao to that of GAPDH.
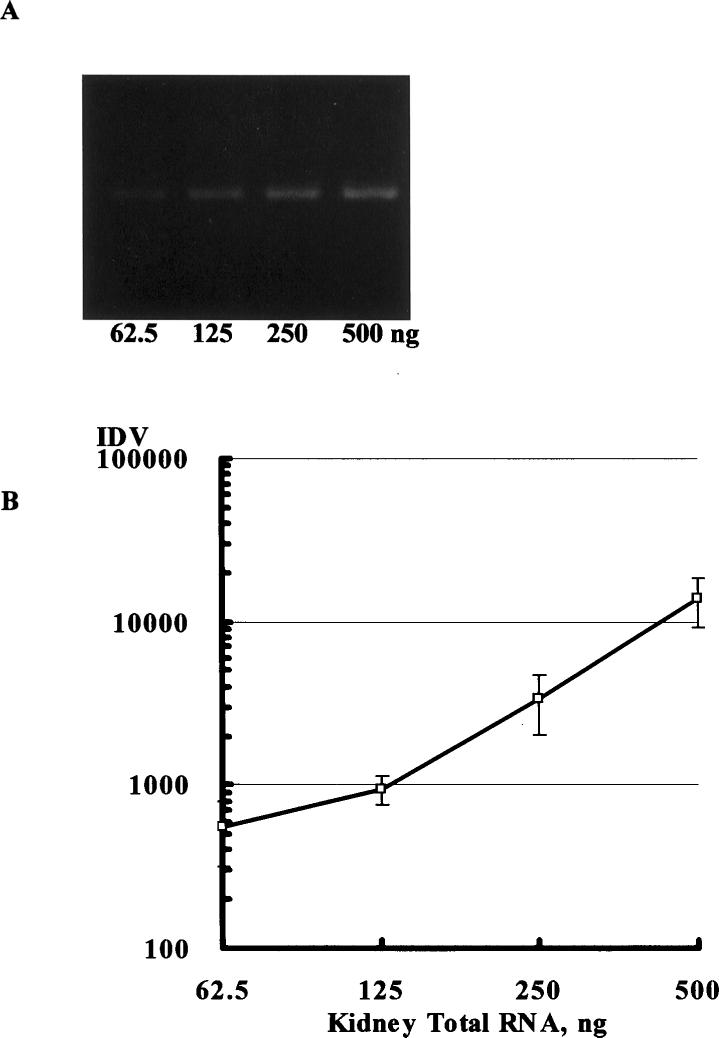
The relationship between the amount of total RNA template and RT-PCR products was evaluated. A linear relationship was found in the range of 62.5 to 500 ng for renal Ao (Figure 1) and 62.5 to 250 ng for renal GAPDH at 28 cycles and in the range of 31.25 to 125 ng for hepatic Ao and 31.25 to 125 ng for hepatic GAPDH at 25 cycles.
Figure 1.
The relationship between the amount of kidney total RNA template (62.5 to 500 ng) and RT-PCR products was evaluated (A). A linear relationship was found between the amount of total RNA template and the amount of PCR product in the range of 62.5 to 500 ng for renal angiotensinogen at 28 cycles of PCR (B). On the basis of these data, the amount of renal total RNA template was selected as 125 ng for the following analysis.
The relationship between PCR cycle number and RT-PCR products was also evaluated. A linear relationship between the number of PCR cycles and the amount of PCR product was obtained from 23 to 35 cycles for renal Ao and 23 to 30 cycles for renal GAPDH at 125 ng of renal total RNA and from 23 to 30 cycles for hepatic Ao and 18 to 28 cycles for hepatic GAPDH at 62.5 ng of hepatic total RNA.
On the basis of these data, optimal total RNA template and PCR cycle number were as follows: 125 ng and 33 cycles for kidney Ao, 125 ng and 25 cycles for kidney GAPDH, 62.5 ng and 28 cycles for liver Ao, and 62.5 ng and 25 cycles for liver GAPDH.
The PCR products were sequenced (Research Genetics Genome Center) to confirm that they were Ao and GAPDH by dideoxy sequencing using the ABI PRISM cycle sequencing kit (Perkin Elmer). The sequences obtained were identical to those previously reported.20,21
Primary Antibody for Ao
Sheep polyclonal antibody against purified rat Ao was produced and characterized at the University of Queensland, Australia.23,24 The primary antibody serum was diluted 1:5000 for Western blot analysis.
Western Blot Analysis
Because renal Ao protein is located primarily in proximal tubular cells,25 the inner medulla was removed from kidney samples. Then, proteins were routinely extracted from kidney cortex and liver samples after homogenization with protease inhibitors and quantified as previously described in detail.11 Plasma (1.25 μg), kidney (15 μg), or liver (10 μg) protein samples were electrophoretically separated by precast NuPAGE 4−12% Bis-Tris gel (Novex) in duplicate. One gel was stained with 0.1% Coomassie Blue R250 (Sigma) to visualize the protein bands for confirmation of equal loading of protein samples. The proteins from the second gel were electrophoretically transferred to nitrocellulose membrane (Bio-Rad Laboratories) using XCell II Mini-Cell (Novex). Western blot analysis was performed as described previously.26 Autoradiograph films were scanned using digital imaging and analysis systems to obtain IDV. IDV were normalized using the average of the sham group.
Statistical Analysis
Results are expressed as mean±SEM. The data were analyzed using unpaired t test between groups. Statistical significance is defined at a value of P,0.05.
Results
Body Weight, Blood Pressure, Plasma Renin Activity, Plasma Ang II Content, Renal Ang II Content, and Plasma Ao Activity
Body weights in the 2 groups at the initiation of the study were not different (Ang II 157±4 g; sham 159±4 g). After 1 week on H/S intake, body weights were also similar (Ang II 190±7 g; sham 191±4 g). On day 12 of the infusion, average body weight in the Ang II–infused rats was significantly lower than body weight in sham-operated rats (239±13 versus 267±4 g).
Systolic blood pressures were similar in the 2 groups before implantation of the osmotic minipumps (Ang II 109±4 mm Hg; sham 106±2 mm Hg). On days 3, 6, and 12 of infusion, systolic blood pressures were significantly elevated to 123±2, 129±1, and 167±3 mm Hg in the Ang II–infused rats compared with sham-operated rats (105±2, 109±2, and 109±2 mm Hg, respectively).
Plasma renin activity was markedly suppressed in the Ang II–infused rats compared with sham-operated rats (0.9±0.2 versus 2.8±1.3 ng Ang I·mL−1·h−1), whereas plasma Ao activity was significantly increased in the Ang II–infused rats compared with sham-operated rats (643±107 versus 299±15 pmol Ang I·mL−1). Plasma Ang II content showed an upward trend in the Ang II–infused rats compared with the sham-operated rats (49±8 versus 34±7 fmol/mL), but the changes were not statistically significant. Kidney Ang II content was significantly increased in the Ang II–infused rats compared with the sham-operated rats (459±107 versus 270±42 fmol/g of kidney).
Western Blot Analysis for Plasma Ao
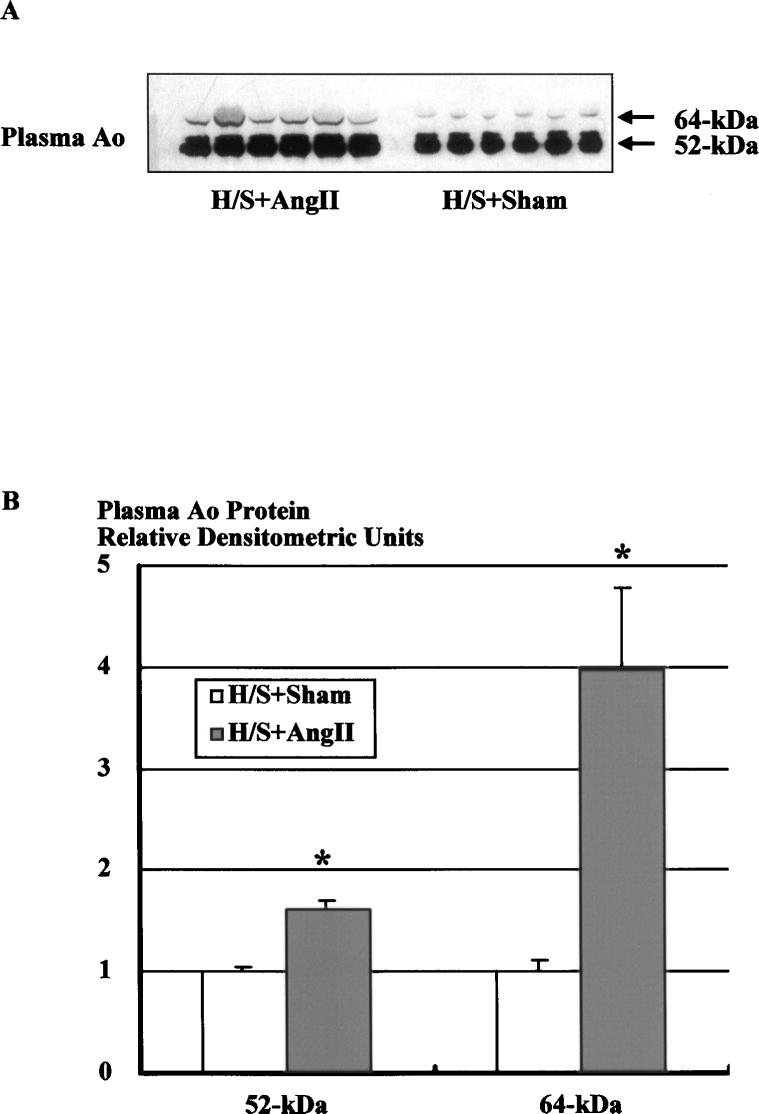
Western blot analysis of plasma protein using the specific Ao polyclonal antibody showed 2 specific bands at 52 and 64 kDa with the greatest abundance at 52 kDa (Figure 2A). It has been previously shown that preadsorption of the primary antibody with pure Ao or replacement of Ao antibody by preimmune serum abolishes both bands.23,24 Incubation of plasma with Peptide:N-glycosidase F demonstrated that the 2 bands had shifted to 1 band at 50 kDa,12 indicating the presence of highly glycosylated and slightly glycosylated forms of circulating Ao. Figure 2A shows a representative Western blot of plasma (1.25 μg protein) Ao from Ang II–infused (H/S+Ang II) and sham-operated (H/S+Sham) rats on a H/S diet. Densitometric analysis of the immunoreactive bands showed that Ang II infusion significantly increased both forms of plasma Ao protein (Figure 2B, 1.61±0.08 versus 1.00±0.04 for 52 kDa, 3.98±0.79 versus 1.00±0.12 for 64 kDa, densitometric ratio to the average of sham animals).
Figure 2.
Western blot analysis of plasma protein using the specific Ao polyclonal antibody. A, Representative autoradiograph of plasma Ao Western blot from Ang II–infused and sham-operated rats on a H/S diet. B, Densitometric analysis of the immunoreactive bands showed that Ang II infusion significantly increased both forms of plasma Ao protein. Similar observations were obtained from 2 other experiments. *P,0.05 vs H/S+Sham.
Expression of Renal Ao mRNA
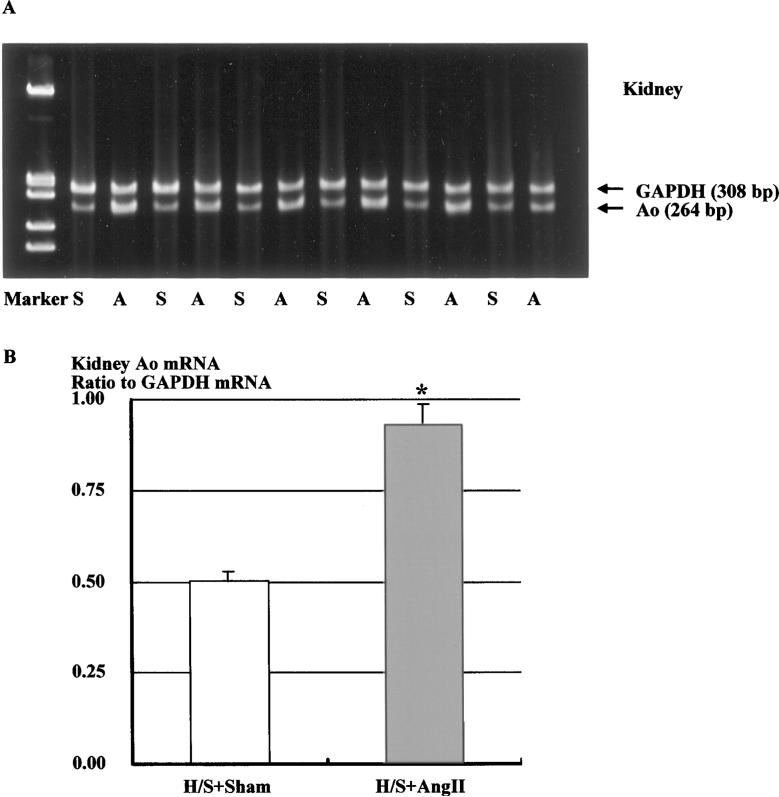
Representative RT-PCR for renal expression of Ao mRNA in sham-operated and Ang II–infused rats fed a H/S diet is depicted in Figure 3A. The analysis indicated that Ang II infusion significantly increased renal Ao mRNA expression by 86% (Figure 3B, 0.93±0.05 versus 0.50±0.03 densitometric ratio to GAPDH mRNA).
Figure 3.
A, Representative gels showing Ao and corresponding GAPDH mRNA levels in the kidney (lanes A, Ang II–infused rats fed H/S diet; lanes S, sham-operated rats fed H/S diet). B, Densitometric analysis of the bands shows that Ang II infusion significantly increased renal Ao mRNA levels by 86%. Similar observations were obtained from 2 other experiments. *P<0.05 vs H/S+Sham.
Western Blot Analysis for Kidney Ao
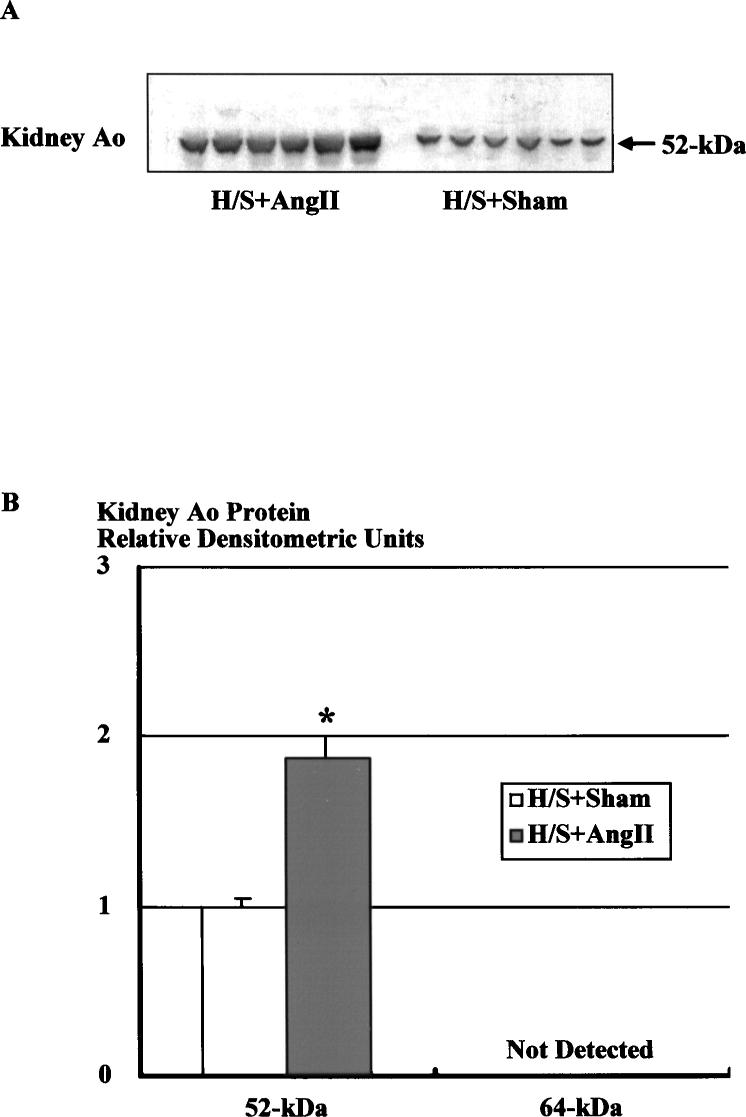
As previously shown for rats on normal salt intake, Western blot analysis of kidney protein using a polyclonal Ao antibody showed 1 specific immunoreactive band at 52 kDa (Figure 4A). This figure shows a representative Western blot of renal Ao protein (15 μg) from Ang II–infused (H/S+Ang II) and sham-operated (H/S+Sham) rats on a H/S diet. Densitometric analysis of the immunoreactive bands showed that the renal Ao protein levels were significantly increased by Ang II infusion (Figure 4B, 1.88±0.12 versus 1.00±0.05).
Figure 4.
Western blot analysis of renal protein using the specific Ao polyclonal antibody. A, Representative autoradiograph of renal Ao Western blot from Ang II–infused and sham-operated rats on a H/S diet. B, Densitometric analysis of the immunoreactive bands showed that Ang II infusion significantly increased renal Ao protein levels by 88%. Similar observations were obtained from 2 other experiments. *P<0.05 vs H/S+Sham.
Expression of Hepatic Ao mRNA
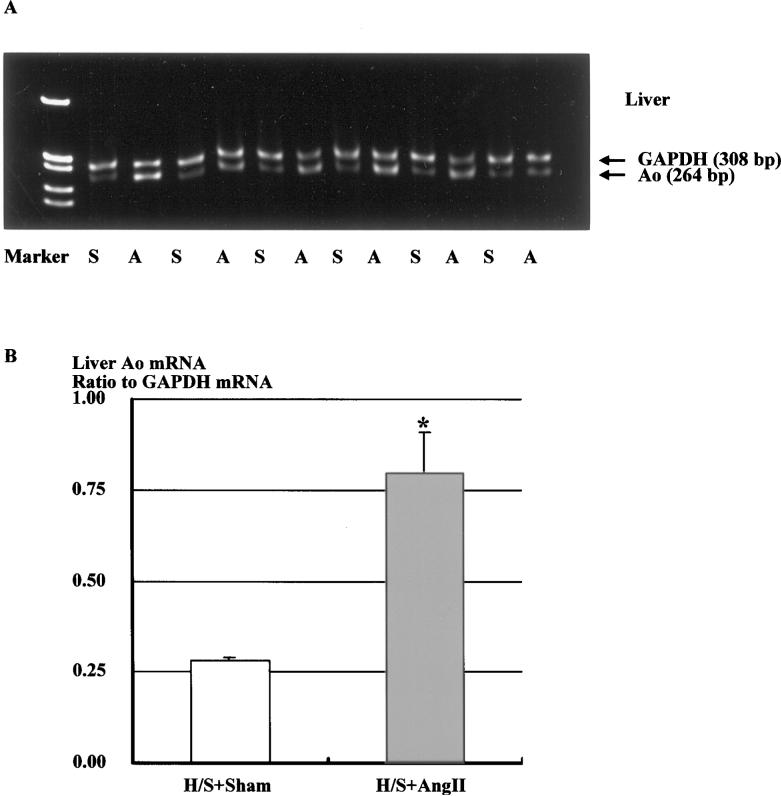
Representative RT-PCR for hepatic expression of Ao mRNA in sham-operated and Ang II–infused rats fed a H/S diet is depicted in Figure 5A. Ang II infusion significantly increased hepatic Ao mRNA expression by 2.9-fold (Figure 5B, 0.80±0.11 versus 0.28±0.01).
Figure 5.
A, Representative gels showing Ao and corresponding GAPDH mRNA levels in the liver (lanes A, Ang II–infused rats fed H/S diet; lanes S, sham-operated rats fed H/S diet). B, Densitometric analysis of the bands shows that Ang II infusion significantly increased hepatic Ao mRNA expression by 2.9-fold. Similar observations were obtained from 2 other experiments. *P<0.05 vs H/S+Sham.
Western Blot Analysis for Liver Ao
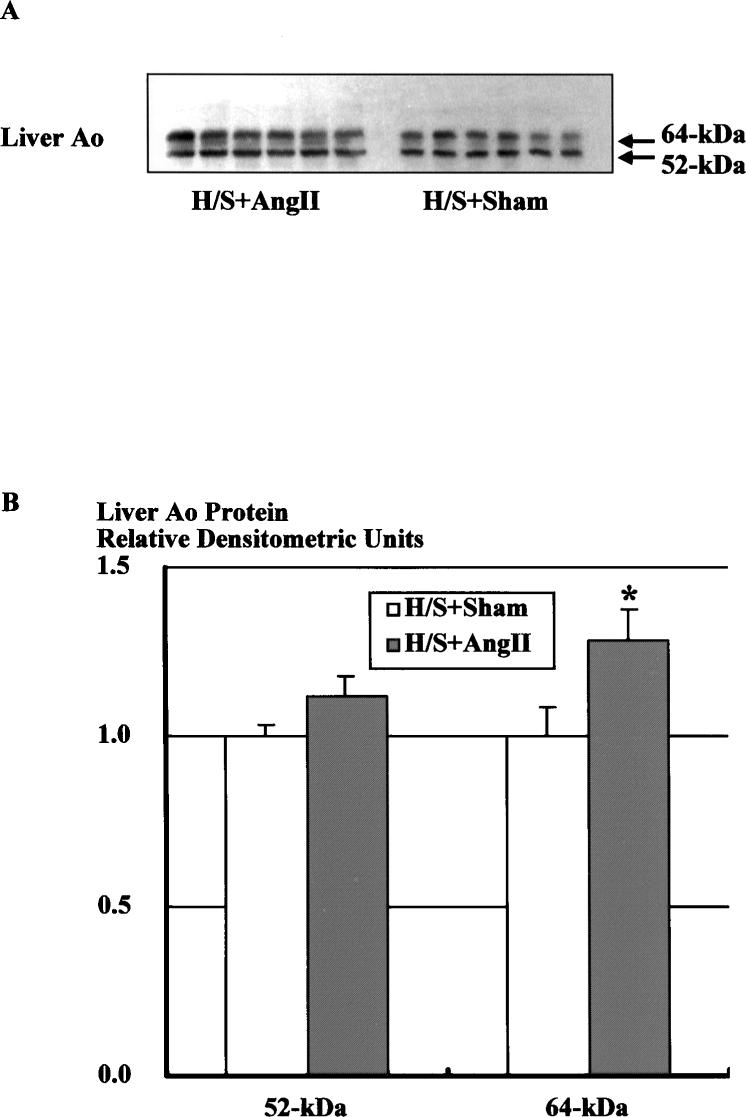
Western blot analysis of liver protein using the specific Ao polyclonal antibody showed 2 specific bands at 52 and 64 kDa (Figure 6A). This figure shows a representative Western blot of hepatic Ao protein (10 μg) from Ang II–infused (H/S+Ang II) and sham-operated (H/S+Sham) rats on a H/S diet. Densitometric analysis of the immunoreactive bands showed that Ang II infusion increased hepatic Ao protein levels for 64-kDa protein (Figure 6B, 1.28±0.09 versus 1.00±0.09); however, hepatic Ao protein levels for 52-kDa protein were not significantly increased (1.12±0.06 versus 1.00±0.03).
Figure 6.
Western blot analysis of hepatic protein using the specific Ao polyclonal antibody. A, Representative autoradiograph of hepatic Ao Western blot from Ang II–infused and sham-operated rats on a H/S diet. B, Densitometric analysis of the immunoreactive bands showed that Ang II infusion significantly increased hepatic Ao protein levels for 64-kDa protein; however, hepatic Ao protein levels for 52-kDa protein were not significantly increased. Similar observations were obtained from 2 other experiments. *P<0.05 vs H/S+Sham.
Discussion
Previous studies have shown that H/S intake suppresses Ao mRNA expression in the kidney13-15 and in the liver.14,27 It has also been reported that Ang II infusions enhance Ao mRNA in the kidney12,28 and in the liver.12,29 It has been difficult to demonstrate concomitant increases in the kidney Ao protein levels, however, even though kidney Ao mRNA was significantly increased.12 These results prompted further experiments to evaluate the stimulatory effect of Ang II on Ao mRNA and protein in rats maintained on a H/S diet. In agreement with previous studies, chronic low-dose infusions of Ang II produced significant elevations in systolic blood pressure,8,16-18 plasma Ang II levels,8,16-18 plasma Ao activity,17 and renal Ang II content8,16-18 despite marked suppression of plasma renin activity.8,16,17 As previously shown,30,31 lower doses of Ang II were needed to elicit equivalent increases in arterial pressure in rats fed a H/S diet. Using this model of initially suppressed Ao production by a H/S diet, we found that Ang II infusions significantly enhanced plasma Ao protein levels, kidney Ao mRNA and protein levels, and liver Ao mRNA and protein levels as compared with sham-operated rats fed a H/S diet.
In the present study, there were similar increases in kidney Ao mRNA (+86%) and in the protein (+88%). In the liver, however, the enhancement of Ao mRNA (2.9-fold) was not paralleled by equivalent increases in Ao protein (+12% for 52 kDa and +28% for 64 kDa). It is a possible mechanism that a major part of the Ao protein synthesized in the liver may not stay in the liver and may be constitutively released into the circulation. In agreement, circulating plasma Ao protein and Ao activity were also augmented in Ang II–infused rats.
Western blot analysis of kidney protein extracts showed 1 predominant immunoreactive band at 52 kDa, whereas liver protein extracts presented 2 bands at 52 and 64 kDa, respectively. In our previous study, Ang II infusion to rats fed a normal-salt diet significantly increased the 64-kDa form of Ao in the liver, but it did not alter the 52-kDa form of liver Ao protein.12 Similar results were obtained in the present study. These results suggest that the 52-kDa form of liver Ao protein is secreted constitutively, whereas the 64-kDa form of liver Ao protein may be secreted by a regulated mechanism. Although both forms were present in the plasma, the 52-kDa form was the predominant one. Further studies are needed to determine the different roles of these 2 circulating forms of Ao.
Several in vitro studies have demonstrated a positive Ang II feedback on Ao mRNA expression. Klett et al32 presented evidence that Ang II enhances hepatic Ao synthesis by inhibiting degradation of Ao mRNA in hepatocytes. Li and Brasier33 suggested that activation of Ao gene by Ang II is mediated by the nuclear factor–κB p65 transcription factor in hepatocytes. Tamura et al34 showed that Ang II activates transcription of Ao gene exclusively via the Ang II type 1 receptor pathway in cardiac myocytes. Mascareno et al35 showed that activation of the Ao promoter by Ang II depends on the signal transducers and activators of transcription protein-signal pathway in cardiac myocytes. However, less is known about the amplification mechanisms in renal tissues. Ingelfinger et al36 demonstrated a positive feedback of Ang II on Ao mRNA expression in an immortalized proximal tubular cell line. These findings support the concept that the elevated circulating Ang II concentration stimulates proximal tubules’ Ao mRNA levels, which may provide an enhanced angiotensin peptide–generating capability of the kidney in the Ang II–dependent hypertension model. However, previous studies have not specifically showed enhanced protein levels. The present study provides in vivo data that demonstrate the stimulatory effect of Ang II infusion not only on kidney and liver Ao mRNA levels but also on Ao protein. Our hypothesis that the enhancement of intrarenal Ao expression contributes to the chronic hypertension in the Ang II–infused model is also supported by genetic evidence. Sigmund and colleagues37 recently showed that double-transgenic mice that express both human renin systemically and human Ao intrarenally exhibit progressive hypertension. These animals express human Ao only in the proximal tubules and provide convincing genetic evidence that selective overexpression of Ao in proximal tubular cells results in chronic hypertension.
It is not readily apparent how increased Ao could cause augmented intrarenal Ang II in Ang II–dependent hypertension because renin formation is suppressed. However, the concentration of Ao is close to the Km for renin,33 so changes in either substrate or enzyme could influence the production of angiotensin peptides. Thus, increases in Ao could help to maintain Ang I levels in the presence of suppressed renin levels. The importance of the Ao production levels in controlling blood pressure was also shown by Smithies et al38 who demonstrated a relationship between Ao gene copy number and arterial blood pressure in transgenic mice. The sustained Ao levels are presumably responsible for continued intrarenal production of Ang I. These data help to explain the results of Zou et al17 who showed a dissociation between the plasma and the intrarenal Ang I levels in Ang II–infused rats. Chronic Ang II infusions markedly suppressed renin levels and predictably reduced circulating Ang I concentrations to barely detectable levels. Nevertheless, kidney Ang I contents were not significantly reduced in the Ang II–infused rats, demonstrating a sustained Ang I–generating capacity by the kidney, which may contribute importantly to the augmented intrarenal Ang II levels. Our data are consistent with the recent findings of Bohlender et al6 who demonstrate that transgenic offspring of rats overexpressing both the human Ao and human renin genes had elevated plasma renin activity and concentration and elevated blood pressure even though the human and rat renin genes were downregulated. The authors concluded that increased Ao concentrations decrease renin metabolic clearance rate, resulting in augmented Ang I levels independent of renin secretion and Ang II–mediated feedback.
In summary, Ang II infusion to rats fed a H/S diet elicited progressive hypertension and elevated intrarenal Ang II levels. We observed 1) enhanced kidney and liver Ao mRNA expression, 2) elevated kidney, plasma, and liver Ao protein levels; and 3) an increased plasma Ao activity. On the basis of the present and previous results, we conclude that there is enhanced Ao protein in the kidney as well as in the liver. Accordingly, the augmented intrarenal Ang II that occurs in Ang II–dependent hypertension may result, in part, from this apparently paradoxical enhancement of intrarenal production of Ao and Ang peptides in an environment of elevated circulating Ang II peptide. The concomitant increase in renal Ao protein along with Ao mRNA provides a firmer foundation for the hypothesis that enhanced intrarenal Ao production contributes to the increased intrarenal Ang II levels and thereby participates in the altered renal function that leads to the progressive development of hypertension in this model.
Acknowledgments
This work was supported by a National Heart, Lung, and Blood Institute grant (HL26371, L.G.N.). H.K. is supported by research fellowships form Yokoyama Clinical Pharmacology Foundation (1998) and Uehara Memorial Foundation (1999). L.M.H.-B. is a recipient of a Scientist Development Grant from the American Heart Association. The polyclonal antibody was generously provided by Conrad Sernia, PhD, University of Queensland, Australia.
References
- 1.Navar LG. The kidney in blood pressure regulation and development of hypertension. Med Clin North Am. 1997;81:1165–1198. doi: 10.1016/s0025-7125(05)70573-3. [DOI] [PubMed] [Google Scholar]
- 2.Kimura S, Mullins JJ, Bunnemann B, Metzger R, Hilgenfeldt U, Zimmermann F, Jacob H, Fuxe K, Ganten D, Kaling M. High blood pressure in transgenic mice carrying the rat angiotensinogen gene. EMBO J. 1992;11:821–827. doi: 10.1002/j.1460-2075.1992.tb05119.x. [DOI] [PMC free article] [PubMed] [Google Scholar]
- 3.Fukamizu A, Sugimura K, Takimoto E, Sugiyama F, Seo MS, Takahashi S, Hatae T, Kajiwara N, Yagami K, Murakami K. Chimeric renin-angiotensin system demonstrates sustained increase in blood pressure of transgenic mice carrying both human renin and human angiotensinogen genes. J Biol Chem. 1993;268:11617–11621. [PubMed] [Google Scholar]
- 4.Smithies O. A mouse view of hypertension. Hypertension. 1997;30:1318–1324. doi: 10.1161/01.hyp.30.6.1318. [DOI] [PubMed] [Google Scholar]
- 5.Ding Y, Davisson RL, Hardy DO, Zhu LJ, Merrill DC, Catterall JF, Sigmund CD. The kidney androgen-regulated protein promoter confers renal proximal tubule cell-specific and highly androgen-responsive expression on the human angiotensinogen gene in transgenic mice. J Biol Chem. 1997;272:28142–28148. doi: 10.1074/jbc.272.44.28142. [DOI] [PubMed] [Google Scholar]
- 6.Bohlender J, Menard J, Ganten D, Luft FC. Angiotensinogen concentrations and renin clearance: implications for blood pressure regulation. Hypertension. 2000;35:780–786. doi: 10.1161/01.hyp.35.3.780. [DOI] [PubMed] [Google Scholar]
- 7.Jeunemaitre X, Soubrier F, Kotelevtsev YV, Lifton RP, Williams CS, Charru A, Hunt SC, Hopkins PN, Williams RR, Lalouel JM. Molecular basis of human hypertension: role of angiotensinogen. Cell. 1992;71:169–180. doi: 10.1016/0092-8674(92)90275-h. [DOI] [PubMed] [Google Scholar]
- 8.Zou LX, Hymel A, Imig JD, Navar LG. Renal accumulation of circulating angiotensin II in angiotensin II–infused rats. Hypertension. 1996;27:658–662. doi: 10.1161/01.hyp.27.3.658. [DOI] [PubMed] [Google Scholar]
- 9.Navar LG, Harrison-Bernard LM. Intrarenal angiotensin II augmentation in angiotensin II dependent hypertension. Hypertens Res. 2000;23:291–301. doi: 10.1291/hypres.23.291. [DOI] [PubMed] [Google Scholar]
- 10.Mitchell KD, Navar LG. Intrarenal actions of angiotensin II in the pathogenesis of experimental hypertension. In: Laragh JH, Brenner BM, editors. Hypertension: Pathophysiology, Diagnosis and Management. 2nd ed. Raven Press; New York, NY: 1995. pp. 1437–1450. [Google Scholar]
- 11.Harrison-Bernard LM, El-Dahr SS, O'Leary DF, Navar LG. Regulation of angiotensin II type 1 receptor mRNA and protein in angiotensin II–induced hypertension. Hypertension. 1999;33:340–346. doi: 10.1161/01.hyp.33.1.340. [DOI] [PubMed] [Google Scholar]
- 12.Kobori H, Harrison-Bernard LM, Navar LG. Expression of angiotensinogen mRNA and protein in angiotensin II-dependent hypertension. J Am Soc Nephrol. 2001;12:431–439. doi: 10.1681/asn.v123431. [DOI] [PMC free article] [PubMed] [Google Scholar]
- 13.Ingelfinger JR, Pratt RE, Ellison K, Dzau VJ. Sodium regulation of angiotensinogen mRNA expression in rat kidney cortex and medulla. J Clin Invest. 1986;78:1311–1315. doi: 10.1172/JCI112716. [DOI] [PMC free article] [PubMed] [Google Scholar]
- 14.Sechi LA, Griffin CA, Giacchetti G, Valentin JP, Llorens-Cortes C, Corvol P, Schambelan M. Tissue-specific regulation of type 1 angiotensin II receptor mRNA levels in the rat. Hypertension. 1996;28:403–408. doi: 10.1161/01.hyp.28.3.403. [DOI] [PubMed] [Google Scholar]
- 15.Singh I, Grams M, Wang WH, Yang T, Killen P, Smart A, Schnermann J, Briggs JP. Coordinate regulation of renal expression of nitric oxide synthase, renin, and angiotensinogen mRNA by dietary salt. Am J Physiol. 1996;270:F1027–F1037. doi: 10.1152/ajprenal.1996.270.6.F1027. [DOI] [PubMed] [Google Scholar]
- 16.Von Thun AM, Vari RC, El-Dahr SS, Navar LG. Augmentation of intrarenal angiotensin II levels by chronic angiotensin II infusion. Am J Physiol. 1994;266:F120–F128. doi: 10.1152/ajprenal.1994.266.1.F120. [DOI] [PubMed] [Google Scholar]
- 17.Zou LX, Imig JD, Von Thun AM, Hymel A, Ono H, Navar LG. Receptor-mediated intrarenal angiotensin II augmentation in angiotensin II–infused rats. Hypertension. 1996;28:669–677. doi: 10.1161/01.hyp.28.4.669. [DOI] [PubMed] [Google Scholar]
- 18.Zou LX, Imig JD, Hymel A, Navar LG. Renal uptake of circulating angiotensin II in Val5-angiotensin II infused rats is mediated by AT1 receptor. Am J Hypertens. 1998;11:570–578. doi: 10.1016/s0895-7061(97)00410-x. [DOI] [PubMed] [Google Scholar]
- 19.Terada Y, Tomita K, Nonoguchi H, Marumo F. PCR localization of angiotensin II receptor and angiotensinogen mRNAs in rat kidney. Kidney Int. 1993;43:1251–1259. doi: 10.1038/ki.1993.177. [DOI] [PubMed] [Google Scholar]
- 20.Ohkubo H, Kageyama R, Ujihara M, Hirose T, Inayama S, Nakanishi S. Cloning and sequence analysis of cDNA for rat angiotensinogen. Proc Natl Acad Sci U S A. 1983;80:2196–2200. doi: 10.1073/pnas.80.8.2196. [DOI] [PMC free article] [PubMed] [Google Scholar]
- 21.Tso JY, Sun XH, Kao TH, Reece KS, Wu R. Isolation and characterization of rat and human glyceraldehyde-3-phosphate dehydrogenase cDNAs: genomic complexity and molecular evolution of the gene. Nucleic Acids Res. 1985;13:2485–2502. doi: 10.1093/nar/13.7.2485. [DOI] [PMC free article] [PubMed] [Google Scholar]
- 22.Kobori H, Ichihara A, Suzuki H, Miyashita Y, Hayashi M, Saruta T. Thyroid hormone stimulates renin synthesis in rats without involving the sympathetic nervous system. Am J Physiol. 1997;272:E227–E232. doi: 10.1152/ajpendo.1997.272.2.E227. [DOI] [PMC free article] [PubMed] [Google Scholar]
- 23.Thomas WG, Sernia C. Immunocytochemical localization of angiotensinogen in the rat brain. Neuroscience. 1988;25:319–341. doi: 10.1016/0306-4522(88)90029-2. [DOI] [PubMed] [Google Scholar]
- 24.Sernia C. Location and secretion of brain angiotensinogen. Regul Pept. 1995;57:1–18. doi: 10.1016/0167-0115(95)00015-4. [DOI] [PubMed] [Google Scholar]
- 25.Darby IA, Congiu M, Fernley RT, Sernia C, Coghlan JP. Cellular and ultrastructural location of angiotensinogen in rat and sheep kidney. Kidney Int. 1994;46:1557–1560. doi: 10.1038/ki.1994.445. [DOI] [PubMed] [Google Scholar]
- 26.Harrison-Bernard LM, Navar LG, Ho MM, Vinson GP, El-Dahr SS. Immunohistochemical localization of ANG II AT1 receptor in adult rat kidney using a monoclonal antibody. Am J Physiol. 1997;273:F170–F177. doi: 10.1152/ajprenal.1997.273.1.F170. [DOI] [PubMed] [Google Scholar]
- 27.Iwao H, Nakamura A, Fukui K, Kimura S, Tamaki T, Abe Y. Endogenous angiotensin II regulates hepatic angiotensinogen production. Life Sci. 1990;47:2343–2349. doi: 10.1016/0024-3205(90)90273-t. [DOI] [PubMed] [Google Scholar]
- 28.Schunkert H, Ingelfinger JR, Jacob H, Jackson B, Bouyounes B, Dzau VJ. Reciprocal feedback regulation of kidney angiotensinogen and renin mRNA expressions by angiotensin II. Am J Physiol Endocrinol Metab. 1992;263:E863–E869. doi: 10.1152/ajpendo.1992.263.5.E863. [DOI] [PubMed] [Google Scholar]
- 29.Nakamura A, Iwao H, Fukui K, Kimura S, Tamaki T, Nakanishi S, Abe Y. Regulation of liver angiotensinogen and kidney renin mRNA levels by angiotensin II. Am J Physiol Endocrinol Metab. 1990;258:E1–E6. doi: 10.1152/ajpendo.1990.258.1.E1. [DOI] [PubMed] [Google Scholar]
- 30.Sato Y, Ogata E, Fujita T. Role of chloride in angiotensin II–induced salt-sensitive hypertension. Hypertension. 1991;18:622–629. doi: 10.1161/01.hyp.18.5.622. [DOI] [PubMed] [Google Scholar]
- 31.Gorbea-Oppliger VJ, Fink GD. Clonidine reverses the slowly developing hypertension produced by low doses of angiotensin II. Hypertension. 1994;23:844–847. doi: 10.1161/01.hyp.23.6.844. [DOI] [PubMed] [Google Scholar]
- 32.Klett C, Nobiling R, Gierschik P, Hackenthal E. Angiotensin II stimulates the synthesis of angiotensinogen in hepatocytes by inhibiting adenylylcyclase activity and stabilizing angiotensinogen mRNA. J Biol Chem. 1993;268:25095–25107. [PubMed] [Google Scholar]
- 33.Li J, Brasier AR. Angiotensinogen gene activation by angiotensin II is mediated by the rel A (nuclear factor-κB p65) transcription factor: one mechanism for the renin angiotensin system positive feedback loop in hepatocytes. Mol Endocrinol. 1996;10:252–264. doi: 10.1210/mend.10.3.8833654. [DOI] [PubMed] [Google Scholar]
- 34.Tamura K, Umemura S, Nyui N, Hibi K, Ishigami T, Kihara M, Toya Y, Ishii M. Activation of angiotensinogen gene in cardiac myocytes by angiotensin II and mechanical stretch. Am J Physiol. 1998;275:R1–R9. doi: 10.1152/ajpregu.1998.275.1.R1. [DOI] [PubMed] [Google Scholar]
- 35.Mascareno E, Dhar M, Siddiqui MA. Signal transduction and activator of transcription (STAT) protein- dependent activation of angiotensinogen promoter: a cellular signal for hypertrophy in cardiac muscle. Proc Natl Acad Sci U S A. 1998;95:5590–5594. doi: 10.1073/pnas.95.10.5590. [DOI] [PMC free article] [PubMed] [Google Scholar]
- 36.Ingelfinger JR, Jung F, Diamant D, Haveran L, Lee E, Brem A, Tang SS. Rat proximal tubule cell line transformed with origin-defective SV40 DNA: autocrine ANG II feedback. Am J Physiol. 1999;276:F218–F227. doi: 10.1152/ajprenal.1999.276.2.F218. [DOI] [PubMed] [Google Scholar]
- 37.Davisson RL, Ding Y, Stec DE, Catterall JF, Sigmund CD. Novel mechanism of hypertension revealed by cell-specific targeting of human angiotensinogen in transgenic mice. Physiol Genomics. 1999;1:3–9. doi: 10.1152/physiolgenomics.1999.1.1.3. [DOI] [PubMed] [Google Scholar]
- 38.Smithies O, Kim HS. Targeted gene duplication and disruption for analyzing quantitative genetic traits in mice. Proc Natl Acad Sci U S A. 1994;91:3612–3615. doi: 10.1073/pnas.91.9.3612. [DOI] [PMC free article] [PubMed] [Google Scholar]


