

Abstract
Vasculitis (angiitis) is a systemic autoimmune disease that often causes fatal symptoms. We aimed to isolate cDNA markers that would be useful for diagnosing not only vasculitis but also other autoimmune diseases. For this purpose, we used stepwise subtractive hybridization and cDNA microarray analyses to comprehensively isolate the genes whose expressions are augmented in peripheral blood mononuclear cells (PBMCs) pooled from vasculitis patients. Subsequently, we used quantitative real-time polymerase chain reaction (qRT–PCR) to examine the mRNA levels of each candidate gene in individual patients. These analyses indicated that seven genes exhibit remarkably augmented expression in many vasculitis patients. Of these genes, we analyzed G0/G1 switch gene 2 (G0S2) further because G0S2 expression is also enhanced in the PBMCs of patients with systemic lupus erythematodes (SLE). We generated G0S2 transgenic mice that ubiquitously overexpress human G0S2. Although we did not observe any obvious vasculitis-related histopathologic findings in these mice, these mice are unhealthy as they produce only few offspring and showed elevated serum levels of two autoimmunity-related antibodies, anti-nuclear antibody, and anti-double strand DNA antibody. Thus, our large-scale gene profiling study may help finding sensitive and specific DNA markers for diagnosing autoimmune diseases including vasculitis and SLE.
Key words: vasculitis, angiitis, G0S2, EGR1, amphiregulin, hemoglobin delta
1. Introduction
There are ∼10 different disorders that are classified as vasculitis (also known as angiitis). Vasculitis is a systemic autoimmune disease characterized by the chronic inflammation of systemic blood vessels, veins, and arteries of all types and sizes. This often causes symptoms that can rapidly induce death, such as the formation of blood clots (thrombosis), restriction of oxygenated blood supply (ischemia), and irreversible injury to affected organs.1 Although immune system disturbances appear to be the main cause of the disease, the pathogenesis of vasculitis is not fully understood. The diagnosis and treatment of vasculitis was recently greatly aided by the observation that three vasculitis disorders, namely Wegener's granulomatosis (WG), microscopic polyangiitis (MPA), and Churg–Strauss syndrome (CSS), are characterized by the presence of circulating antineutrophil cytoplasmic antibodies (ANCAs).2,3 Two different types of ANCA have been identified. C-ANCA targets proteinase-3 and is most frequently found in WG, whereas P-ANCA, which targets myeloperoxidase, is most frequently detected in MPA and CSS. Consequently, enzyme immunosorbent assays (EIA) that examine the ability of patient serum to bind to these enzymes can be used to diagnose WG, MPA, and CSS. However, diagnoses made on the basis of positive EIAs will still need to be confirmed by biopsies. Moreover, many other vasculitis disorders are not characterized by the presence of ANCAs. Thus, the diagnosis of vasculitis disorders requires the identification of more convenient and generally applicable diagnostic markers. The identification of these markers may also provide insights into the pathogenesis behind this disorder and improve the therapy of vasculitis.
We have isolated putative gene markers that are characteristic to the autoimmune diseases, such as systemic lupus erythematodes (SLE)4 and rheumatoid arthritis (RA)5, using peripheral blood mononuclear cells (PBMCs). Here, we sought to identify new gene markers that can distinguish the autoimmune disease, in particular vasculitis, from other diseases with high specificity when PBMCs serve as the sample. For this purpose, we used the stepwise subtraction technique6 and high-density oligonucleotide microarrays to isolate those genes that show dramatically upregulated expression commonly in the pooled PBMC mRNAs of varieties of vasculitis patients regardless of the patient's symptom, active, or inactive phase when compared with normal volunteer PBMC mRNAs. To identify the genes that are upregulated in many vasculitis patients, we selected and mixed the PBMC mRNAs from patients with one of the following seven vasculitis disorders: WG, MPA, Takayasu's arteritis (TA), allergic granulomatous angiitis (AGA), malignant RA (MRA = rheumatoid vasculitis), giant cell arteritis (GCA), and polyarteritis nodosa (PN). We found that the following seven genes are commonly unpregulated in the PBMCs of many of these vasculitis patients regardless of their symptoms: early growth response 1 (EGR1), G0/G1 switch gene 2 (G0S2), hemoglobin delta (HBD), amphiregulin (also known as AREG), interleukin-1 receptor type II (IL1R2), calgranulin C, and a novel gene named TVAS10. Of these genes, we selected G0S2 for further analysis because its physiological functions are poorly understood. We prepared anti-G0S2 antibodies and then generated G0S2 transgenic mice and examined their phenotype. We propose that the vasculitis gene markers we identified here may be useful for the future diagnosis of vasculitis.
2. Materials and methods
2.1. Human subjects and ethical considerations
All systemic vasculitis patients used in this study were diagnosed according to a previously documented proposal (the ACR criteria and the CHCC criteria).1 This study was reviewed and approved by the Internal Review Board of the Research Institute for Microbial Diseases, Osaka University. Accordingly, written informed consent was obtained from all participants before their PBMCs were obtained. Serum samples were consecutively obtained regardless of the patient's symptom, active, or inactive phase.
2.2. Statistical analysis
Significant differences were determined by using Mann–Whitney U-test (Figs. 1 and 2B, Supplementary Fig. S1). The data are expressed as means ± SE. P-value of <0.05 or <0.01 was considered to be statistically significant.
Figure 1.

mRNA expression of selected TAS/TAC genes in the PBMCs from individual vasculitis patients and normal volunteers. qRT–PCR analyses show that (A) EGR1 (TAC-1), (B) G0S2 (TAC-40), (C) HBD (TAC-106), (D) Amphiregulin (TAC-9), and (E) TVAS10 (TAC-30) are generally upregulated in the PBMCs of vasculitis patient (circles) but not in the PBMCs of normal volunteers (triangles). Each symbol denotes the mean value of a sample analyzed in triplicate. The leftmost filled circle signifies an RNA sample from the PBMCs of a healthy volunteer (male, age 52), which was used as a standard sample and whose expression level was set to 1.0. It allowed us to compare all of the expression profiles tested in this study. Average ± SE values of the vasculitis patient and normal volunteer groups are shown in the right-hand graphs and differ significantly (P < 0.01).
Figure 2.

Family tree of G0S2 transgenic mice. (A) Of the 61 mice tested in the first trial, six G0S2 transgenic mouse lines were generated. They all died except for the GTG1b line, which was not useful for further analysis because the human G0S2 gene was introduced on the Y chromosome; consequently, this mouse only produced male G0S2 transgenic mice. (B) Of the 22 mice tested in the third trial, three G0S2 transgenic mouse lines were generated. The only surviving GTG3a line is now under large scale propagation to establish a strain.
2.3. Transgene vector construction and production of G0S2 transgenic mice
To construct the transgene vector pCX-G0S2, the human G0S2 ORF was cloned from a SLE cDNA library4 by PCR with the EcoRI site-bearing primers G0S2-EcoRI-5'F (5'-TATGAATTCGCCACCATGGAAACGGTCCAGGAGCTGATC-3') and G0S2-EcoRI-3'R (5'-ATAGAATTCCTAGGAGGCGTGCTGCCGGTTGGAC-3'). The G0S2-EcoRI-5'F primer contains the Kozak sequence ahead of the start codon of G0S2 cDNA, whereas the G0S2-EcoRI-3'R primer contains the stop codon of G0S2 cDNA. The sequence of the amplified product was confirmed by DNA sequencing. As previously described,7 the EcoRI-digested fragment of the amplified G0S2 ORF was inserted into the EcoRI site of the pCAGGS expression vector, which possesses a chicken β-actin promoter and a cytomegalovirus enhancer (CMV-IE enhancer). The resulting construct was designated pCX-G0S2. To prepare the G0S2 fragment bearing the chicken β-actin promoter and the CMV-IE enhancer for injection into fertilized eggs, the SalI/HindIII fragment of pCX-G0S2 was purified by electrophoresis and agarose gel extraction. The G0S2 transgenic embryos and mice were generated according to previously described protocols.7 Briefly, the purified DNA fragments were injected into B6D2F1× B6D2F1 fertilized eggs. The incorporation of the transgene was examined by the genomic PCR analysis using DNA extracted from the tail and the pCX-G0S2-1685F (5'-GCTGGTTGTTGTGCTGTCTCATCA-3') and pCX-G0S2-2161R (5'-GCCAGAAGTCAGATGCTCAAGGGGCTTCA-3') primers. The PCR conditions involved TaKaRa Ex Taq polymerase (Takara, Shiga, Japan) and a pre-heating step (95°C for 2 min), 30 reaction step cycles (95°C for 30 s, 58°C for 30 s, 72°C for 1 min), and a final elongation step (72°C for 5 min). The founder mice were mated with C57BL/6 mice and both the transmittance of the transgene and the successful expression of human G0S2 protein were examined by western blot analysis of total cell extracts of mouse tails using one of the anti-G0S2 monoclonal antibodies (clone #3-1) we generated (see section 3.4 and Supplementary Fig. S2).
2.4. Histological examination
C57BL/6 mice were purchased from Japan SLC (Hamamatsu, Japan). Mouse tissues were fixed immediately after removal with 4% paraformaldehyde, then embedded in paraffin, and cut into sections (4 µm thick). Some sections were stained with hematoxiln and eosin according to standard procedures, whereas others were stained with the clone #3-1 monoclonal anti-G0S2 antibody according to the previously described procedure.8 To evaluate the immunostain, sections of the same organs from G0S2-TG and C57BL/6 mice were processed at the same time. When the immunoreactive signals in the former sections were substantially stronger than those in the latter, they were considered to indicate the exogenic G0S2 proteins produced from the transgene.
2.5. In situ hybridization
Sections were processed in the Genostaff laboratory (Tokyo, Japan) by using the DIG RNA labeling and detection kits (Roche Diagnostics, Mannheim, Germany). Briefly, G0S2 antisense and sense (negative control) RNA probes were prepared by in vitro transcription of the pBluescript vector containing the full-length human G0S2 cDNA according to the manufacturer's instructions. Hybridized signals were colored blue with 4-nitro blue tetrazolium chloride and 5-bromo-4-chloro-3-indolyl-phosphate as a substrate of alkaline phosphatase. The sense probe did not yield any significant stains. Further information concerning the in situ hybridization (ISH) method is available on request.
2.6. Serologic examination
Approximately 200 µl of peripheral blood per mouse were collected from the orbital plexus under anesthesia and were left for 1 h to coagulate. After centrifugation, ∼20 µl sera were obtained. The sera were frozen at −20°C and sent to the Mitsubishi Kagaku BCL laboratory (Tokyo, Japan), where each serum was diluted 500 times and analyzed for the levels of anti-nuclear and anti-double strand (ds) DNA antibodies by fluorescent antibody tests or enzyme immunoassays.
3. Results
3.1. Identification of vasculitis-specific genes by stepwise subtraction and DNA microarray analysis
To isolate the putative vasculitis-specific genes that are commonly upregulated in the PBMCs of vasculitis patients, we first used our stepwise subtractive hybridization method. PBMC samples were obtained from vasculitis patients (50 patients in total) regardless of the patient's symptom, active, or inactive phase, and a cDNA library was prepared from their pooled mRNAs by the linker-primer method using a pAP3neo vector.9 Stepwise subtractive hybridization was then performed using the biotinylated pooled mRNAs from the PBMCs of eight normal volunteers, as described previously.6 This generated a library of genes that are upregulated in only vasculitis PBMCs. To examine whether these genes are actually upregulated in vasculitis but not normal PBMCs, we performed northern blot analysis using the pooled mRNAs from the vasculitis and normal PBMCs (Fig. 3A). For the cDNA clones whose expression levels were too low for detection by northern blot analysis, we examined their expression in vasculitis and normal PBMCs by RT–PCR (Fig. 3B). The 29 genes that were confirmed to be upregulated in vasculitis patients were called TAS after transcript augmented in vasculitis isolated by stepwise-subtraction. The TAS genes and their accession numbers are summarized in Table 1.
Figure 3.

mRNA expression levels of the TAS genes. Individual TAS genes were subjected to northern blot (A) or RT–PCR (B) analysis to confirm they are upregulated in the PBMCs of 50 vasculitis patients (A) but not in the PBMCs of eight normal volunteers (N). Table 1 provides the names of the TAS genes. GAPDH was also analyzed as a loading control. The annealing temperature for RT–PCR was always 58°C and amplification occurred over 30 cycles. The sequences of the primers used to identify the TAS genes are presented in Supplementary Table S1.
Table 1.
List of stepwise subtraction identified TAS genes that show upregulated expression in vasculitis patient PBMCs
| Gene name | Accession number | Sequence description |
|---|---|---|
| TAS1-120 | AK091533 | Unknown (sapiens cDNA FLJ34214) = TVAS1 |
| TAS1-126 | NM_006013 | Ribosomal protein L10 (RPL10) |
| TAS1-137 | AC007318 | Unknown (AL049356) = TVAS2 |
| TAS1-140 | BC033089 | Lipocalin 2 (oncogene 24p3) |
| TAS1-149 | BC008684 | Similar to splicing factor, arginine/serine-rich (MGC:9742) |
| TAS1-160 | NM_016304 | Unknown (C15orf15) = TVAS3 |
| TAS1-198 | BC010878 | ASF1 anti-silencing function 1 homolog A |
| TAS1-267 | BC042436 | Unknown (IMAGE:4471726) = TVAS4 |
| TAS1-377 | AY275537 | Unknown (isolate 183 mitochondrion) = TVAS5 |
| TAS2-047 | BC047681 | S100 calcium binding protein A9 (calgranulin B) |
| TAS2-078 | NM_004417 | Dual specificity phosphatase 1 (DUSP1) |
| TAS2-097 | D89974 | Glycosylphosphatidyl inositol-anchored protein GPI-80 |
| TAS3-032 | NM_015384 | Nipped-B homolog (Drosophila) (NIPBL) |
| TAS3-039 | NM_001030 | Ribosomal protein S27 (metallopanstimulin 1) (RPS27) |
| TAS3-046 | BC000927 | Poly(A) polymerase alpha |
| TAS3-047 | NM_000517 | Hemoglobin, alpha 2 (HBA2) |
| TAS3-053 | NM_004633 | Interleukin 1 receptor, type II (IL1R2)(AY124010) |
| TAS3-062 | BC000163 | Vimentin |
| TAS3-076 | BC064910 | Beta-2-microglobulin |
| TAS3-079 | BC001429 | Annexin A5 |
| TAS3-112 | AY195792 | Unknown (haplotype As9Y mitochondrion) = TVAS6 |
| TAS3-133 | NM_005870 | Sin3-associated polypeptide, 18kDa (SAP18) |
| TAS3-135 | BC018183 | NADH dehydrogenase (ubiquinone) 1 beta subcomplex |
| TAS4-011 | CR611844 | Unknown (CS0DL007YO12 of B cells) = TVAS7 |
| TAS1-171 | AY260957 | Insulin-like growth factor 1 (somatomedin C) (IGF1) |
| TAS1-191 | NM_005621 | S100 calcium-binding protein A12 (calgranulin C) |
| TAS1-272 | NM_003805 | CASP2 and RIPK1 domain containing adaptor with death domain (CRADD) |
| TAS1-274 | NM_004592 | Splicing factor, arginine/serine-rich 8 (SFRS8) |
| TAS1-301 | BC062616 | Protein serine kinase H1 |
To increase the number of putative vasculitis-specific genes, we also performed a genome-wide complementary DNA microarray analysis using the Agilent Hu44K array with the same pooled vasculitis and normal PBMC RNA samples. When we tested the top 402 genes from the microarray list of vasculitis-upregulated genes (data not shown) by RT–PCR, we identified 63 genes whose expression levels are dramatically upregulated in vasculitis patient PBMCs (Fig. 4). We called them TAC after transcript augmented in vasculitis isolated by cDNA-microarray. The TAC genes and their accession numbers are summarized in Table 2. Dual specificity phosphatase 1 (DUSP1) and IL1R2 were identified by both methods. Of the 92 TAS and TAC genes, 30 genes are uncharacterized genes. These are designated as TVAS after transcript increased in vasculitis.
Figure 4.

mRNA expression levels of the TAC genes. Individual TAC genes were subjected to RT–PCR analysis to confirm they are upregulated in the PBMCs of 50 vasculitis patients (A) but not in the PBMCs of eight normal volunteers (N). GAPDH was also analyzed as a loading control. The annealing temperature and amplification cycles for RT–PCR were always 50°C and 35 cycles, respectively, with the exception of the reactions denoted by a (55°C, 40 cycles), b (50°C, 30 cycles), c (58°C, 27 cycles), d (50°C, 40 cycles), and e (58°C, 30 cycles). The sequences of the primers used to identify the TAS genes are presented in Supplementary Table S1.
Table 2.
List of microarray identified TAC genes that show upregulated expression in the PBMCs of vasculitis patients
| Gene name | Accession number | Sequence description |
|---|---|---|
| TAC-1 | NM_001964 | Early growth response 1 (EGR1) gene product |
| TAC-2 | AK025198 | Unknown (FLJ21545) = TVAS8 |
| TAC-3 | NM_000584 | Interleukin 8 (IL8) |
| TAC-9 | NM_001657 | Amphiregulin |
| TAC-14 | NM_003596 | Tyrosylprotein sulfotransferase 1 (TPST1) |
| TAC-19 | NM_004633 | Interleukin 1 receptor, type II (IL1R2) |
| TAC-28 | NM_000715 | Complement component 4 binding protein, alpha (C4BPA) |
| TAC-29 | NM_017762 | Unknown (FLJ20313) = TVAS9 |
| TAC-30 | NM_144590 | Unknown (ankyrin repeat domain 22: MGC22805) = TVAS10 |
| TAC-31 | BC013734 | Prostaglandin-endoperoxide synthase 2 |
| TAC-36 | AB044805 | 6-phosphofructo-2-kinase heart isoform |
| TAC-37 | NM_001511 | Chemokine (C-X-C motif) ligand 1 (CXCL1) |
| TAC-40 | NM_015714 | G0/G1 switch gene 2 (G0S2) |
| TAC-43 | NM_004545 | NADH dehydrogenase (ubiquinone) 1 beta (NDUFB1) |
| TAC-47 | NM_080657 | Viperin (cig5) |
| TAC-54 | BC029495 | Unknown (MGC:33104) = TVAS11 |
| TAC-55 | AF249277 | Cervical cancer suppressor-1 |
| TAC-61 | BC065737 | Unknown (IMAGE:30404477) = TVAS12 |
| TAC-64 | NM_000032 | Aminolevulinate, delta-, synthase 2 (ALAS2) |
| TAC-77 | NM_000661 | Ribosomal protein L9 (RPL9) |
| TAC-78 | NM_004233 | CD83 antigen (immunoglobulin superfamily) |
| TAC-84 | X60364 | ALAS mRNA for 5-aminolevulinate synthase precursor |
| TAC-85 | AK098605 | Unknown (FLJ25739) = TVAS13 |
| TAC-89 | NM_004833 | Absent in melanoma 2 (AIM2) |
| TAC-91 | NM_001738 | Carbonic anhydrase I (CA1) |
| TAC-102 | NM_005143 | Haptoglobin (HP) |
| TAC-106 | BQ446275 | Hemoglobin delta (HBD) |
| TAC-115 | NM_182522 | TAFA4 protein (TAFA4) |
| TAC-118 | L03419 | Fc-gamma receptor I B1 |
| TAC-127 | NM_007115 | Tumor necrosis factor, alpha-induced protein 6 (TNFAIP6) |
| TAC-141 | BX537874 | Unknown (DKFZp313P036) = TVAS14 |
| TAC-167 | BQ674642 | Unknown = TVAS15 |
| TAC-172 | AL390162 | Unknown (DKFZp761A1916) = TVAS16 |
| TAC-190 | NR_001459 | Unknown (C14orf62) = TVAS17 |
| TAC-191 | NM_002983 | Chemokine (C-C motif) ligand 3 (CCL3) |
| TAC-226 | BC031359 | Unknown (IMAGE:4778855) = TVAS18 |
| TAC-229 | NM_002064 | Glutaredoxin (thioltransferase) (GLRX) |
| TAC-234 | NM_000963 | Prostaglandin G/H synthase and cyclooxygenase (PTGS2) |
| TAC-236 | NM_001124 | Adrenomedullin (ADM) |
| TAC-237 | NM_014320 | Heme-binding protein 2 (HEBP2) |
| TAC-242 | AW901958 | Unknown = TVAS19 |
| TAC-252 | NM_003096 | Small nuclear ribonucleoprotein polypeptide G (SNRPG) |
| TAC-261 | NM_014879 | G protein-coupled receptor 105 (GPR105) |
| TAC-266 | BC032663 | Phorbol-12-myristate-13-acetate-induced protein 1 |
| TAC-269 | BC032480 | Unknown (IMAGE:5214272) = TVAS20 |
| TAC-273 | NM_182619 | Secretory protein LOC348174 (LOC348174) |
| TAC-274 | NM_012472 | Testis specific leucine rich repeat protein (TSLRP) |
| TAC-275 | AX721252 | Unknown (Patent WO0220754) = TVAS21 |
| TAC-287 | NM_032412 | Putative nuclear protein (ORF1-FL49) |
| TAC-295 | NM_024850 | Butyrophilin-like 8 (BTNL8) |
| TAC-302 | BC005984 | Unknown (IMAGE:4247211) = TVAS22 |
| TAC-304 | NM_033655 | Unknown = TVAS23 |
| TAC-307 | BC042517 | Unknown (IMAGE:4822953) = TVAS24 |
| TAC-321 | AL831953 | Unknown (DKFZp667P0410) = TVAS25 |
| TAC-322 | AK128746 | Unknown (FLJ44672) = TVAS26 |
| TAC-324 | AF067801 | Unknown (HDCGC21P) = TVAS27 |
| TAC-330 | D86962 | Unknown (KIAA0207) = TVAS28 |
| TAC-343 | NM_004417 | Dual specificity phosphatase 1 (DUSP1) |
| TAC-353 | M64109 | Udulin 2 |
| TAC-357 | BC053669 | Unknown (IMAGE:6146402) = TVAS29 |
| TAC-374 | NM_016220 | Zinc finger protein (ZFD25) |
| TAC-389 | NM_001955 | Endothelin 1 (EDN1) |
| TAC-398 | NM_020995 | Haptoglobin-related protein (HPR) |
| TAC-401 | NM_001161 | Nudix (nucleoside diphosphate linked moiety X)-type motif 2 (NUDT2) |
| TAC-402 | AY358224 | Unknown (UNQ9368) = TVAS30 |
3.2. Expression profiles of vasculitis-upregulated genes in individual patients
To determine whether these vasculitis-specific candidate genes are indeed upregulated in patients suffering from WG, MPA, TA, AGA, MRA, GCA, or PN and thus are general markers of vasculitis, we subjected 25 of the TAS and TAC genes (underlined in Tables 1 and 2) to quantitative RT–PCR (qRT–PCR) using PBMC RNA samples from indicated numbers of individual vasculitis patients and normal volunteers as negative controls (Fig. 1 and Supplementary Fig. S1). In every qRT–PCR, a standard RNA (denoted as normal with a relative intensity of 1.0) from the PBMCs of a healthy volunteer (male, age 52) was used (see the leftmost filled circle in Fig. 1A–E); this allowed us to compare the expression profiles of the genes tested in this study. It also allowed us to compare the expression profiles of the genes in this study with those of other genes tested in our previous studies on SLE4 and RA.5 With this experiment, we expected to isolate those genes that are highly expressed not only in many vasculitis patients but also in patients with SLE4 and RA;5 the identification of such marker genes may be useful as sensitive and specific diagnostic tools.
Of the 25 TAS/TAC genes tested, TAC-1 [early growth responses 1 (EGR1)] was one of the most strongly upregulated genes commonly in the PBMCs of many vasculitis patients, as 96% of patients expressed this gene at 3–300-fold higher levels than healthy volunteers (Fig. 1A). EGR1 encodes a zinc finger transcription factor whose expression is induced within minutes upon the reception of growth stimuli; its expression then decays within a few hours. It promotes cellular differentiation along a macrophage lineage.10 It also plays a critical role in the response to both acute and chronic vascular stress by inducing the expression of several gene products linked to cellular perturbation. This is particularly true for the cellular perturbation in the vasculature that is induced by hypoxia, ischemia/reperfusion, atherosclerosis, and acute vascular injury.11 It remains unclear whether the induction of EGR1 in vasculitis is a pathogenic response or merely results from vascular stress. Nonetheless, EGR1 may serve as a gene marker for the diagnosis of vasculitis.
TAC-40 (G0S2) is a lymphocyte G0/G1 switch gene that encodes a putative cell cycle inhibitor whose expression may be required before cells become committed to enter the G1 phase of the cell cycle.12 Nearly, half of the vasculitis patients showed >20-fold increased expression, whereas the expression of most of the normal volunteers was much lower (Fig. 1B). Notably, relative to healthy controls, G0S2 expression is also enhanced in the PBMCs from patients with other autoimmune diseases, namely SLE4 and RA.5 Microarray and qRT–PCR analyses also showed that G0S2 is upregulated in the PBMCs from psoriasis patients suffering from severe generalized disease.13 Thus, it may be interesting to analyze G0S2 further, as it may shed light on the pathogenesis of vasculitis at the molecular level (see below).
Nearly 77% of the vasculitis patients expressed 3–16-fold more TAC-106 (HBD) mRNA than the normal volunteers (Fig. 1C). HBD is a minor type of hemoglobin (it makes up only 2–3% of adult hemoglobin) that forms a complex with α-hemoglobin called hemoglobin A2 (α2δ2).14 Although high HbA2 levels are diagnostic for the β-thalassemia trait, its relevance to vasculitis pathology is unknown. Nonetheless, it may be useful as a diagnostic gene marker for vasculitis.
Amphiregulin is one of the epidermal growth factor (EGF)-like growth factors that stimulate cell growth by activating the EGF receptor signaling of target cells in an autocrine/juxtacrine fashion.15 We previously reported that Amphiregulin expression is enhanced in the PBMCs of some patients with SLE4 and RA.5 However, compared with SLE and RA patients, a far smaller proportion of vasculitis patients show enhanced Amphiregulin expression (Fig. 1D). Thus, Amphiregulin may be more significant as a DNA marker for SLE and RA than for vasculitis.
TAC30 (=TVAS10) encodes an uncharacterized novel protein that is composed primarily of an ankyrin repeat, which is one of the most frequently observed amino-acid motifs and is important for protein–protein interactions.16 About a half of the vasculitis patients showed 10–200-fold increased expression of TAC30, whereas healthy volunteers showed very low expression except for one case (Fig. 1E).
Interleukin-1 (IL1), a principal macrophage-derived cytokine, plays a pivotal role in the immuno-inflammatory process by triggering cell activation via its type I receptor (IL1R1); in contrast, its type II receptor (IL1R2) lacks the intracellular domain for IL1 signaling and functions as a potent, specific, and natural inhibitor of IL1 by acting as a decoy receptor.17 About half of the vasculitis patients showed 20–50-fold IL1R2 expression (one patient showed ∼300-fold expression), whereas healthy volunteers showed very low expression except for one case (Supplementary Fig. S1A). This increased expression of IL1R2 may be related to the vascular inflammation of the vasculitis patients.
Three phagocyte-specific S100 proteins called calgranulin- A, -B, and -C act separately during calcium-dependent signaling. In particular, TAS1-191 (calgranulin C) secretion by tumor necrosis factor (TNF)- stimulated granulocytes causes target cell activation that results in the upregulated expression of proinflammatory cytokines such as TNF and IL1β; the TNF that is released may then stimulate granulocytes to secrete more calgranulin C, thereby establishing a self-amplifying positive feedback loop.18 About 30% of vasculitis patients showed 10–50-fold calgranulin C expression (one patient showed ∼150-fold expression), whereas most of the healthy volunteers showed low expression (Supplementary Fig. S1B). In contrast, the vasculitis patients and normal volunteers did not differ in their expression of calgranulin B (TAS2-047) (data not shown).
3.3. Expression pattern of TAS/TAC genes in PBMC
We previously reported that G0S2 was primarily expressed in monocytes, whereas Amphiregulin was expressed in both monocytes, T cells and B cells by performing RT–PCR on multiple-tissue cDNA panels (MTC) from Clontech (Palo Alto, CA).5 To determine whether EGR1, HBD, TVAS10, IL1R2, and calgranulin C are also expressed in particular human blood cells, we conducted similar experiments. As shown in Fig. 5, EGR1 and IL1R2 were expressed ubiquitously in all lanes, albeit with varying intensities. cDNA from placenta, which also contains many blood cells, served as a control. All genes except calgranulin C were strongly expressed in activated CD4+ T cells (lane 8) and weakly expressed in activated mononuclear cells (aMNCs) (lane 7). Only EGR1 and TVAS10 were expressed in activated CD8+ T (lane 9) cells. EGR1, TVAS10, IL1R2, and calgranulin C were expressed in resting CD8+ T cells (T-suppressor/cytotoxic; lane 2) and monocytes (lane 4). These observations together indicate that these vasculitis-upregulated genes have similar expression profiles. Unfortunately, we could not perform this analysis on vasculitis patients because of the low numbers of PBMCs that we could obtain from the patients.
Figure 5.

Determination of the human blood cells that express EGR1, HBD, TVAS10, IL1R2, and calgranulin C (Cal C). RT–PCR was performed by using the multiple-tissue cDNA panel for human blood fractions (MTC, Clontech). GAPDH was also amplified as a loading control. PCR amplifications were conducted at 50°C over 33 cycles except as indicated at the right of the panels by # (50°C over 30 cycles). Lane 1, mononuclear cells (B, T cells, and monocytes). Lane 2, resting CD8+ cells (T-suppressor/cytotoxic cells). Lane 3, resting CD4+ cells (T-helper/inducer). Lane 4, resting CD14+ cells (monocytes). Lane 5, resting CD19+ cells (B cells). Lane 6, activated CD19+ cells (aCD10 +). Lane 7, activated mononuclear cells (aMNC). Lane 8, activated CD4+ cells (aCD8 + ). Lane 9, activated CD8+ cells. Lane 10, human placenta, which also includes many blood cells. The latter lane served as a control.
3.4. Preparation of transgenic mice that overexpress G0S2
We selected G0S2 for further analysis because little is known about its physiological significance and function. To explore the physiological significance of G0S2, we prepared transgenic mice that overexpress the human gene for G0S2. For this purpose, we constructed plasmid DNA in which human G0S2 cDNA lies directly downstream of the beta-actin promoter, as described previously.7 This construct was used to generate transgenic mouse lines that express human G0S2 protein in all tissues. The successful generation of these transgenic mice was confirmed by PCR and/or western blot analysis using DNA or cell extracts obtained from the tail. Expression of G0S2 protein was confirmed by the monoclonal antibody (#3-1) we prepared here (see Supplementary Result and Fig. S2). Although the transgenic mice did not exhibit an obvious phenotype, they seemed to be unhealthy as they did not produce large numbers of offspring. This made it very difficult to establish this transgenic mouse line. For example, in the first attempt to generate this line, 61 mice were tested by PCR for expression of human G0S2. Of these, three female and three male mice were found to bear the transgene (GTG1a-f, see Fig. 2). However, the GTG1f female mouse died soon after birth and the GTG1e female and GTG1c male mice died 3 and 1 months after birth, respectively (Supplementary Fig. S4A). Moreover, while the surviving female transgenic mouse (GTG1d) produced one female transgenic mouse, which safely grew to adulthood, the mother died during her next pregnancy. Her daughter also died during her first pregnancy. In addition, the surviving male mouse GTG1b only produced male transgenic mice when mated with wild-type B6 female mice because the human G0S2 gene was introduced into the Y chromosome. Thus, this mouse could not be used further. Furthermore, the remaining surviving male mouse, GTG1a, did not produce transgenic mouse when mated with wild-type B6 female mice. Thus, we failed to establish a human G0S2-expressing transgenic strain in this trial. The second trial did not generate any transgenic mice. However, in the third trial, of the 22 mice examined by PCR (Fig. 6A) and western blot analysis (Fig. 6B), we found three transgenic mice, of which one (GTG3a) produced offspring (see Supplementary Fig. S4B). These mice appear to be healthier than the other transgenic mice and consequently we have been able to maintain this line probably due to lower G0S2 levels than other transgenic mice. Thus, the exogenous and ubiquitous overexpression of human G0S2 seems to make the transgenic mice unhealthy and inhibits their production of offspring.
Figure 6.

Establishment of G0S2 transgenic mice. (A) An example of the RT–PCR analyses used to identify G0S2 transgenic mice. (B) Western blot analysis to identify G0S2 transgenic mice. The panel for ATG3-F1 and -F2 mice is shown as an example. The transgenic mouse numbers are underlined. (C) ISH analyses of G0S2-TG mice. Sections from the kidney (i), stomach (ii, mucosa; v, smooth muscle), esophagus (iii), heart (iv), and epididymis (vi) of adult G0S2-TG mice (GTG1b is shown as an example) were hybridized with the human G0S2 antisense probe and colored blue by using the alkaline phosphatase reaction. The nuclei were counterstained with nuclear fast red. Original magnification: ×200. (D) Immunological detection of exogenic G0S2 proteins in various organs of G0S2-TG mice (GTG1b is shown as an example). Sections from the kidney (i), stomach (ii), lung (iii), and heart (iv) of the adult G0S2-TG mice were incubated with the mouse monoclonal anti-G0S2 antibody (#3-1) and stained with diaminobenzidine. The nuclei were counterstained with hematoxylin. Original magnification: A and B, ×200; C and D, ×400.
3.5. Human G0S2 expression patterns in transgenic mice
To examine the expression patterns of exogenous human G0S2 in various transgenic mouse tissues, we first performed ISH analysis. As shown in some representative pictures (Fig. 6C), high-level expression of G0S2 mRNA was detected in various organs and tissues. The signals in the urinary tubule, gastric foveola, and esophageal mucosa were distributed in epithelial clumps (Fig. 6Ci–iii). In contrast, scattered or diffusely distributed signals were detected in the cardiac ventricle, gastric smooth muscle, and seminiferous tubule (Fig. 6Civ–vi).
Immunohistochemical analysis using the monoclonal antibody (#3-1) also detected exogenously expressed human G0S2 proteins in various organs and tissues of the transgenic mice. As shown in some representative pictures (Fig. 6D), the cellular distribution pattern of these proteins was similar to that of exogenous G0S2 mRNA (Fig. 6C). In the kidney, although most urinary tubule epithelia were weakly positive for G0S2, other epithelia expressed this protein at high levels; the latter epithelia also existed in clumps (Fig. 6Di). A similar patchy distribution of strong G0S2 signals was detected in the foveolar epithelia of the stomach (Fig. 6Dii). In the lung and heart, there was a scattered distribution of exogenous G0S2 signals in the alveolar epithelium and a diffuse distribution in cardiac ventricular muscle, respectively (Fig. 6Diii and iv).
3.6. Phenotypes of G0S2 transgenic mice
To explore the phenotypes of the G0S2 transgenic mouse, we first subjected various organs of G0S2 transgenic mice and wild-type (C57BL/6) mice to histological examination. Obvious histopathological findings that related directly to vasculitis were not observed. Notably, microabscess-like panniculitis lesions were detected in the dermis and subcutaneous fat tissue (Fig. 7A). Of the eight TG mice examined, such lesions were detected in three. We also measured the serum levels of two autoimmunity-related antibodies, namely, anti-nuclear antibody (ANA) and anti-dsDNA antibody. We found both were increased in G0S2 TG mice: the OD490 for ANA in the transgenic mice was 0.359 ± 0.170 [compared with 0.219 ± 0.044 for wild-type (B6) mice], whereas the OD490 for anti-dsDNA antibody was 0.294 ± 0.090 (compared with 0.188 ± 0.038 in wild-type mice) (Fig. 7B). However, these differences did not reach statistical significance, in part, because of the limited number of G0S2 TG mice we could use for these measurements. Taken together, it appears that G0S2 may participate in the pathogenesis of autoimmune diseases in general, and in particular, it may be related to inflammation.
Figure 7.
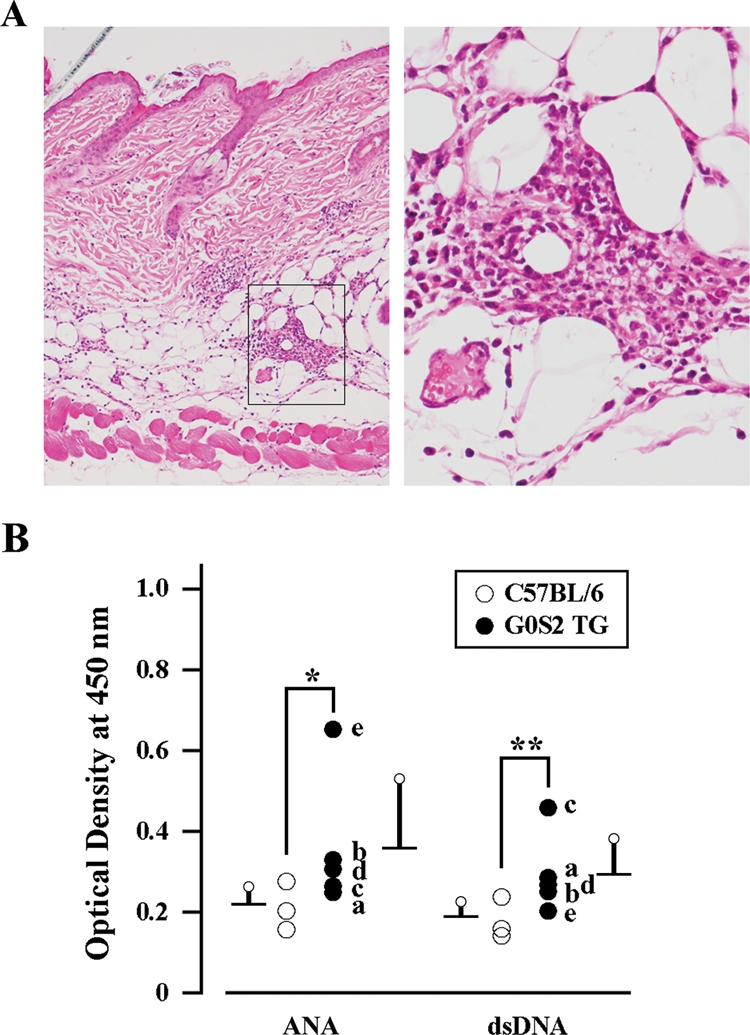
Histological and serological phenotypes of G0S2-TG mice. (A) Histological phenotype of G0S2-TG mice (GTG1b is shown as an example). Sections of the back skin of adult G0S2-TG mice were stained with hematoxylin and eosin. A boxed area in the left panel is enlarged in the right to show microabscess lesions containing numerous neutrophils. Original magnification: left, ×100; right, ×400. (B) Serological phenotypes of G0S2-TG mice (GTG1a is shown as an example). The sera from adult C57BL/6 (open circle) or G0S2-TG (closed circle) mice were examined for the levels of ANA and anti-dsDNA antibody. Asterisk and double asterisks indicate ‘not significant’ because P = 0.1011 and P = 0.0526, respectively, as determined by the Mann–Whitney U-test of differences between G0S2-TG and wild-type mice. The G0S2 TG mice examined are designated as follows: a (GTG1a), b (GTG1b), c (GTG1b-F1a), d (GTG1b-F2a), and e (GTG1b-F1c). The values of individual mice are plotted.
4. Discussion
In the present study, we report candidate gene markers for vasculitis that may be useful for diagnosing and understanding the basic pathogenesis of vasculitis and other autoimmune diseases such as SLE. These genes were identified by stepwise subtraction and cDNA microarray techniques, which permitted us to comprehensively isolate the genes that show augmented mRNA expression in the PBMCs of vasculitis patients when compared with normal volunteers. The vasculitis-specific upregulation of these genes was validated with northern blot and/or RT–PCR analyses (Figs 3 and 4, Tables 1 and 2). We then showed by RT–PCR analysis that EGR1, G0S2, HBD, TVAS10, IL1R2, Amphiregulin, and calgranulin C are frequently upregulated in the PBMCs of vasculitis patients (Fig. 1 and Supplementary Fig. S1). MTC analysis revealed that in normal PBMCs, these genes are expressed primarily by monocytes and/or activated CD4+ cells (Fig. 5). We also showed previously using different primers and PCR conditions that G0S2 is predominantly expressed by monocytes.5 These results suggest that monocytes, including macrophages, express these vasculitis-upregulated genes and thus may play a role in the pathogenesis of vasculitis.
We noticed that several putative vasculitis-upregulated genes also show upregulated expression in other autoimmune diseases, namely, SLE and RA (Table 3). Of these, EGR1 is particularly interesting as the degree to which it is upregulated in most vasculitis patients is remarkable (Fig. 1A). EGR1 is induced by a variety of cellular stresses, including hypoxia, and may function as a master switch that triggers the expression of numerous key inflammatory mediators. In particular, EGR1 induces a number of gene products that have been linked to cellular perturbation, especially in the vasculature. Moreover, many of these genes are often induced in the PBMCs of patients afflicted with a variety of autoimmune diseases. For example, we showed previously that EGR1 is markedly upregulated in the PBMCs of SLE patients.4 It also plays a critical role in promoting cellular differentiation along a macrophage lineage.10 Nonetheless, EGR1-null mice are viable and develop and grow normally.19 Rigorous analyses will be needed to determine whether the upregulation of EGR1 mRNA in many vasculitis patients is pathogenically significant or merely an associated phenomenon.
Table 3.
List of the TAC/TAS genes that also show upregulated expression in PBMCs from SLE and RA patients
| Name | Vasculitis | SLE | RA | Sequence description |
|---|---|---|---|---|
| TAC-1 | 42.0 | 44.7 | nc | Early growth response 1 (EGR1) |
| TAC-2 | 41.7 | 24.1 | nc | Unknown (FLJ21545) = TVAS8 |
| TAC-3 | 29.7 | 23.2 | 2.4 | Interleukin 8 (IL8) |
| TAC-9 | 12.3 | 12.3 | 27.4 | Amphiregulin |
| TAC-13 | 9.7 | 11.3 | 1.8 | CD69 antigen (early T-cell activation antigen) |
| TAC-14 | 9.4 | 7.2 | 3.9 | Tyrosylprotein sulfotransferase 1 (TPST1) |
| TAC-19 | 9.1 | 5.3 | 9.4 | Interleukin 1 receptor, type II (IL1R2) |
| TAC-20 | 8.8 | 18.0 | 1.4 | Similar to interferon alpha-inducible protein 27 |
| TAC-34 | 6.9 | 11.5 | 2.4 | Sin3-associated polypeptide, 30kDa (SAP30) |
| TAC-37 | 6.8 | 3.9 | 2.4 | Chemokine (C-X-C motif) ligand 1 (CXCL1) |
| TAC-40 | 6.7 | 14.8 | 4.0 | G0/G1 switch gene 2 (G0S2) |
| TAC-47 | 6.4 | 20.7 | nc | Viperin (cig5) |
| TAC-51 | 6.2 | 10.7 | 4.4 | Nuclear factor of kappa B (NFκB) |
| TAC-78 | 5.5 | 11.4 | 1.7 | CD83 antigen (immunoglobulin superfamily) |
The numbers represent fold change compared with normal volunteers; nc, no conspicuous change between RA and control.
G0S2 also displayed enhanced expression in many vasculitis patients (Fig. 1B). G0S2 was first identified as one of the G0/G1 switch (G0S) genes that are differentially expressed in lymphocytes during their lectin-induced switch from the G0 to the G1 phases of the cell cycle.20 G0S2 is one of the genes that is upregulated during normal implantation but its expression is significantly lower in women with endometriosis that is associated with pelvic pain and infertility with implantation failure.21 In a replicative senescence model employing human dermal fibroblasts (HDF), G0S2 expression was upregulated in old HDF cells, which suggests that it participates in senescence.22 Microarray and qRT–PCR analyses of PBMCs from psoriasis patients suffering from severe generalized disease also revealed the upregulation of G0S2.13 Moreover, we showed previously that G0S2 mRNA levels are markedly increased in the PBMCs from patients with the autoimmune diseases SLE4 and RA.5 G0S2 is a putative target gene of peroxisome-proliferator-activated receptor (PPAR) alpha, which belongs to a group of transcription factors that are involved in numerous processes, including lipid metabolism and adipogenesis. Moreover, it was shown that G0S2 is upregulated after PPARδ activation and that it may be involved in the PPARδ-mediated mitigation of cardiac fibroblast proliferation.23
We here generated G0S2-TG mice that ubiquitously overexpress G0S2 proteins (Fig. 6). We showed that these mice are unhealthy as they do not produce many offspring (Fig. 2) and frequently display formations of microabscess-like panniculitis lesions in the dermis and subcutaneous fat tissue (Fig. 7A). The development of these microabscess-like panniculitis lesions may reflect the dysregulation of the murine immune system in these mice. Supporting this is that some of the G0S2-TG mice had augmented levels of immunodeficiency-related anti-nuclear and anti-dsDNA antibodies in their sera (Fig. 7B), although these phenotypes are related not to vasculitis but to SLE. It should be noted, however, that these serum differences did not achieve statistical significance, largely because of the shortage of G0S2-TG mice. It will be necessary to study larger numbers of G0S2-TG mice to confirm this association between G0S2 overexpression and the development of autoimmune features. Should this association be confirmed, the high-quality polyclonal and monoclonal anti-G0S2 antibodies that we produced may be useful as tools (perhaps in enzyme-linked EIA) for diagnosing not just vasculitis but also other autoimmune diseases.
We performed this study on a highly heterogeneous cohort of patients, including those with systemic vasculitis. All of these diseases share the inflammatory involvement of blood vessels. However, their target organs, pathogenic mechanisms, clinical findings, and outcomes are quite different. Moreover, although the disease activity status in these patients was heterogeneous and some were receiving corticosteroid or immunosuppressive therapy, these factors were ignored in our patient recruitment protocol. Nonetheless, despite these marked heterogeneous features of our patient population, we could isolate putative common genes that are upregulated, which was our original goal. We are currently performing in parallel the expression profiling of the genes that are up- or downregulated in each individual disease and analyzing these profiles in terms of the symptoms, disease activity status, and clinical treatment of the patients. However, the results obtained from such studies are highly complex, which has hampered the identification of candidate gene markers that can be used for diagnosis.
Taken together, we conclude that the putative gene markers we identified here, in particular EGR1 and G0S2, may be useful for diagnosing not only vasculitis but also other autoimmune diseases, perhaps by qRT–PCR and antibody-based methods. Other, as yet uncharacterized, genes that we detected as being upregulated in vasculitis may also be useful candidate gene markers and thus are worth further detailed analysis. In particular, the identification of the functions of these genes may reveal the hitherto unknown mechanism(s) that underlie the pathogenesis of vasculitis. This in turn may shed light on therapeutic avenues for treating vasculitis.
Supplementary Data
Supplementary data are available online at www.dnaresearch.oxfordjournals.org.
Funding
This work was primarily supported by a grant-in-aid from the Health Science Research grant from the Ministry of Health and Welfare of Japan. This work was also supported in part by grants-in-aid to Hiroshi Nojima from Bio-Medical Cluster Project In Saito, Innovation Plaza Osaka and Regional Research and Development Resources Utilization Program of the Japan Science, and Technology Agency (JST), Scientific Research on Priority Areas “Applied Genomics”, Scientific Research (S), Exploratory Research, and the Science and Technology Incubation Program in Advanced Regions from the Ministry of Education, Culture, Sports, Science, and Technology of Japan. Moreover, this study was partly supported by grants-in-aid to Kazuo Suzuki and Hiroshi Hashimoto from the Ministry of Health and Welfare of Japan.
Supplementary Material
Acknowledgements
We thank the patients and healthy volunteers who participated in this study. We are obliged to Prof. Masaru Okabe, Prof. Masahito Ikawa, Ms Yumi Koreeda, Mr Masato Tanaka, Ms Yoko Esaki, Ms Akiko Kawai, and Ms Hisae Takema for useful advice and technical assistance in the generation of G0S2 transgenic mice. We also thank Ms Azumi Fujimori, Ms Chie Ishigami, Ms Ayami Ohtaka, Mr Akira Shigehisa, Dr Jun Sato, and Dr Takashi Kasama for technical assistance in the identification of TAC genes, and Dr Patrick Hughes for critically reading the manuscript.
References
- 1.Jennette J. C., Falk R. J., Andrassy K., et al. Nomenclature of systemic vasculitides. Proposal of an international consensus conference. Arthritis Rheum. 1994;37:187–192. doi: 10.1002/art.1780370206. [DOI] [PubMed] [Google Scholar]
- 2.Selamet U., Kovaliv Y. B., Savage C. O., Harper L. ANCA-associated vasculitis: new options beyond steroids and cytotoxic drugs. Expert Opin. Investig. Drugs. 2007;16:689–703. doi: 10.1517/13543784.16.5.689. [DOI] [PubMed] [Google Scholar]
- 3.Kallenberg C. G. Antineutrophil cytoplasmic autoantibody-associated small-vessel vasculitis. Curr. Opin. Rheumatol. 2007;19:17–24. doi: 10.1097/BOR.0b013e3280119842. [DOI] [PubMed] [Google Scholar]
- 4.Ishii T., Onda H., Tanigawa A., et al. Isolation and expression profiling of genes upregulated in the peripheral blood cells of systemic lupus erythematosus patients. DNA Res. 2005;112:1–11. doi: 10.1093/dnares/dsi020. [DOI] [PubMed] [Google Scholar]
- 5.Nakamura N., Shimaoka Y., Tougan T., et al. Isolation and expression profiling of genes upregulated in bone marrow-derived mononuclear cells of rheumatoid arthritis patients. DNA Res. 2006;13:169–183. doi: 10.1093/dnares/dsl006. [DOI] [PubMed] [Google Scholar]
- 6.Fujii T., Tamura K., Masai K., Tanaka H., Nishimune Y., Nojima H. Use of stepwise subtraction to comprehensively isolate mouse genes whose transcription is up-regulated during spermiogenesis. EMBO Rep. 2002;3:367–372. doi: 10.1093/embo-reports/kvf073. [DOI] [PMC free article] [PubMed] [Google Scholar]
- 7.Ikawa M., Kominami K., Yoshimura Y., Tanaka K., Nishimune Y., Okabe M. A rapid and non-invasive selection of transgenic embryos before implantation using green fluorescent protein (GFP) FEBS Lett. 1995;375:125–128. doi: 10.1016/0014-5793(95)01162-8. [DOI] [PubMed] [Google Scholar]
- 8.Ito A., Okada M., Uchino K., et al. Expression of the TSLC1 adhesion molecule in pulmonary epithelium and its downregulation in pulmonary adenocarcinoma other than bronchioloalveolar carcinoma. Lab. Invest. 2003;83:1175–1183. doi: 10.1097/01.lab.0000081391.28136.80. [DOI] [PubMed] [Google Scholar]
- 9.Kobori M., Ikeda Y., Nara H., et al. Large scale isolation of osteoclast-specific genes by an improved method involving the preparation of a subtracted cDNA library. Genes Cells. 1998;3:459–475. doi: 10.1046/j.1365-2443.1998.00202.x. [DOI] [PubMed] [Google Scholar]
- 10.Nguyen H. Q., Hoffman-Liebermann B., Liebermann D. A. The zinc finger transcription factor Egr-1 is essential for and restricts differentiation along the macrophage lineage. Cell. 1993;72:197–209. doi: 10.1016/0092-8674(93)90660-i. [DOI] [PubMed] [Google Scholar]
- 11.Yan S. F., Harja E., Andrassy M., Fujita T., Schmidt A. M. Protein kinase C beta/early growth response-1 pathway: a key player in ischemia, atherosclerosis, and restenosis. J. Am. Coll. Cardiol. 2006;48:A47–A55. doi: 10.1016/j.jacc.2006.05.063. [DOI] [PubMed] [Google Scholar]
- 12.Cristillo A. D., Heximer S. P., Russell L., Forsdyke D. R. Cyclosporin A inhibits early mRNA expression of G0/G1 switch gene 2 (G0S2) in cultured human blood mononuclear cells. DNA Cell. Biol. 1997;16:1449–1458. doi: 10.1089/dna.1997.16.1449. [DOI] [PubMed] [Google Scholar]
- 13.Koczan D., Guthke R., Thiesen H. J., et al. Gene expression profiling of peripheral blood mononuclear leukocytes from psoriasis patients identifies new immune regulatory molecules. Eur. J. Dermatol. 2005;15:251–257. [PubMed] [Google Scholar]
- 14.Proudfoot N. J., Shander M. H., Manley J. L., Gefter M. L., Maniatis T. Structure and in vitro transcription of human globin genes. Science. 1980;209:1329–1336. doi: 10.1126/science.6158093. [DOI] [PubMed] [Google Scholar]
- 15.Shoyab M., McDonald V. L., Bradley J. G., Todaro G. J. Amphiregulin: a bifunctional growth-modulating glycoprotein produced by the phorbol 12-myristate 13-acetate-treated human breast adenocarcinoma cell line MCF-7. Proc. Natl. Acad. Sci. USA. 1988;85:6528–6532. doi: 10.1073/pnas.85.17.6528. [DOI] [PMC free article] [PubMed] [Google Scholar]
- 16.Mosavi L. K., Cammett T. J., Desrosiers D. C., Peng Z. Y. The ankyrin repeat as molecular architecture for protein recognition. Protein Sci. 2004;13:1435–1448. doi: 10.1110/ps.03554604. [DOI] [PMC free article] [PubMed] [Google Scholar]
- 17.Subramaniam S., Stansberg C., Cunningham C. The interleukin 1 receptor family. Dev. Comp. Immunol. 2004;28:415–428. doi: 10.1016/j.dci.2003.09.016. [DOI] [PubMed] [Google Scholar]
- 18.Foell D., Roth J. Proinflammatory S100 proteins in arthritis and autoimmune disease. Arthritis Rheum. 2004;50:3762–3771. doi: 10.1002/art.20631. [DOI] [PubMed] [Google Scholar]
- 19.Lee S. L., Tourtellotte L. C., Wesselschmidt R. L., Milbrandt J. Growth and differentiation proceeds normally in cells deficient in the immediate early gene NGFI-A. J. Biol. Chem. 1995;270:9971–9977. doi: 10.1074/jbc.270.17.9971. [DOI] [PubMed] [Google Scholar]
- 20.Russell L., Forsdyke D. R. A human putative lymphocyte G0/G1 switch gene containing a CpG-rich island encodes a small basic protein with the potential to be phosphorylated. DNA Cell Biol. 1991;10:581–591. doi: 10.1089/dna.1991.10.581. [DOI] [PubMed] [Google Scholar]
- 21.Kao L. C., Germeyer A., Tulac S., et al. Expression profiling of endometrium from women with endometriosis reveals candidate genes for disease-based implantation failure and infertility. Endocrinology. 2003;144:2870–2881. doi: 10.1210/en.2003-0043. [DOI] [PubMed] [Google Scholar]
- 22.Yoon I. K., Kim H. K., Kim Y. K., et al. Exploration of replicative senescence-associated genes in human dermal fibroblasts by cDNA microarray technology. Exp. Gerontol. 2004;39:1369–1378. doi: 10.1016/j.exger.2004.07.002. [DOI] [PubMed] [Google Scholar]
- 23.Zandbergen F., Mandard S., Escher P., et al. The G0/G1 switch gene 2 is a novel PPAR target gene. Biochem. J. 2005;392:313–324. doi: 10.1042/BJ20050636. [DOI] [PMC free article] [PubMed] [Google Scholar]
Associated Data
This section collects any data citations, data availability statements, or supplementary materials included in this article.