Abstract
The high-fat diet (HFD)-fed mouse is a model of obesity, impaired glucose tolerance, and insulin resistance. The main objective of this study was to elucidate the molecular mechanisms underlying the antidiabetogenic and weight-lowering effects of 17β-estradiol (E2) in this mouse model. C57BL/6 female mice (8 wk old) were fed on a HFD for 10 mo. E2, given daily (50 μg/kg sc) during the last month of feeding, decreased body weight and markedly improved glucose tolerance and insulin sensitivity. Plasma levels of insulin, leptin, resistin, and adiponectin were decreased. We demonstrated that E2 treatment decreased the expression of genes encoding resistin and leptin in white adipose tissue (WAT), whereas adiponectin expression was unchanged. Furthermore, in WAT we demonstrated decreased expression levels of sterol regulatory element-binding protein 1c (SREBP1c) and its lipogenic target genes, such as fatty acid synthase and stearoyl-CoA desaturase 1 (SCD1). In the liver, the expression levels of transcription factors such as liver X receptor α and SREBP1c were not changed by E2 treatment, but the expression of the key lipogenic gene SCD1 was reduced. This was accompanied by decreased hepatic triglyceride content. Importantly, E2 decreased the hepatic expression of glucose-6-phosphatase (G-6-Pase). We conclude that E2 treatment exerts antidiabetic and antiobesity effects in HFD mice and suggest that this is related to decreased expression of lipogenic genes in WAT and liver and suppression of hepatic expression of G-6-Pase. Decreased plasma levels of resistin probably also play an important role in this context.
Keywords: glucose tolerance, insulin sensitivity, obesity, lipogenic genes, glucose-6-phosphatase
in women, the risk for weight gain and development of type 2 diabetes is increased at menopause, when estrogen deficiency is present (28). Onset of menopause is associated with declining estrogen levels, decreased energy expenditure, and fat oxidation, all of which are accompanied by increases in total body fat and visceral adipose tissue mass (36). In postmenopausal women, increased body weight is associated with hyperinsulinemia (25), central fat deposition, and insulin resistance (3). Estrogen replacement improves insulin sensitivity, reduces central body fatness, lowers lipid and cholesterol levels, and decreases the risk for development of type 2 diabetes, and these beneficial effects of estrogen depend on dose, route of administration, and duration of treatment (48, 53). However, there are studies that have shown no effect (26) or impairment of insulin sensitivity upon estrogen treatment (47).
Estrogen exerts its effects via two nuclear receptors: estrogen receptor (ER)-α and ERβ (10). Supporting evidence for an important role for estrogen/ERα signaling in the regulation of glucose homeostasis has been obtained from studies on aromatase knockout (ARKO) and ERα knockout (ERKO) mice. Complete aromatase deficiency results in glucose intolerance and insulin resistance, whereas supplementation with 17β-estradiol (E2) improves insulin sensitivity in males (52). ERKO mice develop glucose intolerance and decreased insulin sensitivity mainly due to hepatic insulin resistance (5). ERα deficiency leads to an obese phenotype in female mice (9) without any change in food intake (21). Thus, ERα also appears to be critical for regulating white adipose tissue (WAT) mass (23). ARKO mice are also obese and show a phenotype similar to that of ERKO mice, specifically with regard to increased gonadal fat pad weight (15). In ARKO and ERKO mice, E2 has also been shown to play a role in the regulation of lipid metabolism: the hepatic steatosis and insulin resistance observed in ARKO mice were accounted for by impaired lipid oxidation in the liver (42), whereas, in ERKO mice, hepatic insulin resistance was suggested to be due to the upregulation of lipogenic genes (5). Regulation of fatty acid synthesis-associated genes in the liver and adipose tissue involves transcription factors such as sterol regulatory element-binding protein-1c (SREBP1c) and liver X receptor α (LXRα) (45, 54). Peroxisome proliferator-activated receptors (PPARα and -γ) also have pivotal roles in both liver and adipose tissue, where they control the expression of target genes associated with lipid metabolism, energy storage, and adipocyte differentiation (6, 39).
E2 displays powerful antidiabetic and weight-lowering effects in ovariectomized mice and many spontaneous rodent models of type 2 diabetes (2, 35). The main objective of this study was to investigate effects of E2 treatment in mice maintained for up to 12 mo on high-fat diet (HFD), which is an important model of impaired glucose tolerance and obesity, and to study potential molecular mechanisms, focusing on both adipokine levels and the expression of genes involved in fatty acid metabolism in the liver and adipose tissue.
MATERIALS AND METHODS
Animals.
Female C57BL/6 mice (7 wk old) were obtained from Scanbur B&K. Animals were maintained on a 12:12-h light-dark cycle, with food and water available ad libitum, in a temperature-controlled room (22–23°C). After arrival (1 wk), mice were randomly housed on the following diets: lean mice were maintained on a regular chow diet containing (in g/100 g) 4.5 fat, 14.5 protein, and 69 carbohydrate (Lactamin, Kimstad, Sweden), whereas the experimental group was given a HFD containing (in g/100 g) 34.9 fat, 26.2 protein, and 26.3 carbohydrate (Research Diet, New Brunswick, NJ) until 12 mo of age (10 mo of HFD feeding). At 11 mo of age, the mice were divided into four groups [lean (n = 5), lean + E2 (n = 5), HFD (n = 6), and HFD + E2 (n = 6)], and 17β-estradiol (50 μg·kg−1·day−1, dissolved in 90% sesame oil/10% ethanol) was administered subcutaneously for 30 days. Control animals (lean and HFD groups) received an equal volume of vehicle. At the end of the experiment, all animals were decapitated, blood was collected in heparinized tubes and centrifuged, and plasma was stored at −20°C. Livers and abdominal adipose tissue were removed, weighed, and stored at −80°C. All animal experiments have been approved by local ethical committees.
Intraperitoneal glucose tolerance test.
An intraperitoneal glucose tolerance test (IPGTT) was performed on overnight-fasted mice. Blood glucose concentrations were measured before and at 10, 30, 60, and 120 min after intraperitoneal glucose load (2 g/kg body wt ip). Blood glucose concentrations were measured using a MediSence glucose analyzer (Abbott Scandinavia, Solna, Sweden).
Intraperitoneal insulin tolerance test.
An intraperitoneal insulin tolerance test was performed in overnight-fasted mice in principle according to Miki et al. (40). Briefly, blood glucose concentrations were measured at the basal state, and mice were injected with human insulin (Actrapid; Novo Nordisk) at a dose of 0.25 U/kg body wt ip. The blood glucose concentration was measured 10 min after insulin injection (0 min), which was followed by administration of glucose (1 g/kg body wt ip). Blood glucose concentrations were measured at 15, 30, 60, 90, and 120 min after glucose load.
Assays for plasma insulin, leptin, resistin, adiponectin, and estradiol.
Plasma insulin levels were measured by RIA using 125I-labeled porcine insulin, guinea pig anti-porcine serum, and rat insulin as a standard (Novo Nordisk) (27). The assay sensitivity was 3.9 μU/ml with intra- and interassay coefficients of variation (CV) of 5.87 and 8.9%, respectively. Plasma leptin levels were analyzed by a double-antibody RIA technique using rat leptin antiserum, 125I-labeled rat leptin, and rat leptin as a standard (Linco Research, St. Charles, MO) (1). The sensitivity of assay was 0.5 ng/ml and intra-assay CV was 4.5%. Plasma resistin levels were measured by a double-antibody RIA kit (Linco Research) (31) using 125I-labeled mouse resistin, mouse resistin rabbit antiserum, and mouse resistin as a standard. The sensitivity of assay was 0.78 ng/ml with intra-assay CV of 3.8%. Plasma adiponectin levels were assessed with a double-antibody RIA technique in which 125I-labeled murine adiponectin, multispecies adiponectin rabbit antiserum, and mouse adiponectin standard were used (Linco Research) (58). The sensitivity of assay was 1.0 ng/ml. Intra-assay CV was 4.15%. Plasma estradiol levels were measured by a double-antibody RIA kit (Diagnostic Systems Laboratories) (14) using 125I-labeled estradiol and rabbit anti-estradiol serum. The sensitivity of assay was 0.6 pg/ml with intra-assay CV of 4.0%.
Real-time PCR analysis.
Total RNA was prepared from frozen tissue using an RNeasy Mini Kit (Qiagen, Valencia, CA). RNA from individual animals was reverse transcribed into cDNA using Reverse Transcription Reagents (Applied Biosystems, Foster City, CA) with random hexamer primers. Analyses were performed using a 7500 Real-Time PCR System (Applied Biosystems) with Power SYBR Green reagents. PCR products were further analyzed by melting curve analysis to confirm the presence of single products in each case. mRNA levels were normalized to hypoxanthine ribosyltransferase (HPRT) mRNA. Primer sequences for leptin, resistin, adiponectin, LXRα, SREBP1c, stearoyl-CoA desaturase 1 (SCD1), fatty acid synthase (FAS), acetyl-coenzyme A carboxylase 1 (ACC1), PPARγ2, PPARα, glucose-6-phosphatase (G-6-Pase, catalytic), and HPRT expression assays are presented in Table 1.
Table 1.
Primer sequences for real-time PCR
| Target Genes | Forward Primer (5′-3′) | Reverse Primer (5′-3′) |
|---|---|---|
| Leptin | AGCCAATGACCTGGAGAATCTC | GGCAGGGAGCAGCTCTTG |
| Resistin | AAGCCATCGACAAGAAGATCAAA | TCCAGCAATTTAAGCCAATGTTC |
| Adiponectin | AGAGATGGCACTCCTGGAGAGAA | CAACATCTCCTGTCTCACCCTTA |
| LXRα | GAGTTGTGGAAGACAGAACCTCAA | GGGCATCCTGGCTTCCTC |
| SREBP1c | GGAAGCTGTCGGGGTAGCGTC | CATGTCTTCAAATGTGCAATCCAT |
| SCD1 | CCGGAGACCCCTTAGATCGA | TAGCCTGTAAAAGATTTCTGCAAA |
| FAS | GGGTTCTAGCCAGCAGAGTC | TCAGCCACTTGAGTGTCCTC |
| ACC1 | TGACAGACTGATCGCAGAGAAAG | TGGAGAGCCCCACACACA |
| PPARγ2 | ATGGGTGAAACTCTGGGAGATTCT | CTTGGAGCTTCAGGTCATATTTGT |
| PPARα | GCTGTGGAGATCGGCCTG | GCAACTTCTCAATGTAGCCTATGTTT |
| G-6-Pase | TCCGTGCCTATAATAAAGCAGTT | GTAGAAGTGACCATAACATAGTA |
| HPRT | GCAGTACAGCCCCAAAATGG | AACAAAGTCTGGCCTGTATCCAA |
LXRα, liver X receptor α; SREBP1, sterol regulatory element-binding protein 1; SCD1, stearoyl-coenzyme A (CoA) desaturase 1; FAS, fatty acid synthase; ACC1, acetyl-CoA carboxylase; PPAR, peroxisome proliferator-activated receptor; G-6-Pase, glucose-6-phosphatase; HPRT, hypoxanthine ribosyltransferase.
Triglyceride measurements.
Hepatic lipids were extracted (16) from 50 mg of tissue and analyzed for triglyceride (TG) content using a TG kit (Roche Applied Science, Indianapolis, IN). TG levels were related to total protein levels.
Western blot analysis.
Protein extracts were prepared by homogenizing tissue in 50 mM Tris·HCl, pH 7.6, and 0.1% Triton X-100 supplemented with 1× protease inhibitor cocktail (Roche Diagnostics, Mannheim, Germany) and centrifuged at 20,000 g for 30 min. The cleared lysate was transferred to new tubes and centrifuged again to remove as much lipid as possible. Protein concentrations of extracts were determined using the Coomassie Plus Protein Assay Reagent (Pierce Biotechnology, Rockford, IL). Samples containing 20 μg of total protein were separated by electrophoresis through 8% polyacrylamide gels and transferred to Hybond-C Super membranes (GE Healthcare, Buckinghamshire, UK). Membranes were probed using a FAS antibody (NB 400-114; Novus Biologicals, Littleton, CO). Protein-antibody complexes were detected using an enhanced chemiluminescence system (GE Healthcare).
Transient transfection assays.
Mouse preadipocyte cells (3T3-L1) were cultured in DMEM containing 4.5 g/l glucose (Invitrogen, Carlsbad, CA) supplemented with 10% calf serum and 2 mM l-glutamine; 20,000 cells/well were seeded in 24-well plates 1 day before transfection in phenol red-free DMEM (Invitrogen) supplemented with glucose corresponding to 4.5 g/l, 10% dextran-coated charcoal-treated FBS, 2 mM l-glutamine, 100 U penicillin/ml, and 100 μg streptomycin/ml. An amount of 0.8 μg of the mouse (m) SCD1 promoter (a kind gift from Dr. Miyazaki, Department of Biochemistry, University of Wisconsin-Madison, Madison, WI) (7) or mSREBP1c promoter (a kind gift from Dr. Jae Bum Kim, School of Biological Sciences, Seoul National University, Seoul, Korea) (33) constructs expressing firefly luciferase as a reporter gene was cotransfected with 0.5 μg ERα or empty pSG5 vector using Lipofectamine 2000 in Opti-Mem I Reduced Serum Medium, according to the standard protocol (Invitrogen). A plasmid expressing Renilla luciferase under control of the thymidine kinase promoter (pRL-TK; Promega, Madison, WI) was used for normalization. Medium was changed after 5 h to charcoal-treated FBS-containing media with 10 nM E2 or vehicle (99.5% ethanol). Cells were harvested 24 h after transfection, and firefly and Renilla luciferase activities were determined using the Dual-Luciferase Reporter Assay System (Promega) according to the manufacturer's instructions.
Statistical analysis.
All values are presented as means ± SE. When significant differences were found, an unpaired Student's t-test (see Figs. 4D, 5, 6, and 7) or one-way ANOVA followed by the Bonferroni post hoc analysis was used (see Figs. 1, 2, 3, and 4, A–C). A value of P < 0.05 was considered significant.
Fig. 4.
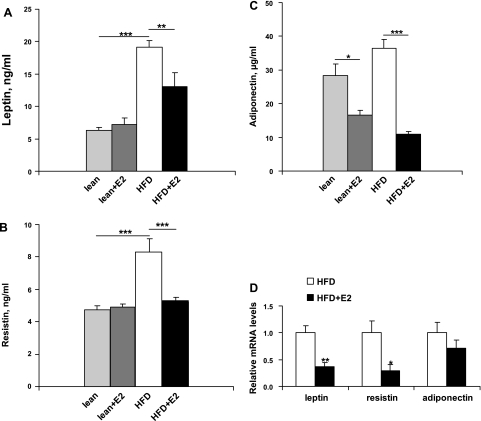
Plasma levels and white adipose tissue (WAT) expression of leptin, resistin, and adiponectin after E2 treatment. A: plasma leptin concentrations. Data are presented as means ± SE; n = 5–6. ***P < 0.001 for lean and lean + E2 vs. HFD mice. **P < 0.001 for HFD vs. HFD + E2 mice. B: plasma resistin concentrations. Data are presented as means ± SE; n = 5–6. ***P < 0.001 for lean and lean + E2 vs. HFD mice and for HFD vs. HFD + E2 mice. C: plasma adiponectin levels. Data are presented as means ± SE; n = 5–6. *P < 0.05 for lean vs. lean + E2 mice. ***P < 0.001 for HFD vs. HFD + E2. D: leptin, resistin, and adiponectin mRNA levels in WAT. Data are presented as means ± SE; n = 6. *P < 0.05 and **P < 0.01 vs. vehicle-treated HFD mice.
Fig. 5.
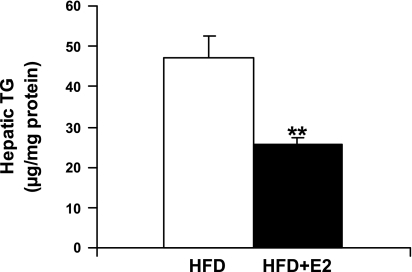
Triglyceride (TG) content in the liver. Hepatic lipids were extracted and analyzed for TG. Data are presented as means ± SE; n = 6. **P < 0.01 vs. vehicle-treated HFD mice.
Fig. 6.
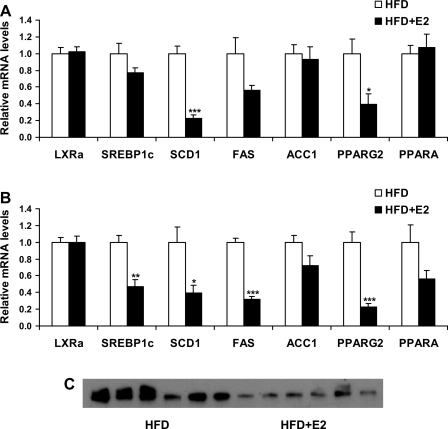
mRNA levels of genes involved in lipid metabolism in liver (A) and WAT (B) of HFD mice after E2 treatment. Data are presented as means ± SE. *P < 0.05, **P < 0.01, and ***P < 0.001 vs. vehicle-treated HFD mice. C: fatty acid synthase (FAS) protein levels in WAT of vehicle and E2-treated HFD mice; n = 6.
Fig. 7.
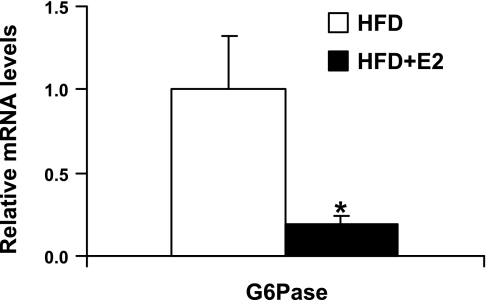
mRNA levels of glucose-6-phosphatase (G-6-Pase) in HFD mice upon E2 treatment. Data are presented as means ± SE; n = 6. *P < 0.05 vs. vehicle-treated HFD mice.
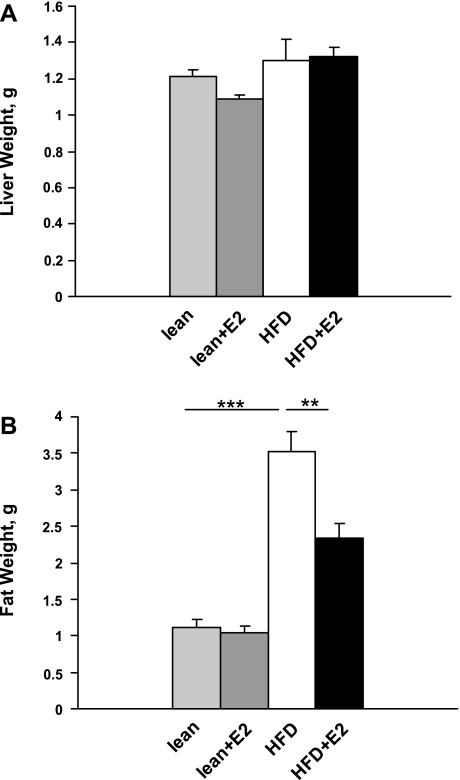
Fig. 1.
Liver and fat weights in lean and high-fat diet (HFD)-fed mice after estradiol (E2) treatment. A: liver weights. Data are presented as means ± SE; n = 5–6 mice. B: abdominal fat weights. Data are presented as means ± SE; n = 5–6. ***P < 0.001 for lean and lean + E2 vs. HFD mice. **P < 0.01 for HFD vs. HFD + E2 mice.
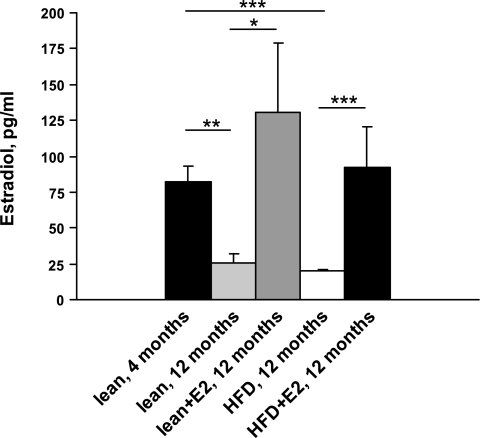
Fig. 2.
Plasma levels of E2 in lean and HFD mice. Data are presented as means ± SE; n = 8 for 4-mo-old mice and n = 5–6 for 12-mo-old mice. **P < 0.01 and ***P < 0.001 for 4-mo-old mice vs. 12-mo-old mice (lean and HFD, respectively). *P < 0.05 for lean mice vs. lean + E2 and ***P < 0.001 for HFD vs. HFD + E2 mice.
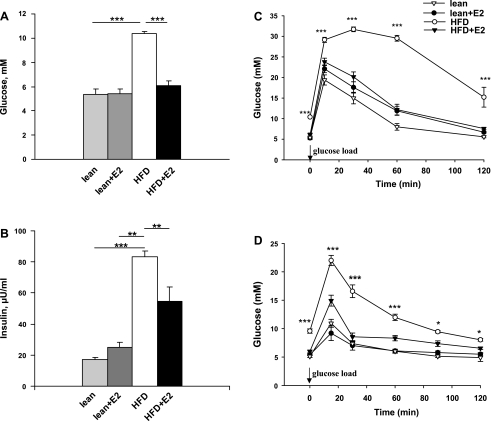
Fig. 3.
Blood glucose concentrations, plasma insulin levels, glucose tolerance, and insulin sensitivity in lean and HFD mice treated with E2. A: fasting blood glucose levels. Data are presented as means ± SE; n = 5–6. ***P < 0.001 for lean and lean + E2 vs. HFD mice and for HFD vs. HFD + E2 mice. B: plasma insulin levels. Data are presented as means ± SE; n = 5–6. ***P < 0.001 for lean. **P < 0.01 for lean + E2 vs. HFD mice, and **P < 0.01 for HFD vs. HFD + E2 mice. C: intraperitoneal glucose tolerance test (IPGTT) was performed in overnight-fasted mice. Blood glucose levels were measured before and after glucose load (2 g/kg body wt ip) at the indicated time points. Data are presented as means ± SE; n = 5–6. ***P < 0.001 vs. vehicle-treated HFD mice. D: intraperitoneal insulin tolerance test (IPITT) in overnight-fasted mice. Animals were first injected with insulin (0.25 U/kg body wt ip) and 10 min later with glucose (1 g/kg body wt ip). Blood glucose concentrations were measured at basal conditions and at 15, 30, 60, 90, and 120 min after glucose load. Data are presented as means ± SE; n = 5–6. *P < 0.05 and ***P < 0.001 vs. vehicle-treated HFD mice.
RESULTS
Body weight.
Ten months of HFD feeding in mice resulted in a significant increase in body weight compared with lean mice fed on a regular chow diet (54.7 ± 2.6 vs. 29.8 ± 1.0 g in lean mice, P < 0.001). E2 treatment of HFD mice during the last experimental month decreased body weight from 54.7 ± 2.6 to 42.7 ± 2.4 g, P < 0.01. There were no significant differences in liver weights between lean or HFD mice without or with E2 treatment (Fig. 1A). However, the weight of abdominal WAT was significantly increased in HFD mice and was reduced after E2 treatment (Fig. 1B). Twelve-month-old mice (both lean and HFD) had threefold lower plasma E2 levels than 4-mo-old lean mice. E2 administration to lean and HFD mice restored plasma E2 levels to those observed in 4-mo-old lean mice (Fig. 2).
Fasting blood glucose and plasma insulin levels.
HFD mice had increased fasting blood glucose and plasma insulin levels compared with lean mice (Fig. 3, A and B). Treatment of HFD mice with E2 (30 days) reduced fasting blood glucose levels to those of lean mice and significantly decreased plasma insulin levels (Fig. 3, A and B).
Glucose tolerance.
During IPGTT, blood glucose levels were markedly increased in HFD mice compared with lean mice. E2 treatment nearly normalized the blood glucose pattern in HFD mice. In lean mice, E2 treatment had no effect on glucose tolerance (Fig. 3C).
Insulin tolerance.
To explore whole body insulin sensitivity, we measured glucose elimination after administration of insulin and glucose (Fig. 3D). At all time points, glucose concentrations remained higher in HFD mice compared with lean mice. E2 treatment almost normalized insulin sensitivity in HFD mice, whereas E2 had no effect in lean mice.
Plasma levels and expression of adipokines in WAT.
Circulating levels of leptin and resistin were significantly higher in HFD mice than in lean mice. Treatment of HFD mice with E2 decreased leptin levels and completely normalized resistin concentrations (Fig. 4, A and B). E2 treatment of lean mice had no effect on adipokine levels (Fig. 4, A and B). Adiponectin levels in HFD mice were similar to those in lean mice, and were reduced after E2 treatment (Fig. 4C). E2 administration reduced mRNA levels of leptin and resistin, and did not change adiponectin mRNA expression levels, in WAT (Fig. 4D).
TG levels in liver.
In HFD mice, E2 treatment reduced TG content in the liver (Fig. 5).
Expression levels of lipogenic genes in liver.
E2 treatment did not change mRNA levels of genes encoding LXRα and SREBP1c or their target lipogenic genes such as FAS and ACC1. However, SCD1 expression levels were significantly decreased upon E2 treatment in HFD mice (Fig. 6A). Furthermore, treatment with E2 did not affect the expression of PPARα in HFD mice, but decreased expression of PPARγ2 (Fig. 6A).
Expression levels of lipogenic genes in WAT.
The expression of LXRα was not changed upon E2 treatment, whereas SREBP1c mRNA was significantly decreased. The downregulation of SREBP1c was associated with downregulation of its target genes involved in lipid biosynthesis, such as FAS and SCD1. Expression of the gene encoding PPARγ2, a nuclear receptor involved in the regulation of adipogenesis, was decreased in WAT of HFD mice after E2 treatment, whereas expression of PPARα was unchanged by E2 administration (Fig. 6B). Figure 6C illustrates the reduction in FAS protein levels in WAT of HFD mice treated with E2 compared with vehicle-treated mice.
Expression levels of G-6-Pase in liver.
The expression of G-6-Pase, an important gene involved in the control of glucose output from the liver, was decreased in HFD mice following E2 treatment (Fig. 7).
E2 regulation of SREBP1c and SCD1 at the promoter level.
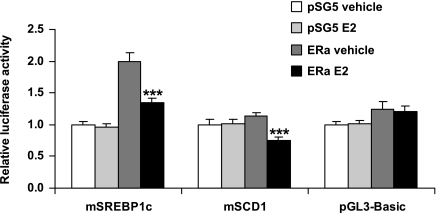
We used a transient transfection assay to determine whether the lipogenic genes SREBP1c and SCD1 are direct targets for E2 repression. The transcriptional activities of the promoters of SREBP1c and SCD1 genes were decreased by E2 in the presence of ERα in preadipocyte 3T3-L1 cells (Fig. 8).
Fig. 8.
Mouse sterol regulatory element-binding protein 1c (SREBP1c) and stearoyl-CoA desaturase 1 (SCD1) promoters were responsive to estrogen in the presence of estrogen receptor (ER)-α in the preadipocyte cell line 3T3-L1, using a transient transfection assay. Expression from the empty pGL3-Basic vector was unchanged. Data are presented as means ± SE. ***P < 0.001 vs. vehicle-treated ERα-transfected cells.
DISCUSSION
It has previously been shown that female C57BL/6 mice fed on HFD for up to 12 mo have increased body weight, accompanied by hyperglycemia and hyperinsulinemia, indicative of insulin resistance (57). In the present study, we have confirmed and extended these data. Thus long-term (10 mo) feeding of female C57BL/6 mice on HFD leads to obesity, fasting hyperglycemia, and hyperinsulinemia. These mice also displayed markedly impaired glucose tolerance and decreased insulin sensitivity, but only 1 mo of E2 treatment decreased body weight by 22% and normalized glucose tolerance and insulin sensitivity. The levels of E2 in both 12-mo-old HFD and lean mice were threefold lower than in 4-mo-old lean mice, but, after E2 treatment, E2 levels reached those of adult young mice. This fact, together with observations from other studies investigating estrous cyclicity in aging C57BL mice (30), leads us to suggest that our model corresponds to a perimenopausal state in women, in whom E2 levels are decreased and menstrual cycle becomes irregular.
We found that plasma resistin levels were increased in HFD mice but were nearly normalized after E2 treatment. In this context, the study of Muse et al. (41) is of interest, since it demonstrated that hepatic insulin resistance in HFD-fed mice was accompanied by increased resistin levels and was completely restored by treatment with antisense oligos directed against resistin mRNA. This finding is in agreement with our present results that demonstrate that E2-associated reductions in resistin levels are accompanied by improved glucose tolerance and insulin sensitivity in HFD mice. Moreover, the action of resistin seems to depend on the presence or absence of leptin. In C57BL mice with diet-induced obesity but wild-type leptin alleles, resistin deficiency reduced hepatic glucose production and increased peripheral glucose uptake (46). Resistin deficiency in ob/ob mice improved insulin sensitivity mainly by enhancing glucose uptake in muscle and adipose tissue (46).
Obesity and insulin resistance in HFD mice were also associated with an approximately fourfold increase in plasma leptin levels compared with lean mice. Notably, despite marked increases in body weight, the liver weights of HFD mice were similar to those in lean mice, and, histologically, the livers showed only moderate hepatic steatosis (data not shown). The preventive role of leptin in the development of hepatic steatosis during caloric excess has been shown in Harlan Sprague Dawley rats: after 10 wk of feeding, leptin was progressively increased, although TG levels remained in the nonsteatotic range (32). Contrary to this, in leptin-deficient ob/ob mice, profound hepatic steatosis was accompanied by high levels of TG (19). In HFD mice, in which body weights were comparable to those of ob/ob mice used in our previous study (19), the protective role of hyperleptinemia can also be seen as significantly lower liver weights (almost 3.5-fold) and decreased lipid drop infiltration in liver compared with ob/ob mice (data not shown). E2 treatment of HFD mice resulted in decreased body weight, plasma leptin levels, and hepatic TG content, although liver weights were unchanged. Therefore, reductions in plasma leptin levels and TG content in the liver upon E2 treatment may contribute to the improvement of insulin sensitivity.
Expression levels of the mRNAs encoding leptin and resistin in WAT were significantly decreased after E2 treatment, in concordance with the reduction in plasma levels of these hormones.
However, we did not find a significant difference in plasma adiponectin levels between HFD and lean mice. This adipose-derived hormone is related to insulin resistance and commonly decreased by obesity (22), and seems to be associated with increased TG content in the muscle and liver (18, 60). Treatment of HFD mice with E2 reduced body weight and hepatic TG levels, although plasma adiponectin levels were decreased. The expression of adiponectin mRNA in adipose tissue was not changed. Of relevance to our data are the observations by D'Eon et al. (11), who demonstrated that E2 decreased adiponectin levels in ovariectomized mice, in association with a reduction in adiposity. In addition, E2 treatment of differentiated 3T3-L1 cells leads to a direct inhibition of adiponectin expression (8). The downregulation of adiponectin levels by E2 could potentially be a detrimental effect of E2 that needs to be investigated further.
In our previous study, we have shown that one possible mechanism for insulin resistance in ob/ob and ERKO mice may involve altered lipid metabolism in the liver. Treatment of ob/ob mice with E2 led to decreased expression levels of hepatic lipogenic genes such as FAS and SCD1, in parallel with an improvement in hepatic insulin sensitivity (19). Meanwhile, ERKO mice demonstrated high expression of SCD1 in the liver, which was accompanied by pronounced hepatic insulin resistance (5). Specifically, we have shown that treatment of HFD mice with E2 resulted in significant downregulation of hepatic SCD1 expression, although it did not alter the expression of genes encoding FAS and ACC1 in the liver. It is known that the expression of these lipogenic genes is under the control of SREBP1c, a transcription factor that regulates lipogenesis (24, 49). The selective deletion of the SREBP1c isoform results in decreased expression of enzymes involved in fatty acid and TG synthesis (34), and the overexpression of hepatic SREBP1c causes an induction of lipogenic genes (17). The fatty livers of ob/ob mice also show increased expression of SREBP1c (50). Treatment of HFD mice with E2 changed neither the expression levels of hepatic SREBP1c nor the expression level of LXRα, a known dominant regulator of SREBP1c (61). Therefore, it appears as if an alternative mechanism exists by which E2 can regulate the expression of SCD1 in the liver of HFD mice. Indeed, lipogenic gene expression appears to depend only partly upon the SREBP proteins, since in the absence of SREBP activity, fatty acid synthesis is reduced by only 40% (43).
PPARα is a nuclear receptor and transcription factor that controls lipid metabolism by regulating β- and ω-oxidation (12). It has been observed that PPARα knockout mice exhibit markedly higher hepatic lipid storage than mice fed on HFD, indicating the protective role of PPARα against steatosis (51). However, treatment of HFD mice with E2 did not change hepatic expression levels of PPARα. Therefore, it is possible that this expression level of PPARα is sufficient to maintain oxidative capacity in the liver at a level that prevents excessive hepatic lipid accumulation in HFD mice. On the other hand, it has been demonstrated that E2 can promote lipid oxidation in PPARα-deficient mice (13). PPARγ is present in the liver to a lesser extent than in adipose tissue. Nevertheless, lipoatrophic mice with liver-specific inactivation of PPARγ are protected against hepatic fat accumulation (20). Therefore, decreased expression of PPARγ2 in HFD mice upon E2 treatment could be involved in the regulation of TG levels in the liver.
G-6-Pase is the key enzyme that controls liver glucose production. G-6-Pase dephosphorylates glucose 6-phosphate, which is the final step in both the glycogenolysis and the gluconeogenesis pathways, to increase blood glucose levels (4). Treatment with E2 resulted in decreased expression of hepatic G-6-Pase in HFD mice, which may contribute to improvements in both insulin sensitivity in the liver and glucose tolerance.
Another possible source of insulin resistance is the adipose tissue. E2 decreases adiposity and adipocyte size in ovariectomized mice and downregulates lipogenic genes under the control of SREBP1c in adipocytes (11). Our data demonstrate that E2 treatment of HFD mice resulted in downregulation of genes such as FAS and SCD1, which promote lipid storage in adipocytes. E2-mediated decreases in FAS and SCD1 are likely to result from downregulation of SREBP1c in HFD mice. We did not find any changes in the expression of LXRα after E2 treatment in this study, although it has previously been demonstrated that short-term treatment with E2 can regulate LXRα and SREBP1c expression in WAT (37). E2-induced reductions in LXRα, SREBP1c, and their target lipogenic genes such as FAS and ACC1 have also been shown in WAT of ovariectomized mice after E2 treatment (11). In addition, E2 treatment can reduce FAS, SCD1, and ACC1 expression in human abdominal adipose tissue (38). Indeed, in our study, the reduction of SREBP1c expression and its downstream-regulated lipogenic genes after E2 treatment was accompanied by a decrease in the weight of WAT. This in turn may lead to decreased adiposity and improvements of insulin sensitivity. Specifically, using transient transfection assays, we have demonstrated that E2 can directly regulate the activities of the SREBP1c and SCD1 promoters in mouse preadipocyte cells (3T3-L1). This direct regulation of adipose SCD1 expression by E2 may also contribute to SREBP1c-independent regulation of SCD1 in the liver.
PPARγ2 is a nuclear receptor and transcription factor that mainly regulates the expression of genes involved in adipocyte differentiation and energy storage (29). Previous observations have shown that PPARγ2 expression was significantly increased in WAT of rats and mice receiving high-fat meals (44, 55). In contrast, heterozygous PPARγ-deficient mice showed decreased lipogenesis and prevention of adiposity, thereby ameliorating HFD-induced obesity and insulin resistance (59). We have demonstrated that E2 treatment of HFD mice dramatically decreased WAT expression levels of PPARγ2, in association with decreased adiposity, which were accompanied by improvements in insulin sensitivity.
Although insulin resistance is correlated with the presence of a chronic inflammatory state in WAT (56), we detected either no change or a trend toward increased expression of inflammatory markers, including C-reactive protein, in HFD mice upon E2 treatment (data not shown).
In conclusion, we demonstrate that long-term HFD induces obesity, insulin resistance, and glucose intolerance in 12-mo-old female mice. Treatment with E2 markedly reduces these metabolic changes. These effects of E2 are probably mainly mediated by the downregulation of the transcription factor SREBP1c and its downstream-regulated lipogenic genes, such as FAS and SCD1 in WAT and SCD1 in liver. The decreased expression of hepatic G-6-Pase may also contribute to improved hepatic insulin sensitivity and glucose tolerance.
GRANTS
This study was supported by grants from the Swedish Research Council (K2005-31X-00034-41A), Karo Bio, the Swedish Cancer Society, and Novo Nordisk Foundation.
DISCLOSURES
J.-Å. Gustafsson is a consultant and shareholder of Karo Bio.
The costs of publication of this article were defrayed in part by the payment of page charges. The article must therefore be hereby marked “advertisement” in accordance with 18 U.S.C. Section 1734 solely to indicate this fact.
REFERENCES
- 1.Ahren B, Månsson S, Gingerich RL, Havel PJ. Regulation of plasma leptin in mice: influence of age, high-fat diet, and fasting. Am J Physiol Regul Integr Comp Physiol 273: R113–R120, 1997. [DOI] [PubMed] [Google Scholar]
- 2.Bailey CJ, Ahmed-Sorour H. Role of ovarian hormones in the long-term control of glucose homeostasis: effects on insulin secretion. Diabetologia 19: 475–481, 1980. [DOI] [PubMed] [Google Scholar]
- 3.Bonora E Relationship between regional fat distribution and insulin resistance. Int J Obes Relat Metab Disord 24, Suppl 2: S32–S35, 2000. [DOI] [PubMed] [Google Scholar]
- 4.Borthwick EB, Houston MP, Coughtrie MW, Burchell A. The antihyperglycemic effect of estrone in genetically obese-diabetic (ob/ob) mice is associated with reduced hepatic glucose-6-phosphatase. Horm Metab Res 33: 721–726, 2001. [DOI] [PubMed] [Google Scholar]
- 5.Bryzgalova G, Gao H, Ahren B, Zierath JR, Galuska D, Steiler TL, Dahlman-Wright K, Nilsson S, Gustafsson JÅ, Efendic S, Khan A. Evidence that oestrogen receptor-alpha plays an important role in the regulation of glucose homeostasis in mice: insulin sensitivity in the liver. Diabetologia 49: 588–597, 2006. [DOI] [PubMed] [Google Scholar]
- 6.Cecil JE, Watt P, Palmer CN, Hetherington M. Energy balance and food intake: the role of PPARγ gene polymorphisms. Physiol Behav 88: 227–233, 2006. [DOI] [PubMed] [Google Scholar]
- 7.Chu K, Miyazaki M, Man WC, Ntambi JM. Stearoyl-coenzyme A desaturase 1 deficiency protects against hypertriglyceridemia and increases plasma high-density lipoprotein cholesterol induced by liver X receptor activation. Mol Cell Biol 26: 6786–6789, 2006. [DOI] [PMC free article] [PubMed] [Google Scholar]
- 8.Combs TP, Berg AH, Rajala MW, Klebanov S, Iyengar P, Jimenez-Chillaron JC, Patti ME, Klein SL, Weinstein RS, Scherer PE. Sexual differentiation, pregnancy, calorie restriction, and aging affect the adipocyte-specific secretory protein adiponectin. Diabetes 52: 268–276, 2003. [DOI] [PubMed] [Google Scholar]
- 9.Course JF, Korach KS. Estrogen receptor null mice: what have we learned and where will they lead us? Endocr Rev 20: 358–417, 1999. [DOI] [PubMed] [Google Scholar]
- 10.Dahlman-Wright K, Cavailles V, Fuqua SA, Jordan VC, Katzenellenbogen JA, Korach KS, Maggi A, Muramatsu M, Parker MG, Gustafsson JÅ. International Union of Pharmacology. LXIV. Estrogen receptors. Pharmacol Rev 58: 773–781, 2006. [DOI] [PubMed] [Google Scholar]
- 11.D'Eon TM, Souza SC, Aronovitz M, Obin MS, Fried SK, Greenberg AS. Estrogen regulation of adiposity and fuel partitioning. Evidence of genomic and non-genomic regulation of lipogenic and oxidative pathways. J Biol Chem 280: 35983–35991, 2005. [DOI] [PubMed] [Google Scholar]
- 12.Desvergne B, Wahli W. Peroxisome proliferator-activated receptors: nuclear control of metabolism. Endocr Rev 20: 649–88, 1999. [DOI] [PubMed] [Google Scholar]
- 13.Djouadi F, Weinheimer CJ, Saffitz JE, Pitchford C, Bastin J, Gonzalez FJ, Kelly DP. A gender-related defect in lipid metabolism and glucose homeostasis in peroxisome proliferator-activated receptor alpha-deficient mice. J Clin Invest 102: 1083–1091, 1998. [DOI] [PMC free article] [PubMed] [Google Scholar]
- 14.Erlandsson MC, Jonsson CA, Lindberg MK, Ohlsson C, Carlsten H. Raloxifene- and estradiol-mediated effects on uterus, bone and B lymphocytes in mice. J Endocrinol 175: 319–327, 2002. [DOI] [PubMed] [Google Scholar]
- 15.Fisher CR, Graves KH, Parlow AF, Simpson ER. Characterization of mice deficient in aromatase (ArKO) because of targeted disruption of the cyp19 gene. Proc Natl Acad Sci USA 95: 6965–6970, 1999. [DOI] [PMC free article] [PubMed] [Google Scholar]
- 16.Folch J, Lees M, Sloane Stanley GH. A simple method for the isolation and purification of total lipides from animal tissue. J Biol Chem 226: 497–509, 1957. [PubMed] [Google Scholar]
- 17.Foretz M, Guichard C, Ferre P, Foufelle F. Sterol regulatory element binding protein-1c is a major mediator of insulin action on the hepatic expression of glucokinase and lipogenesis-related genes. Proc Natl Acad Sci USA 96: 12737–12742, 1999. [DOI] [PMC free article] [PubMed] [Google Scholar]
- 18.Fruebis J, Tsao TS, Iavorschi S, Ebbets-Reed D, Erickson MR, Yen FT, Bihain BE, Lodish HF. Proteolytic cleavage product of 30-kDa adipocyte complement-related protein increases fatty acid oxidation in muscle and causes weight loss in mice. Proc Natl Acad Sci USA 98: 2005–2010, 2001. [DOI] [PMC free article] [PubMed] [Google Scholar]
- 19.Gao H, Bryzgalova G, Hedman E, Khan A, Efendic S, Gustafsson JÅ, Dahlman-Wright K. Long-term administration of estradiol decreases expression of hepatic lipogenic genes and improves insulin sensitivity in ob/ob mice: a possible mechanism is through direct regulation of signal transducer and activator of transcription 3. Mol Endocrinol 20: 1287–1299, 2006. [DOI] [PubMed] [Google Scholar]
- 20.Gavrilova O, Haluzik M, Matsusue K, Cutson JJ, Johnson L, Dietz KR, Nicol CJ, Vinson C, Gonzalez FJ, Reitman ML. Liver peroxisome proliferator-activated receptor gamma contributes to hepatic steatosis, triglyceride clearance, and regulation of body fat mass. J Biol Chem 278: 34268–34276, 2003. [DOI] [PubMed] [Google Scholar]
- 21.Geary N, Asarian L, Korach KS, Pfaff DW, Ogawa S. Deficits in E2-dependent control of feeding, weight gain, and cholecystokinin satiation in ER-alpha null mice. Endocrinology 142: 4751–4757, 2001. [DOI] [PubMed] [Google Scholar]
- 22.Haluzik M, Parizkova J, Haluzik MM. Adiponectin and its role in the obesity-induced insulin resistance and related complications. Physiol Res 53: 123–129, 2004. [PubMed] [Google Scholar]
- 23.Heine PA, Taylor JA, Iwamoto GA, Lubahn DB, Cooke PS. Increased adipose tissue in male and female estrogen receptor-α knockout mice. Proc Natl Acad Sci USA 97: 12729–12734, 2000. [DOI] [PMC free article] [PubMed] [Google Scholar]
- 24.Horton JD, Goldstein JL, Brown MS. SREBPs: activators of the complete program of cholesterol and fatty acid synthesis in the liver. J Clin Invest 109: 1125–1131, 2002. [DOI] [PMC free article] [PubMed] [Google Scholar]
- 25.Howard BV, Adams-Campbell L, Allen C, Black H, Passaro M, Rodabough RJ, Rodriguez BL, Safford M, Stevens VJ, Wagenknecht LE. Insulin resistance and weight gain in postmenopausal women of diverse ethnic groups. Int J Obes Relat Metab Disord 28: 1039–1047, 2004. [DOI] [PubMed] [Google Scholar]
- 26.Karjalainen A, Paassilta M, Heikkinen J, Bäckström AC, Savolainen M, Kesäniemi YA. Effect of peroral and transdermal oestrogen replacement therapy on glucose and insulin metabolism. Clin Endocrinol (Oxf) 54: 165–173, 2001. [DOI] [PubMed] [Google Scholar]
- 27.Kärvestedt L, Andersson G, Efendic S, Grill V. A rapid increase in β-cell function by multiple insulin injection in type 2 diabetic patients is not further enhanced by prolonging treatment. J Intern Med 251: 307–316, 2002. [DOI] [PubMed] [Google Scholar]
- 28.Khoo CL, Perera M. Diabetes and the menopause. J Br Menopause Soc 11: 6–11, 2005. [DOI] [PubMed] [Google Scholar]
- 29.Knouff C, Auwerx J. Peroxisome proliferator-activated receptor-gamma calls for activation in moderation: lessons from genetics and pharmacology. Endocr Rev 25: 899–918, 2004. [DOI] [PubMed] [Google Scholar]
- 30.Kopp C, Ressel V, Wigger E, Tobler I. Influence of estrus cycle and ageing on activity patterns in two inbred mouse strains. Behav Brain Res 167: 165–174, 2006. [DOI] [PubMed] [Google Scholar]
- 31.Lee JH, Bullen JW Jr, Stoyneva VL, Mantzoros CS. Circulating resistin in lean, obese, and insulin-resistant mouse models: lack of association with insulinemia and glycemia. Am J Physiol Endocrinol Metab 288: E625–E632, 2005. [DOI] [PubMed] [Google Scholar]
- 32.Lee Y, Wang MY, Kakuma T, Wang ZW, Babcock E, McCorcle K, Higa M, Zhou YT, Unger RH. Liporegulation in diet-induced obesity. The antisteatotic role of hyperleptinemia. J Biol Chem 276: 5629–5635, 2000. [DOI] [PubMed] [Google Scholar]
- 33.Lee YS, Lee HH, Park J, Yoo EJ, Glackin CA, Choi YI, Jeon SH, Seong RH, Park SD, Kim JB. Twist 2, a novel ADD1/SREBP1c interacting protein, represses the transcriptional activity of ADD/SREBP1c. Nucleic Acids Res 31: 7165–7174, 2003. [DOI] [PMC free article] [PubMed] [Google Scholar]
- 34.Liang G, Yang J, Horton JD, Hammer RE, Goldstein JL, Brown MS. Diminished hepatic response to fasting/refeeding and liver X receptor agonists in mice with selective deficiency of sterol regulatory element-binding protein-1c. J Biol Chem 277: 9520–9528, 2002. [DOI] [PubMed] [Google Scholar]
- 35.Louet JF, LeMay C, Mauvais-Jarvis F. Antidiabetic actions of estrogen: insight from human and genetic mouse models. Curr Atheroscler Rep 6: 180–185, 2004. [DOI] [PubMed] [Google Scholar]
- 36.Lovejoy JC, Champagne CM, de Jonge L, Xie H, Smith SR. Increased visceral fat and decreased energy expenditure during the menopausal transition. Int J Obes (Lond) 32: 949–958, 2008. [DOI] [PMC free article] [PubMed] [Google Scholar]
- 37.Lundholm L, Movérare S, Steffensen KR, Nilsson M, Otsuki M, Ohlsson C, Gustafsson JÅ, Dahlman-Wright K. Gene expression profiling identifies liver X receptor alpha as an estrogen-regulated gene in mouse adipose tissue. J Mol Endocrinol 32: 879–892, 2004. [DOI] [PubMed] [Google Scholar]
- 38.Lundholm L, Zang H, Hirschberg AL, Gustafsson JÅ, Arner P, Dahlman-Wright K. Key lipogenic gene expression can be decreased by estrogen in human adipose tissue. Fertil Steril 90: 44–48, 2008. [DOI] [PubMed] [Google Scholar]
- 39.Mandard S, Müller M, Kersten S. Peroxisome proliferator-activated receptor α target genes. Cell Mol Life Sci 61: 393–416, 2004. [DOI] [PMC free article] [PubMed] [Google Scholar]
- 40.Miki T, Nagashima K, Tashiro F, Kotake K, Yoshitomi H, Tamamoto A, Gonoi T, Iwanaga T, Miyazaki J, Seino S. Defective insulin secretion and enhanced insulin action in KATP channel-deficient mice. Proc Natl Acad Sci USA 95: 10402–10406, 1998. [DOI] [PMC free article] [PubMed] [Google Scholar]
- 41.Muse ED, Obici S, Bhanot S, Monia BP, McKay RA, Rajala MW, Scherer PE, Rossetti L. Role of resistin in diet-induced hepatic insulin resistance. J Clin Invest 114: 232–239, 2004. [DOI] [PMC free article] [PubMed] [Google Scholar]
- 42.Nemoto Y, Toda K, Ono M, Fujikawa-Adachi K, Saibara T, Onishi S, Enzan H, Okada T, Shizuta Y. Altered expression of fatty acid-metabolizing enzymes in aromatase-deficient mice. J Clin Invest 105: 1819–1825, 2000. [DOI] [PMC free article] [PubMed] [Google Scholar]
- 43.Pai JT, Guryev O, Brown MS, Goldstein JL. Differential stimulation of cholesterol and unsaturated fatty acid biosynthesis in cells expressing individual nuclear sterol regulatory element-binding proteins. J Biol Chem 273: 26138–26148, 1998. [DOI] [PubMed] [Google Scholar]
- 44.Pearson SL, Cawthorne MA, Clapham JC, Dunmore SJ, Holmes SD, Moore GB, Smith SA, Tadayyon M. The thiazolidinedione insulin sensitizer, BRL 49653, increases the expression of PPAR-gamma and aP2 in adipose tissue of high-fat-diet rats. Biochem Biophys Res Commun 229: 752–757, 1996. [DOI] [PubMed] [Google Scholar]
- 45.Pols TW, Ottenhoff R, Vos M, Levels JH, Quax PH, Meijers JC, Pannekoek H, Groen AK, de Vries CJ. Nur77 modulates hepatic lipid metabolism through suppression of SREBP1c activity. Biochem Biophys Res Commun 366: 910–916, 2008. [DOI] [PubMed] [Google Scholar]
- 46.Qi Y, Nie Z, Lee YS, Singhal MS, Scherer PE, Lazar MA, Ahima RS. Loss of resistin improves glucose homeostasis in leptin deficiency. Diabetes 55: 3083–3090, 2006. [DOI] [PubMed] [Google Scholar]
- 47.Ryan AS, Nicklas BJ, Berman DM. Hormone replacement therapy, insulin sensitivity, and abdominal obesity in postmenopausal women. Diabetes Care 25: 127–133, 2002. [DOI] [PubMed] [Google Scholar]
- 48.Salpeter SR, Walsh JME, Ormiston TM, Greyber E, Buckley NS, Salpeter EE. Meta-analysis: effect of hormone-replacement therapy on components of the metabolic syndrome in postmenopausal women. Diabetes Obes Metab 8: 538–554, 2006. [DOI] [PubMed] [Google Scholar]
- 49.Shimano H Sterol regulatory element-binding protein family as global regulators of lipid synthetic genes in energy metabolism. Vitam Horm 65: 167–194, 2002. [DOI] [PubMed] [Google Scholar]
- 50.Shimomura I, Bashmakov Y, Horton JD. Increased levels of nuclear SREBP-1c associated with fatty livers in two mouse models of diabetes mellitus. J Biol Chem 274: 30028–30032, 1999. [DOI] [PubMed] [Google Scholar]
- 51.Stienstra R, Mandard S, Patsouris D, Maass C, Kersten S, Muller M. Peroxisome proliferator-activated receptor alpha protects against obesity-induced hepatic inflammation. Endocrinology 148: 2753–2763, 2007. [DOI] [PubMed] [Google Scholar]
- 52.Takeda K, Toda K, Saibara T, Nakagawa M, Saika K, Onishi T, Sugiura T, Shizuta Y. Progressive development of insulin resistance phenotype in male mice with complete aromatase (CYP19) deficiency. J Endocrinol 176: 237–246, 2003. [DOI] [PubMed] [Google Scholar]
- 53.Tchernov A, Calles-Escandon J, Sites CK, Poehlman ET. Menopause, central body fatness, and insulin resistance: effects of hormone-replacement therapy. Coron Artery Dis 9: 503–511, 1998. [DOI] [PubMed] [Google Scholar]
- 54.Ulven SM, Dalen KT, Gustafsson JÅ, Nebb HI. LXR is crucial in lipid metabolism. Prostagland Leukot Essent Fatty Acids 73: 59–63, 2005. [DOI] [PubMed] [Google Scholar]
- 55.Vidal-Puig A, Jimenez-Linan M, Lowell BB, Hamann A, Hu E, Spiegelman B, Flier JS, Moller DE. Regulation of PPARγ gene expression by nutrition and obesity in rodents. J Clin Invest 97: 2553–2561, 1996. [DOI] [PMC free article] [PubMed] [Google Scholar]
- 56.Wellen KE, Hotamisligil GS. Inflammation, stress and diabetes. J Clin Invest 115: 1111–1119, 2005. [DOI] [PMC free article] [PubMed] [Google Scholar]
- 57.Winzell MS, Ahren BA. Model for studying mechanisms and treatment of impaired glucose tolerance and type 2 diabetes. Diabetes 53: S215–S219, 2004. [DOI] [PubMed] [Google Scholar]
- 58.Winzell MS, Nogueiras R, Dieguez C, Ahren B. Dual action of adiponectin on insulin secretion in insulin-resistant mice. Biochem Biophys Res Commun 321: 154–160, 2004. [DOI] [PubMed] [Google Scholar]
- 59.Yamauchi T, Kamon J, Waki H, Murakami K, Motojima K, Komeda K, Ide T, Kubota N, Terauchi Y, Tobe K, Miki N, Tsichida A, Akanuma Y, Nagai R, Kimura S, Kadowaki T. The mechanism by which both heterozygous peroxisome proliferator-activated receptor gamma (PPAR gamma) deficiency and PPAR gamma agonist improve insulin resistance. J Biol Chem 276: 41245–41254, 2001. [DOI] [PubMed] [Google Scholar]
- 60.Yamauchi T, Kamon J, Waki H, Terauchi Y, Kubota N, Hara K, Mori Y, Ide T, Murakami K, Tsuboyama-Kasaoka N, Ezaki O, Akanuma Y, Gavrilova O, Vinson C, Reitman S, Tomita M, Froguel P, Kadowaki T. The fat-derived hormone adiponectin reverses insulin resistance associated with both lipoatrophy and obesity. Nat Med 7: 941–946, 2001. [DOI] [PubMed] [Google Scholar]
- 61.Yoshikawa T, Shimano H, Amemiya-Kudo M, Yahagi N, Hasty AH, Matsuzaka T, Okazaki H, Tamura Y, Iizuka Y, Ohashi K, Osuga J, Harada K, Gotoda T, Kimura S, Ishibashi S, Yamada N. Identification of liver X receptor-retinoid X receptor as an activator of the sterol regulatory element-binding protein 1c gene promoter. Mol Cell Biol 21: 2991–3000, 2001. [DOI] [PMC free article] [PubMed] [Google Scholar]


