Abstract
ActiGraph accelerometers are a useful tool for objective assessment of physical activity in clinical and epidemiological studies. Several generations of ActiGraph are being used; however, little work has been done to verify that measurements are consistent across generations. This study employed mechanical oscillations to characterize the dynamic response and intermonitor variability of three generations of ActiGraph monitors, from the oldest 7164 (n = 13), 71256 (n = 12), to the newest GT1M (n = 12). The response due to independent radius (22.1–60.4 mm) and frequency (25–250 rpm) changes were measured, as well as intermonitor variability within each generation. The 7164 and 71256 have similar relationships between activity counts and radius (P = 0.229) but were significantly different from the GT1M (P < 0.001). The frequency responses were nonlinear in all three generations. Although the response curve shapes were similar, the differences between generations at various frequencies were significant (P < 0.017), especially in the extremes of the measurement range. Intermonitor variability was markedly reduced in the GT1M compared with the 7164 and 71256. Other measurement differences between generations include decreased peak counts and decreased sensitivity in low-frequency detection in the GT1M. The results of this study revealed an improvement of the intermonitor variability by the GT1M monitor. However, the reduced sensitivity in low-count ranges in the GT1M may not be well suited for monitoring sedentary or light-intensity movements. Furthermore, the algorithms for energy expenditure predictions developed using older 7164 monitors may need to be modified for the GT1M.
Keywords: calibration, mechanical testing
accelerometers are commonly used by researchers to objectively characterize the intensity and duration of physical activity in animals and humans. Due to their small size and ability to record and store data over days or weeks, they are particularly useful in clinical and epidemiological studies in the fields of exercise, behavior, nutrition, and obesity. There are several accelerometry-based physical activity monitors commercially available, such as the Actical (Mini Mitter, Bend, OR), ActiGraph (Fort Walton Beach, FL), and RT3 (Stayhealthy, Monrovia, CA). Of these, the most studied monitor is the ActiGraph accelerometer, formerly marketed under the Computer Science and Application (CSA) and Manufacture Technology Incorporated (MTI) names. Collectively, ActiGraph monitors have been in use for more than a decade and have undergone several hardware and software revisions.
Extensive work has been dedicated to the development of correlations between ActiGraph data and physiological criteria, such as oxygen consumption during walking and jogging in a laboratory setting (7, 13). Researchers have expanded these studies to include field data using portable indirect calorimeters as the validation criteria (2, 4, 11, 17, 25). An extensive review of calibration experiments has recently been performed (24). Some studies revealed significant intermonitor variability in CSA/MTI devices (3, 25). This raises concerns in field applications where multiple monitors are used for physical activity assessment, and data are compared cross-sectionally or prospectively. However, the inherent variability in monitors is often confounded by the variance introduced by the subjects themselves in such validation trials. Even in the case of a single subject wearing multiple monitors (15, 21, 26), the number of units that can be worn at a given time and the number of suitable locations are prohibitive factors.
Compared with human trials, mechanical oscillators have several advantages, such as the large number of accelerations that can be generated, the ability to record data from multiple monitors simultaneously, and the reproducibility of oscillations between trials. Several groups have used mechanical shakers to determine the inter- and intramonitor variability in ActiGraph 7164 (CSA) monitors. Fairweather et al. (6) developed a mechanical shaker to determine the variability between four ActiGraph monitors at a single acceleration value and showed high interinstrument correlations in pairwise comparisons between the monitors. However, this study was limited both by a small sample size and only one test acceleration. Metcalf et al. (14) developed a testing apparatus that captured the response of 23 ActiGraph 7164 monitors undergoing sinusoidal oscillations at two speed profiles. These experiments showed low intra- and interinstrument coefficients of variability [CV = (SD/mean)·100] at both the moderate and fast speed. Although this study has a larger sample size, it does not provide a characterization of the dynamic range of the ActiGraph accelerometer. Using a rotational wheel apparatus, Brage et al. (3) explored the inter- and intramonitor variability of six ActiGraph 7164 monitors subjected to 51 accelerations generated by modulating both the frequency and radius of oscillation. This study showed low intramonitor variability but indicated that the intermonitor variability was large enough to justify individual monitor calibration. This study provides a comprehensive approach to characterizing the response patterns of ActiGraph 7164 monitors. Recently, a new investigation was undertaken to compare the response of ActiGraph 7164 monitors with response profiles of the Actical and RT3 monitors (5).
To our knowledge, however, no researchers to date have performed sensor characterization on newer models of the ActiGraph, such as the 71256 (marketed 1999–2005) and the GT1M (marketed 2005-present), although differences between these device generations have been reported in a human study (8), and these differences have been suggested as a potential source of monitor variability that should be explored in a mechanical setting (5). Cross-generational analyses could provide insight into variations in the device hardware across monitor generations, which could impact the predictions of physical activity intensity or energy expenditure (EE) using devices other than the 7164 monitors. The purpose of this study is to investigate the inter- and intragenerational differences in count response and unit variability in three generations of ActiGraph monitors by applying a wide range of mechanically generated accelerations.
METHODS
Instrumentation
The CSA/MTI ActiGraph monitors are small devices (5.1 × 4.1 × 1.5 cm for 7164 and 71256, 5.3 × 5.1 × 2.2 cm for GT1M) that can be worn at the hip, wrist, or ankle (15) and measure acceleration in the vertical plane using a uniaxial piezoelectric accelerometer. Detailed specifications of the hardware and a full description of how the monitor acquires and filters data have been described previously (23). Data output from the ActiGraph is reported as activity counts using the manufacturer's software (1). Activity counts are an arbitrary measurement unit that accounts for the amplitude and frequency of acceleration events over each sampling period. Resulting activity counts are then summed over a user-defined epoch, or measurement period. Data collected at different epoch lengths can be compared by multiplying the count output by the ratio of the two epochs (23).
We studied three generations of ActiGraph physical activity monitors: the 7164 (n = 13), the 71256 (n = 12), and the GT1M (n = 12). The 7164 monitors were borrowed from a field investigator and had been previously used for several years at the start of this study. These devices were tested using both mechanical acceleration pulses and the ActiGraph calibrator before testing and determined to be functional. The 71256 monitors had been in limited use for ∼1 yr (no more than 10 studies conducted with each device), whereas the GT1M monitors were new when these experiments began. All 7164 and 71256 monitors were calibrated using an external calibration apparatus (model CAL71), according to the manufacturer's guidelines, before the experiments. At the conclusion of the experiments, all monitors were again evaluated with the calibrator, and none was found to be outside the suggested calibration range. The GT1M monitors are not accommodated by the external calibrator; however, according to the manufacturer's guidelines, external calibration is not required for this model.
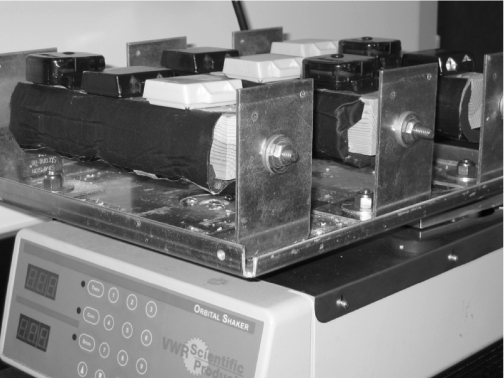
To generate all accelerations in this study, we selected an orbital shaker (VWR, catalog no. 57018-755) with a frequency range of 25–500 (±2) rpm (0.42–8.3 Hz). An orbital shaker produces a sinusoidal pattern of accelerations and is, therefore, a reasonable simulator of repetitive human movements such as gait. However, the original 19.05-mm oscillating radius is smaller than the radius of movement that would be expected during normal gait and other higher intensity activities, such as jogging (16). Thus we modified the orbital shaker to include an adjustable radius ranging from 10.2 to 66.8 mm by adding an arm between the loading plate and the rotor of the shaker. The rotational frequency capabilities, as measured by an electronic odometer, remained unchanged after the modification. The loading plate was equipped with three elevated wooden columns attached by right angle brackets to the loading plate of the oscillator (Fig. 1). The elevation of the columns allows monitors to be secured on all sides, ensuring fidelity of position within each experimental condition.
Fig. 1.
Photograph of bench-top oscillation apparatus with ActiGraph monitors of all three generations positioned on top of the columns.
Experimental Procedure
Location experiment.
The purpose of this experiment was to determine the uniformity of motion between locations on the loading plate. The elevated columns were divided into nine positions large enough to accommodate an ActiGraph. Each position was verified for consistency of measurement using a convenience sample of ActiGraph 71256 monitors (n = 9). Each monitor was positioned in all locations and oscillated at 60 rpm with an epoch length of 10 s for 2 min.
Radius experiment.
The purpose of this experiment was to measure the activity count output of each generation of ActiGraph at five radius values, 22.1, 35.1, 41.6, 46.6, and 60.4 mm, at a constant frequency (150 rpm). This setup would be representative of the motion that would be expected if different subjects, who may have different hip displacements, were asked to walk at the same pace. Monitors were divided into batches of nine units (Fig. 1) from a mixture of generations and were secured to the table throughout the radius changes. Epoch length was set to 1 min, an epoch commonly used in field data collection. Activity counts were measured for 6 min, with at least 3 min of rest between successive radii.
Frequency experiment.
The purpose of this experiment was to determine the dynamic range of each generation of ActiGraph accelerometer. Monitors were again divided into batches of nine (mixed generations) and oscillated at 21 different frequencies, ranging from 25 to 250 rpm at a fixed radius of 46.6 mm. The low end of the frequency range was dictated by the limitations of our mechanical shaker. Although the published high-frequency limit for the ActiGraph is 2.5 Hz (150 rpm), we selected a high-frequency value of 250 rpm (∼4 Hz), because this value is still within the range of human movements, although it is substantially higher than the design specification of the ActiGraph (19, 20). A two-epoch length convention was developed where frequencies ≤100 rpm were measured using 10-s epochs, and frequencies >100 rpm were captured using 1-min epochs, with measurements at 60, 80, and 100 rpm collected using both epoch lengths. Short epochs were used to distinguish between noise, isolated spikes of low count values, and continuous signal acquisition at the lowest test frequencies. For the short-epoch trials, 2 min of data were collected followed by a 1-min rest period, whereas, for the long epoch trials, data were collected for 6 min followed by at least 3 min of rest. To compare the same number of samples for the long and short epochs, each 10-s epoch measurement was converted (multiplied by 6) into an analogous 1-min count value. Post hoc analysis showed that the percent difference in counts converted from short epochs to long epochs at the three repeated measurement points was less than the intramonitor CV for each monitor, which suggests that the use of two measurement epochs did not have a significant effect on the reported results.
For each experimental condition, the first and last data points were excluded from analysis to eliminate the possibility of transient recording errors associated with oscillator ramp-up/down phases. For the short-epoch trials, the first and last two data points were excluded from analysis.
In addition to presenting data in terms of frequency (rpm) in our experiments, average acceleration was computed using the equation (Eq. 1) presented by Brage et al. (3), who used a similar sinusoidal oscillator in a previous study, where acceleration (A) is a function of both the frequency (f) and radius (r) of oscillation.
 |
(1) |
Moreover, in an attempt to develop a monotonically increasing relationship between counts and acceleration over all values tested, results of the frequency experiments were adjusted using the filter weighting (FW) function proposed by Brage et al. (3). This FW approach, which was developed using only ActiGraph 7164 monitors, was tested using ActiGraphs of each generation.
 |
(2) |
Statistical Analysis
For the location experiment, a nonparametric Kruskal-Wallis test was used to determine whether location effects exist. To assess the relationship between radius and counts, linear regression analysis was performed on the output from each generation of monitors. The equality of slopes across generations was assessed by testing if the radius by type effect is equal to zero using an F-test. Contrasts were established to test whether the slope of the 7164 and 71256 are different and if the slope of the GT1M is different than the 7164 and 71256 combined. For the frequency experiments, pairwise comparisons between any two monitor types were performed using exact Wilcoxon rank-sum tests at each measurement frequency with a Bonferroni adjustment to control for multiple comparisons in the overall type I error rate. The inter- and intramonitor CV was computed at each frequency. Statistical analyses were performed using SAS for Windows 8.02 (SAS Institute, Cary, NC) and R 2.01 (The R Foundation; www.r-project.org).
RESULTS
Only one ActiGraph GT1M monitor exhibited a nonzero count response at 25 rpm. This monitor also showed a markedly greater count output at 30 rpm than the other GT1M monitors tested. This result was verified in multiple tests. To ensure that our original batch of GT1M monitors was not flawed, experiments were repeated on a batch of GT1M monitors borrowed from a field investigator (n = 8). These monitors were ordered at a slightly different time than our original monitors but had not been used in the field. No monitors in the second test batch exhibited a nonzero count response at 25 rpm, so the single monitor with a nonzero response at 25 rpm was excluded from all analyses, leaving a sample of 11 GT1M monitor units.
Location Experiment
The location validation experiment showed no significant location effect on count values (P = 0.999). This allowed monitors throughout the rest of the experiments to be tested without regard to their position on the loading plate (Table 1).
Table 1.
Location verification experiment
| 593.4±16.5 | 594.3±16.7 | 594.8±17.1 |
| 593.9±17.0 | 594.1±17.6 | 593.9±16.3 |
| 592.6±16.2 | 592.6±16.5 | 592.6±17.5 |
Values are means ± SD in counts/min from nine ActiGraph 71256 monitors. Each block of the table represents a position on the loading plate of the orbital shaker. No significant effects of position were detected (P = 0.999).
Radius Experiment
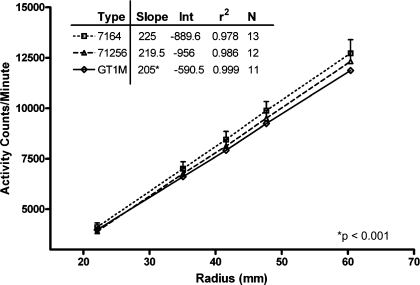
The mean activity counts were found to be correlated with radius for each generation of ActiGraph monitors at our test frequency of 150 rpm (Fig. 2). Comparisons between groups of monitors reveal that the 7164 and 71256 monitors had similar slopes (P = 0.229), but the two combined are significantly different from the GT1M (P < 0.001).
Fig. 2.
ActiGraph counts as a function of oscillation radius for each generation of monitor. This plot contains the monitor means + 1 SD (N = no. of monitors). Int, intercept.
Frequency Experiments
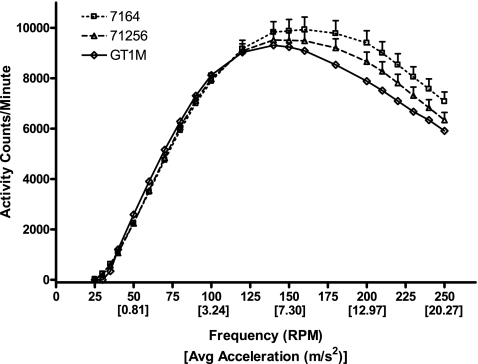
Figure 3 shows the accelerometer output (mean counts) as a function of frequency of oscillation and average acceleration for the three generations of ActiGraph monitors at a fixed radius. All three generations showed a similar curve shape: a linear region in the middle section, flanked by two nonlinear regions at lower and higher frequencies. At all frequencies >160 rpm, all three generations of ActiGraph monitors were significantly different from each other (P < 0.017). In addition, there were several frequencies at which pairwise comparisons showed significant differences. The GT1M monitors were significantly different from the 7164 monitors at all frequencies except 120 rpm, and from the 71256 monitors at all frequencies except 120, 140, and 150 rpm. The 7164 and the 71256 monitors were significantly different at 30, 35, 50, 60, 90, and 160 rpm.
Fig. 3.
Plot of activity counts as a function of frequency and acceleration for each ActiGraph generation over all measured accelerations. Results are means + 1 SD.
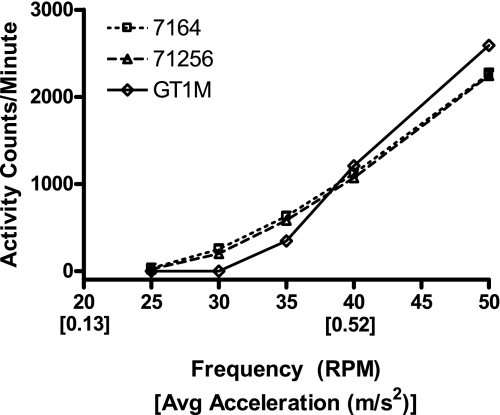
One important difference in the behavior of the three generations of ActiGraphs was observed at the lowest test frequencies (Fig. 4). While the 7164 and 71256 monitors have a nearly identical response to these oscillations, the GT1M monitor requires a larger acceleration to record a nonzero activity count response. Despite this reduced count response at the lowest frequencies, the GT1M has a more rapidly increasing count response once it begins detecting acceleration. This manifests itself as a crossover point between the 7164/71256 responses and the GT1M response at 40 rpm (∼1,000 counts).
Fig. 4.
Activity counts as a function of frequency and acceleration for low-acceleration values. Data are presented as the mean value only. The GT1M monitor, on average, requires a larger acceleration to record a nonzero count response.
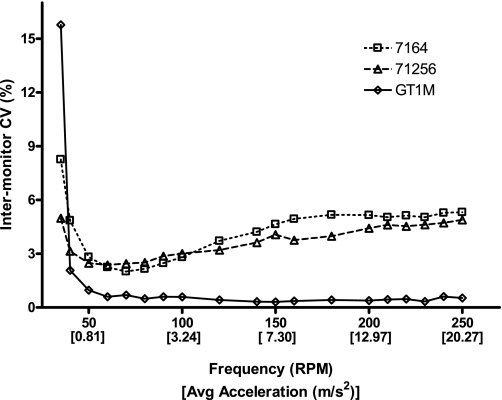
Intermonitor CV values were computed at all frequencies. The intermonitor CV for the GT1M monitors is consistently lower than either the 7164 or 71256 monitors for frequencies >40 rpm (Fig. 5). In general, the CV is high for all generations at low frequencies (>20%), because not all monitors of each generation have a nonzero response in this range (large SD). The GT1M at 25 rpm was an exception, because no signal was captured by any of the monitors (hence CV = 0). Intramonitor CV was small in monitors of all generations, with values on the order of 0.55% for all frequencies >40 rpm.
Fig. 5.
Intermonitor coefficient of variability (CV; %) for all three ActiGraph generations at frequencies >35 rpm. Data from 25 and 30 rpm are not shown because the large CV (>100%) observed at these frequencies is not representative of the trends over the entire measurement range.
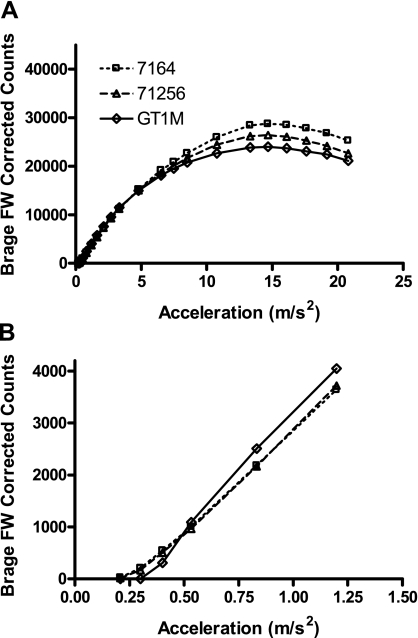
The FW function developed by Brage et al. (3) (Eq. 2) was explored on our data set. This transformation did not correct for all of the count attenuation we observed in the high frequency in any monitor generation (Fig. 6A). However, when the low-frequency range was considered (≤60 rpm), linearization was observed for the 7164 and 71256 monitors (Fig. 6B). The response for the GT1M monitor still retained a nonlinear shape, and magnitude differences between the GT1M response and that of the 7164 and 71256 monitors were observed.
Fig. 6.
Filter weight-corrected data using quadratic filter weighting (FW) function for each generation of ActiGraph monitor. A: results using the Brage weighting function over all frequencies. B: results only for low frequency (≤60 rpm).
DISCUSSION
The ActiGraph line of accelerometers is among the most frequently used activity monitors in the physical activity research field. In this study, we developed an orbital shaker and measured multiple units of three generations of ActiGraph monitors under various acceleration conditions produced by altering both the frequency and radius of oscillation. Although the ActiGraph responses to acceleration changes have similar shapes, statistically significant point differences were found between the three generations. Particularly, the newest monitors, the GT1M, had smaller intermonitor CV, but lower sensitivity in the low-frequency range and reduced amplitude at higher accelerations.
The frequency-specific radius response analysis showed that there is a linear relationship between counts and radius for all measured values. This is an expected response based on the theory of rotational motion (Eq. 1). However, the slope of the regression is significantly different in the GT1M monitors compared with older monitors, suggesting that there are some differences in either the device sensitivity, or the filtering approach. To further explore this idea, experiments where acceleration was modulated by frequency changes at a constant radius were used to characterize the dynamic range and filtering of the count output.
Results from the frequency analysis showed that, even though the general shape of the curves is similar for all generations, the GT1M count output is less than that of the other two monitor generations at low frequencies (<40 rpm), becomes 3–5% greater for moderate frequencies (50–120 rpm), and decays much more quickly after achieving a lower maximum count value (Fig. 3). Although we originally wanted to develop correction factors between different ActiGraph generations, this nonlinear relationship between the generational response profiles prohibits us from achieving this goal with a single, simple correction factor.
To attempt to explore some of the parameters of interest from our oscillation experiments, such as the higher threshold for nonzero activity counts and the lower peak values in the GT1M relative to previous ActiGraph devices, we analyzed ActiGraph data collected in experiments that have been previously described (18). While we did not simultaneously collect data using all three ActiGraph models, a cohort of adult subjects wore either an ActiGraph 71256 (n = 44) or a GT1M (n = 50), while also wearing the triaxial RT3 accelerometer (Stayhealthy, Monrovia, CA) during an overnight stay in a metabolic chamber. Using the RT3 data, the groups were similar in terms of percentage of the study visit, where zero activity counts were detected (49.7% for 71256 wearers, 49.5% for GT1M wearers) and peak activity count values were achieved (5,031 for 7156 wearers, 5,246 for GT1M wearers), suggesting that the level of inactivity and peak intensity of physical activity were similar between the groups. However, using the ActiGraph data, there were substantial differences between the groups, with 71256 wearers recording an average of 54.0% zeros, whereas the GT1M wearers had 67.1% zeros. In terms of peak activity counts, the GT1M wearers also had a lower average value: 8,824 relative to 10,630 counts for the 71256 wearers. The increase in zero count values and decrease in peak count values observed in GT1M data appear to be consistent with the results of our mechanical oscillation experiments.
To attempt to understand potential differences in EE estimation between the different ActiGraph devices, we developed estimations using activity counts produced by each generation of ActiGraph at specific frequencies. Using the Freedson equation, combined with the work-energy theorem for low count values (1) for predicting EE from activity counts, we computed EE differences between the 7164 and each of the other monitor generations for low-count values (<6,000), which were shown in the National Health and Nutrition Examination Survey to be the most prevalent in field data (22). Differences between the 7164 and 71256 showed a consistent reduction in EE prediction of ∼0.05 kcal/min (70 kcal/day). Comparisons between the 7164 and GT1M EE predictions ranged from an underprediction of 0.30 kcal/min (432 kcal/day) at 30 rpm, where count values are ∼300/min, to overestimation of 0.40 kcal/min (576 kcal/day) at 60 rpm, where counts are ∼3,500. Although the underpredictions and overpredictions of the GT1M monitor relative to the 7164 monitor could equalize over the course of the day, it is possible that these changes could lead to clinically significant differences in daily EE estimations.
Recently, Fudge et al. (8) have shown differences between 7164 and GT1M activity monitors in human subjects during walking and jogging. While both devices had a linear increase in activity counts as walking speed increased and both devices plateau during jogging, the GT1M was reported to achieve the plateau value at a higher jogging speed. While our results were consistent with the linear increase during walking speeds, we did not observe an improved plateau response in the GT1M monitors. The study by Fudge et al. (8) did not include the study of sedentary and light physical activity, so differences in the lowest activity count regions could not be analyzed and remain an important area for future investigation.
An important improvement detected in the GT1M monitor is a reduction in intermonitor variability. While intermonitor CV for the 7164 and 71256 was on the order of 3–5% over all frequencies >40 rpm, the GT1M had values of <1% over the same range. We conducted additional experiments to reduce the intermonitor CV in the 7164 and 71256 monitors by using the external calibrator to define a specific gain value (data not shown). However, even when a specific gain value is specified, the intermonitor CV of the 7164 and 71256 monitors tested did not achieve CV as low as that observed in the GT1M (1.56% at gain = 0.57; 5.96% at gain = 0.63), and the process of obtaining this level of control over the calibration factor is time intensive. As such, the ActiGraph GT1M appears to be a more consistent measurement tool than previous ActiGraphs, which could reduce measurement variability in studies in which a large number of physical activity monitor units will be used.
The shape of all three of our observed acceleration response curves was similar to the curve shown by Brage et al. (3) for the 7164 monitor. The same weighting function appears to produce similar results across ActiGraph generations, suggesting that the general filter shape is similar for each generation. Even after the correction factor was applied in the low-frequency region, the GT1M monitor still showed nonlinearity, further highlighting the differences in sensitivity. This approach, however, has limited relevance in the field, where changes in acceleration can be caused by changes in either the amplitude (radius) or the frequency of oscillation. Because the underlying physical cause of the acceleration change would be unknown, application of a frequency-based correction factor may not be well motivated.
Even though we detected many statistically significant differences in the frequency data, it is important for field researchers to consider how much these differences will impact their research findings. The higher threshold for nonzero count reporting exhibited by the GT1M may increase the challenge of detecting and discriminating sedentary or light-intensity activities, which is an area of increasing interest within the field of accelerometer research (9, 10, 12); however, this higher threshold should also reduce the possibility that noise would be reported as signal using these devices. The low-frequency threshold would need to be explored in field protocols composed of sedentary activities to determine whether this change is a benefit or a hindrance. Researchers who are using cut points to divide their data into intensity categories may not see a large change in their outcome using GT1M monitors, because only a small number of data points, those with count values similar to the cut points, are expected to be reclassified, if data from GT1M monitors is partitioned with equations developed for the 7164. Differences may be more important if EE is the desired outcome. In this case, any difference in count value would alter the minute-by-minute EE prediction. Over the course of a day, small minute-by-minute differences translate into large differences in total EE predicted. In such cases, it may be desirable to develop new equations using data from GT1M monitors.
There are several limitations in our study. While the 71256 and GT1M monitors were purchased in batches and had similar prior use patterns among units of a generation, the 7164 monitors were borrowed from a field investigator. We have no knowledge of their age, prior use, or service history. Since this study did not incorporate a time history component, it is unclear if these factors introduce significant error. The calibration process should minimize sensor drift over time and should identify bad sensors, since their count response would be outside the range of acceptable output for the calibrator. However, the calibration is not comprehensive (all possible accelerations are not tested), and some age- and wear-related issues could remain, which may change the response of the monitors. These could explain some of the small changes observed between 7164 and 71256 monitors. The sample size in our study is also a consideration. While it would be desirable to have larger batches of monitors, our sample sizes were constrained by the practical limitation of the number of monitors we had available onsite and through collaborators.
This study demonstrates the response of three generations of ActiGraph physical activity monitors under a wide range of mechanically produced acceleration conditions. We demonstrated a reduction in intermonitor variability in the ActiGraph GT1M monitors, which reduces the error introduced into analyses due to multiple monitor units and represents a significant improvement over previous ActiGraph monitors. Our results also indicated that significant differences in activity count outputs exist between the generations of monitors at numerous acceleration values. These count differences can result in large differences in the prediction of daily activity EE, even at low-count values (<500). However, analyses relying on discriminating data using cut points will likely only feel a minimal impact of these differences, since only a few data points would be reclassified. Ultimately, the end goal of each researcher must be considered when interpreting whether observed count differences will introduce an unacceptable level of error into data analysis. Differences observed in a mechanical setting should be verified in controlled human experiments to better understand the impact intergenerational differences have on outcomes in clinical studies.
GRANTS
This work was supported by grants from the National Institutes of Health: DK02973, DK069465, and HL082988.
Acknowledgments
The authors thank Dr. Charles Matthews and his research assistant Cara Hanby for the use of their ActiGraph calibrator. The authors also acknowledge Maciej Buchowski for continued support of this project.
The costs of publication of this article were defrayed in part by the payment of page charges. The article must therefore be hereby marked “advertisement” in accordance with 18 U.S.C. Section 1734 solely to indicate this fact.
REFERENCES
- 1.ActiGraph. Actisoft Analysis Software 3.2 User's Manual. Fort Walton Beach, FL: MTI Health Services, 2005.
- 2.Bassett DR, Ainsworth BE, Swartz AM, Strath SJ, O'Brien WL, King GA. Validity of four motion sensors in measuring moderate intensity physical activity. Med Sci Sports Exerc 32: S471–S480, 2000. [DOI] [PubMed] [Google Scholar]
- 3.Brage S, Brage N, Wedderkopp N, Froberg K. Reliability and validity of the computer science and applications accelerometer in a mechanical setting. MPEE 7: 101–119, 2003. [Google Scholar]
- 4.Crouter SE, Clowers KG, Bassett DR Jr. A novel method for using accelerometer data to predict energy expenditure. J Appl Physiol 100: 1324–1331, 2006. [DOI] [PubMed] [Google Scholar]
- 5.Esliger DW, Tremblay MS. Technical reliability assessment of three accelerometer models in a mechanical setup. Med Sci Sports Exerc 38: 2173–2181, 2006. [DOI] [PubMed] [Google Scholar]
- 6.Fairweather SC, Reilly JJ, Grant S, Whittaker A, Paton JY. Using the computer science and applications (CSA) activity monitor in preschool children. Pediatr Exerc Sci 11: 413–420, 1999. [Google Scholar]
- 7.Freedson PS, Melanson E, Sirard J. Calibration of the Computer Science and Applications, Inc. accelerometer. Med Sci Sports Exerc 30: 777–781, 1998. [DOI] [PubMed] [Google Scholar]
- 8.Fudge BW, Wilson J, Easton C, Irwin L, Clark J, Haddow O, Kayser B, Pitsiladis YP. Estimation of oxygen uptake during fast running using accelerometry and heart rate. Med Sci Sports Exerc 39: 192–198, 2007. [DOI] [PubMed] [Google Scholar]
- 9.Healy GN, Dunstan DW, Salmon J, Cerin E, Shaw JE, Zimmet PZ, Owen N. Objectively measured light-intensity physical activity is independently associated with 2-h plasma glucose. Diabetes Care 30: 1384–1389, 2007. [DOI] [PubMed] [Google Scholar]
- 10.Healy GN, Wijndaele K, Dunstan DW, Shaw JE, Salmon J, Zimmet PZ, Owen N. Objectively measured sedentary time, physical activity, and metabolic risk: the Australian Diabetes, Obesity and Lifestyle Study (AusDiab). Diabetes Care 31: 369–371, 2008. [DOI] [PubMed] [Google Scholar]
- 11.Hendelman D, Miller K, Baggett C, Debold E, Freedson P. Validity of accelerometry for the assessment of moderate intensity physical activity in the field. Med Sci Sports Exerc 32: S442–S449, 2000. [DOI] [PubMed] [Google Scholar]
- 12.Matthews CE, Chen KY, Freedson PS, Buchowski MS, Beech BM, Pate RR, Troiano RP. Amount of time spent in sedentary behaviors in the United States, 2003–2004. Am J Epidemiol 167: 875–881, 2008. [DOI] [PMC free article] [PubMed] [Google Scholar]
- 13.Melanson EL, Freedson PS. Validity of the Computer Science and Applications, Inc (CSA) activity monitor. Med Sci Sports Exerc 27: 934–940, 1995. [PubMed] [Google Scholar]
- 14.Metcalf BS, Curnow JS, Evans C, Voss LD, Wilkin TJ. Technical reliability of the CSA activity monitor: the EarlyBird Study. Med Sci Sports Exerc 34: 1533–1537, 2002. [DOI] [PubMed] [Google Scholar]
- 15.Nichols JF, Morgan CG, Chabot LE, Sallis JF, Calfas KJ. Assessment of physical activity with the Computer Science and Applications, Inc., accelerometer: laboratory versus field validation. Res Q Exerc Sport 71: 36–43, 2000. [DOI] [PubMed] [Google Scholar]
- 16.Orendurff MS, Segal AD, Klute GK, Berge JS, Rohr ES, Kadel NJ. The effect of walking speed on center of mass displacement. J Rehabil Res Dev 41: 829–834, 2004. [DOI] [PubMed] [Google Scholar]
- 17.Pober DM, Staudenmayer J, Raphael C, Freedson PS. Development of novel techniques to classify physical activity mode using accelerometers. Med Sci Sports Exerc 38: 1626–1634, 2006. [DOI] [PubMed] [Google Scholar]
- 18.Rothney MP, Schaefer EV, Neumann MM, Choi L, Chen KY. Validity of physical activity intensity predictions by ActiGraph, Actical, and RT3 accelerometers. Obesity (Silver Spring) 16: 1946–1952, 2008. [DOI] [PMC free article] [PubMed] [Google Scholar]
- 19.Schepens B, Willems PA, Cavagna GA. The mechanics of running in children. J Physiol 509: 927–940, 1998. [DOI] [PMC free article] [PubMed] [Google Scholar]
- 20.Sun M, Hill JO. A method for measuring mechanical work and work efficiency during human activities. J Biomech 26: 229–241, 1993. [DOI] [PubMed] [Google Scholar]
- 21.Swartz AM, Strath SJ, Bassett DR Jr, O'Brien WL, King GA, Ainsworth BE. Estimation of energy expenditure using CSA accelerometers at hip and wrist sites. Med Sci Sports Exerc 32: S450–S456, 2000. [DOI] [PubMed] [Google Scholar]
- 22.Troiano RP, Berrigan D, Dodd KW, Masse LC, Tilert T, McDowell M. Physical activity in the United States measured by accelerometer. Med Sci Sports Exerc 40: 181–188, 2008. [DOI] [PubMed] [Google Scholar]
- 23.Tryon WW, Williams R. Fully proportional actigraphy: a new instrument. Behav Res Methods Instrum Comput 28: 392–403, 1996. [Google Scholar]
- 24.Welk GJ Principles of design and analyses for the calibration of accelerometry-based activity monitors. Med Sci Sports Exerc 37: S501–S511, 2005. [DOI] [PubMed] [Google Scholar]
- 25.Welk GJ, Schaben JA, Morrow JR Jr. Reliability of accelerometry-based activity monitors: a generalizability study. Med Sci Sports Exerc 36: 1637–1645, 2004. [PubMed] [Google Scholar]
- 26.Yngve A, Nilsson A, Sjostrom M, Ekelund U. Effect of monitor placement and of activity setting on the MTI accelerometer output. Med Sci Sports Exerc 35: 320–326, 2003. [DOI] [PubMed] [Google Scholar]


