Abstract
During high-salt (HS) diet the kidney increases urinary Na+ and volume excretion to match intake. We recently reported that HS provokes a redistribution of distal convoluted tubule Na+-Cl− cotransporter (NCC) from apical to subapical vesicles and decreases NCC abundance. This study aimed to test the hypothesis that the other renal Na+ transporters' abundance and or subcellular distribution is decreased by HS diet. Six-week-old Sprague-Dawley rats were fed a normal (NS) 0.4% NaCl diet or a HS 4% NaCl diet for 3 wk or overnight. Kidneys excised from anesthetized rats were fractionated on density gradients or analyzed by microscopy; transporters and associated regulators were detected with specific antibodies. Three-week HS doubled Na+/H+ exchanger (NHE)3 phosphorylation at serine 552 and provoked a redistribution of NHE3, dipeptidyl peptidase IV (DPPIV), myosin VI, Na+-Pi cotransporter (NaPi)-2, ANG II type 2 receptor (AT2R), aminopeptidase N (APN), Na+-K+-2Cl− cotransporter (NKCC2), epithelial Na+ channel (ENaC) β-subunit, and Na+-K+-ATPase (NKA) α1- and β1-subunits from low-density plasma membrane-enriched fractions to higher-density intracellular membrane-enriched fractions. NHE3, myosin VI, and AT2R retraction to the base of the microvilli (MV) during HS was evident by confocal microscopy. HS did not change abundance of NHE3, NKCC, or NKA α1- or β1-subunits but increased ENaC-β in high-density intracellular enriched membranes. Responses to HS were fully apparent after just 18 h. We propose that retraction of NHE3 to the base of the MV, driven by myosin VI and NHE3 phosphorylation and accompanied by redistribution of the NHE3 regulator DPPIV, contributes to a decrease in proximal tubule Na+ reabsorption during HS and that redistribution of transporters out of low-density plasma membrane-enriched fractions in the thick ascending limb of the loop of Henle and distal nephron may also contribute to the homeostatic natriuretic response to HS diet.
Keywords: sodium chloride, kidney, natriuresis, salt-sensitive hypertension
a high dietary sodium load provokes a thirst that increases extracellular fluid volume (ECFV), maintaining plasma Na+ concentration in a normal range (40). The kidneys affect natriuretic and diuretic responses to match salt and water output to intake and restore ECFV. If volume is not corrected, it provokes a generalized vascular contraction to normalize tissue blood flow, resulting in hypertension. Establishing the molecular mechanisms by which the kidney regulates Na+ and ECFV homeostasis under normal conditions is an important goal because it will identify candidates that may contribute to salt-sensitive hypertension (6).
Na+ transport along the nephron can be regulated by altering 1) total transporter abundance, 2) subcellular distribution of transporters, or 3) activity per transporter. Previous studies indicate that high dietary NaCl intake decreases the abundance of the distal convoluted tubule (DCT) Na+-Cl− cotransporter (NCC) but not the abundance or activity of proximal tubule (PT) Na+/H+ exchanger isoform 3 (NHE3), or thick ascending limb (TAL) Na-K-2Cl cotransporter (NKCC2) abundance (17, 37, 41). High salt intake decreases the activity of cortical Na+-K+-ATPase (NKA) (36) but not NKA abundance (41). Finally, switching from Na+ free intake to 0.9% saline drinking water decreases abundance of all three epithelial Na+ channel (ENaC) subunits (9). These responses likely contribute to the natriuresis accompanying high-salt (HS) diet.
It is now clear that redistribution of Na+ transporters between the plasma membrane and intracellular membranes is a homeostatic mechanism to regulate Na+ reabsorption. We recently showed (37) that the ratio of DCT NCC present at the apical membrane versus intracellular pools decreases during HS diet. Trafficking of cortical collecting duct (CCD) ENaC β- and γ-subunits, TAL NKCC2, and PT NKA has also been reported (13, 25, 36). We have also observed trafficking within domains of the PT brush border: NHE3 retracts from the top to the base of the PT microvilli (MV) during acute hypertension (47) or inhibition of the renin-angiotensin system (24). There is recent evidence that phosphorylation of Na+ transporters (or associated proteins) may alter Na+ transport by changing distribution. The phosphorylation status of NHE3 is associated with a change in its subcellular distribution (20). Phosphorylation of Na+/H+ exchanger regulatory factor (NHERF)-1, a Na+-Pi cotransporter type 2 (NaPi-2) regulator, provokes NaPi-2 endocytosis (44). Phosphorylation of NKCC2 and NCC are associated with change in their activity and/or subcellular distribution (13, 49).
Regarding mechanisms to connect the salt diet to the natriuresis, there is a growing body of evidence suggesting that ANG II type 2 receptors (AT2R), very abundant in proximal and distal tubules (30), participate in ECFV homeostasis by antagonizing AT1R-mediated pressor effects of ANG II (5) and that ANG III may be the preferred AT2R ligand (35). Aminopeptidase N (APN), highly expressed in PT apical membrane, degrades ANG III to ANG IV and, by thus regulating substrate for AT2R, may also contribute to salt homeostasis (21).
The focus of this study was to test the hypothesis that changes in abundance or distribution of the other renal Na+ transporters is altered by HS diet in a fashion that would facilitate natriuresis. We aimed to determine 1) the effects of HS on subcellular distribution and abundance of Na+ transporters and associated proteins along the nephron, 2) whether phosphorylation of PT NHE3 or TAL NKCC2 is altered during HS, 3) the time course of response to HS, and 4) the effects of HS diet on distribution and abundance of renal AT2R and APN. The results demonstrate that 3-wk HS provokes an increase in NHE3 phosphorylation and retraction of PT NHE3 and the molecular motor myosin VI to the base of the MV, along with the shift of cortical dipeptidyl peptidase IV (DPPIV), NaPi-2, NKCC2, NCC, ENaC-β, NKA α1- and β1-subunits, AT2R, and APN from low-density membranes to higher-density membranes. The responses to HS were complete after just overnight feeding. These results suggest that homeostatic mechanisms to regulate Na+ reabsorption in high salt intake include changing the abundance as well as the distribution of the Na+ transporters and their regulators.
METHODS
Animal protocols.
All animal experiments were approved by the University of Southern California Keck School of Medicine Institutional Animal Care and Use Committee and were conducted in accordance with the National Institutes of Health Guide for the Care and Use of Laboratory Animals.
Experiments were performed on 6-wk-old male Sprague-Dawley rats (Harlan, San Diego, CA) fed normal 0.4% NaCl (NS) diet for 3 wk and then switched to a high-salt 4% NaCl (HS) diet or maintained on NS for either an additional 3 wk or overnight (n = 7 or 8 each). Animals had free access to water in all protocols. At the end of each protocol, urine was collected for 5 h in a metabolic cage. Serum was collected via tail vein cannulation under anesthesia with an intramuscular injection of ketamine (Fort Dodge Laboratories, Overland Park, KS) and xylazine [1:1 (vol/vol), Miles, Shawnee Mission, KS]. Urinary and serum Na+ and K+ were measured with a flame photometer (Radiometer FLM3, Copenhagen, Denmark).
Homogenization and subcellular fractionation.
As described in detail previously (47), kidneys of the anesthetized rats were cooled in situ by flushing with cold PBS and then excised. The renal cortex was dissected, homogenized in isolation buffer (5% sorbitol, 0.5 mM disodium EDTA, 0.2 mM phenylmethylsulfonyl fluoride, 9 g/ml aprotinin, and 5 mM histidine-imidazole buffer, pH 7.5), and centrifuged at 2,000 g for 10 min twice to remove debris. The low-speed supernatants were pooled (So), loaded between two hyperbolic sorbitol gradients, and centrifuged at 100,000 g for 5 h. Twelve fractions were collected, pelleted, resuspended in 1 ml of isolation buffer, and stored at −80°C pending assays. Five or six animals per group were analyzed.
Immunoblot analysis and antibodies.
The density distribution pattern of Na+ transporters and associated proteins was determined by assaying 10 μl of each fraction denatured in SDS-PAGE sample buffer for 30 min at 37°C, resolved on a 7.5% SDS polyacrylamide gels (23), and then transferred to polyvinylidene difluoride membranes (Millipore Immobilon-P). The density distribution pattern of a protein is expressed as the percentage of the total signal in each fraction, where the sum total signal in 12 fractions = 100%; thus the density pattern is independent of the total amount of protein loaded on the gradient. In a subset of analyses, specifically AT2R and APN and phosphorylated forms of NHE3 and NKCC2, we examined distribution and abundance regulation together by normalizing the density pattern to the amount of protein loaded on the gradient. To combine the arbitrary density values for statistical analyses, we normalized them to fraction 6 of NS within each pair.
To assess total pool size of transporters or associated proteins, a constant amount of the So protein from each cortex or medulla was analyzed. In all immunoblot assays, one-half the protein was also assayed in parallel to verify linearity of the detection system. Where distinct multiple bands were detected, the bands were analyzed both separately and together. Membrane blots were probed with the following antibodies: polyclonal NHE3-C00 anti-NHE3 [1:2,000; A. A. McDonough lab (47)], anti-myosin VI (1:2,000; Proteus Biosciences, Ramona, CA), McNaPi2 anti-NaPi-2 (1:1,000; McDonough lab), anti-DPPIV (1:1,000; M. Farquhar, Univ. of California San Diego), 459 anti-megalin (1:5,000; M. Farquhar), anti-NKA β1 (1:500; McDonough lab), TSCα anti-NCC (1:500; D. Ellison, Oregon Health and Science Univ.), anti-ENaC-β [1:500; L. Palmer, Cornell Univ. (9)], R-1046 anti-NHERF-1 (1:3,000; E. Weinman, Univ. of Maryland), anti-AT2 receptor (1:1,000; Santa Cruz Biotechnology), anti-APN (1:100; Santa Cruz Biotechnology), anti-NHE3 phosphoserine 552 (1:1,000; Santa Cruz Biotechnology), R5 anti-phospho-NKCC2 [1:2,000; B. Forbush, Yale Univ. (12)], monoclonal T4 anti-NKCC (1:3,000; C. Lytle, Univ. of California Riverside), and 464.6 anti-NKA α1 (1:200; M. Kashgarian, Yale Univ.). All blots were incubated with Alexa 680-labeled goat anti-rabbit, goat anti-mouse, or donkey anti-goat secondary antibody (Molecular Probes, Eugene, OR) and detected with an Odyssey Infrared Imaging System (Li-COR, Lincoln, NE) and accompanying software.
Confocal microscopy.
As described previously (47), left kidneys from rats on 3-wk NS or HS diets (n = 3 each) were fixed in situ by bathing in PLP fixative (2% paraformaldehyde, 75 mM lysine, and 10 mM Na-periodate, pH 7.4) for 20 min and then postfixed in PLP for another 2–3 h. The fixed tissue was cryoprotected by incubation overnight in 30% sucrose in PBS, embedded in Tissue-Tek OCT compound (Sakura Finetek, Torrance, CA), and frozen in liquid nitrogen. Cryosections (5 μm) were cut and transferred to Fisher Superfrost Plus-charged glass slides and air dried. Sections were rehydrated in PBS and washed 10 min in 50 mM NH4Cl in PBS and then with 1% SDS in PBS for 4 min (4). For detection of NHE3, DPPIV, NaPi-2, and NHERF-1 dual labeling was performed by incubating with monoclonal anti-villin at 1:100 dilution (Immunotech, Chicago, IL) and anti-NHE3 at 1:100, anti-DPPIV at 1:100, anti-NHERF-1 at 1:100, or anti-NaPi-2 at 1:50 for 1.5 h. The sections were then incubated with a mixture of FITC-conjugated goat anti-rabbit (Cappel Research Products, Durham, NC) and Alexa 568-conjugated goat anti-mouse (Molecular Probes) secondary antibodies diluted at 1:100 for 1 h and mounted in Prolong Antifade (Molecular Probes). Slides were viewed with a Nikon PCM Quantitative Measuring High-Performance Confocal System equipped with filters for both FITC and TRITC fluorescence attached to a Nikon TE300 Quantum upright microscope. Images were acquired with Simple PCI C-Imaging Hardware and Quantitative Measuring Software.
For AT2 receptor localization, kidneys from rats fed HS or NS diet for 48 h (n = 2 each) were excised and renal cortex was fixed and processed as above. One section of each treatment group was analyzed on the same object glass, side by side, to ensure comparable antibody treatment. Sections were labeled with a polyclonal anti-AT2 receptor antibody at 1:50 for 1.5 h and then FITC-conjugated goat-anti-rabbit secondary antibody at 1:100 for 1 h. Slides were viewed with a Zeiss LSM 510 microscope with differential interference contrast (DIC) overlay.
For myosin VI localization, kidneys from five animals fed with 3-wk HS or NS diet were excised and tissue blocks were trimmed from the cortex and fixed in 4% paraformaldehyde solution containing 0.1 M sodium cacodylate, pH 7.4 for 3 h. The tissue blocks were dehydrated in a series of graded ethanol and in xylene overnight, infiltrated, and embedded in paraffin. For immunofluorescence and confocal laser scanning microscopy 2-μm sections were cut on a rotary microtome (Leica Microsystems, Herlev, Denmark), and one section of each kind of tissue was collected on the same object glass, side by side, to ensure comparable treatments. Sections were then deparaffinized, rehydrated, and treated for antigen retrieval by boiling in 10 mM Tris (pH 9) supplemented with 0.5 mM EGTA. To block free aldehyde groups, the sections were incubated with 50 mM NH4Cl, and to block unspecific binding sites they were treated with PBS supplemented with 1% BSA, 0.2% gelatin, and 0.05% saponin. The sections were incubated for 60 min at room temperature with rabbit anti-myosin-VI IgG (Proteus BioSciences) diluted 1:50 in blocking medium. After being rinsed with the antibody diluent the sections were incubated for 60 min with Alexa Fluor 488-conjugated goat anti-rabbit IgG (Molecular Probes) diluted 1:300, rinsed, and mounted with DAKO fluorescence mounting medium (DAKO Danmark, Glostrup, Denmark). The sections were analyzed and recorded with a Leica DMIRE2 confocal laser scanning microscope (Leica Microsystems, Heidelberg, Germany) with an HCX Pl Apo ×63 objective (numerical aperture 1.32). Some immunofluorescence images were merged with the Nomarski DIC images to reveal the distribution of the fluorophore as related to the tissue structure.
Quantitation and statistical analysis.
Data are expressed as means ± SD. Differences were regarded as significant at P < 0.05. In density gradient assays, two-way ANOVA was applied to determine whether there was a significant effect of treatment on the overall pattern. After significance was established, the location of the difference in the pattern was assessed by two-tailed Student's t-test assuming equal variance. Difference in total abundance of various Na+ transporters and accessory proteins was assessed by unpaired two-tailed Student's t-test.
RESULTS
Effect of dietary salt on physiological indexes.
Six-week-old Sprague-Dawley rats were fed NS diet for 3 wk and then either maintained on NS or switched to HS diet for 3 wk or for overnight. As summarized in Table 1, plasma Na+ and K+ concentrations were not affected by changes in dietary NaCl. HS diet, whether 3 wk or overnight, increased urinary Na+ excretion ∼10-fold and urine output 3-fold. Because the overnight HS-fed rats were 3 wk younger than the animals fed for another 3 wk, their body weights were lower. Our lab previously reported (37) that 3-wk 4% NaCl diet decreased plasma aldosterone to an undetectable level.
Table 1.
Effects of dietary salt on plasma and urine electrolytes
| 0.4% NaCl (3 wk) | 4% NaCl (3 wk) | 4% NaCl (overnight) | |
|---|---|---|---|
| No. of rats | 7 | 8 | 8 |
| Final body weight, g | 353±8 | 364±2 | 293±20* |
| Plasma [Na+], mM | 142.0±5.7 | 141.1±0.1 | 145.0±4.2 |
| Plasma [K+], mM | 3.9±0.2 | 4.1±0.2 | 4.0±0.2 |
| Urine Na+ excretion, mmol·h−1·kg−1 | 0.04±0.02 | 0.45±0.23* | 0.4±0.15* |
| Urine output, ml/h | 0.2±0.1 | 0.73±0.37* | 0.61±0.27* |
Values are means ± SD. [Na+], [K+], Na+, K+ concentration.
P < 0.05 vs. 0.4% NaCl (3 wk) group.
Effect of 3-wk HS on abundance of Na+ transporters in cortex and medulla.
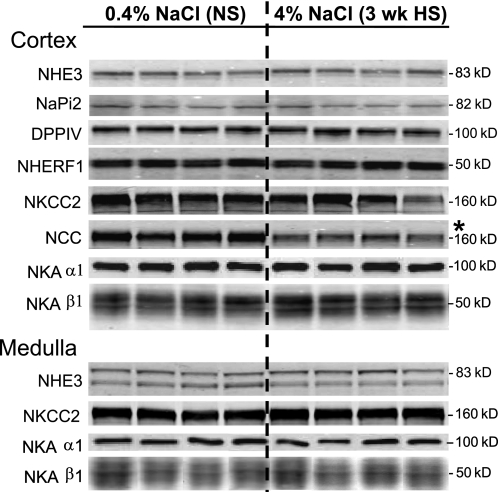
To address whether the total pool size of the Na+ transporters was altered during 3-wk HS, So samples (containing both soluble and membrane proteins) were assayed by immunoblot (Fig. 1). Three-week HS diet decreased abundance of cortical NCC by 37%, as we previously reported (37) (NS 1.00 ± 0.25, HS 0.63 ± 0.14) without changing abundance of NHE3, NaPi-2, NKCC2, or NKA subunits. ENaC subunits were not assayed in this set.
Fig. 1.
Total pool size analysis of renal cortical and medullary transporters and associated proteins from 0.4% NaCl normal salt (NS)- vs. 4% NaCl high salt (3 wk HS)-fed rats. Immunoblots of homogenate samples (total supernatant after low-speed centrifugation) are shown in which each lane represents a sample from an individual rat. Protein loaded/lane adjusted to ensure linearity of the detection system, assessed on each blot: 40 μg for Na+/H+ exchanger (NHE)3 and Na+/H+ exchanger regulatory factor (NHERF)-1; 20 μg for Na+-Pi cotransporter (NaPi)-2, Na+-K+-Cl− cotransporter (NKCC2), and medullary Na+-K+-ATPase (NKA) β1-subunit; 15 μg for dipeptidyl peptidase IV (DPPIV); 32 μg for Na+-Cl− cotransporter (NCC) and cortical NKA β1; 1 μg for cortical NKA α1-subunit; 72 μg for medullary NHE3; 0.25 μg for medullary NKA α1. Apparent molecular mass is indicated on right. Proteins were detected and quantified with the Odyssey Infrared Imaging System (Li-COR). *P < 0.05 vs. NS, assessed by paired Student's t-test.
Effect of 3-wk HS on subcellular distribution and phosphorylation of PT NHE3.
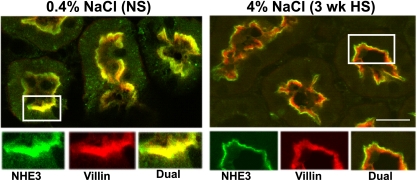
To establish the precise subcellular distribution of NHE3, double labeling with antibodies to NHE3 versus the microvillar actin-bundling protein villin was performed on cryosections of kidneys and analyzed by confocal microscopy (Fig. 2). NHE3 was found throughout the apical brush-border MV in rats on NS, evident by colocalization with villin (yellow). After 3-wk HS, NHE3 (green) was retracted out of the MV, revealing only villin staining in the MV (red). This response is analogous to the rapid NHE3 redistribution response to an acute hypertension in which we have shown (by immunoelectron microscopy) that NHE3 is concentrated at the base of the MV (47), i.e., not internalized.
Fig. 2.
Indirect immunofluorescence microscopy of NHE3 distribution in the proximal tubules of rats on 3-wk 0.4% NaCl (NS) or 4% NaCl (HS). The kidneys were fixed as described in methods. The antibody against NHE3 was polyclonal and detected with FITC-conjugated goat anti-rabbit secondary antibody, whereas the antibody against villin was monoclonal and detected with Alexa 568-conjugated goat anti-mouse secondary antibody. Surface sections were double-labeled against NHE3 (green) and villin (red). In rats fed 4% NaCl for 3 wk, NHE3 is retracted from the body of the microvilli to the base (green), revealing the villin staining in red. n = 3/group. Bar, 10 μm.
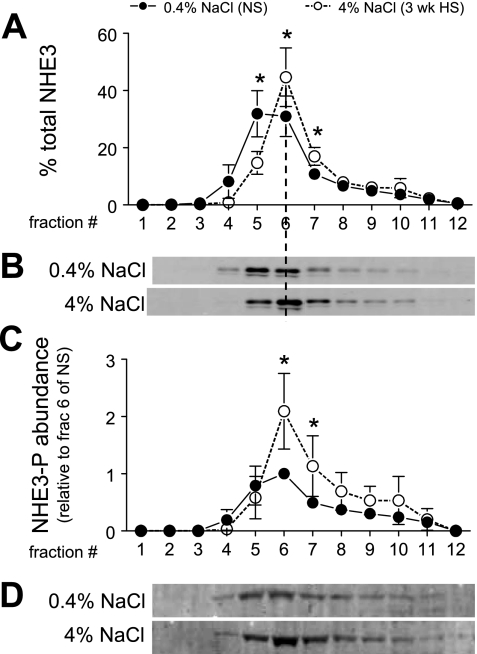
Density gradient fractionation was used to quantify the redistribution of NHE3 in NS versus 3-wk HS. Previous membrane marker assays demonstrated that fractions 3–5 are enriched in both apical and basolateral plasma membranes, fractions 6–8 also contain apical membrane markers as well as markers of the renal intermicrovillar cleft region, and fractions 9–11 are enriched in endosomal and lysosomal markers (45). A constant volume of each fraction was analyzed by immunoblot in order to ascertain the overall density distribution pattern (Fig. 3A). The pattern was assessed by ANOVA and, only if shown to be significantly altered by dietary salt, individual fractions were compared for statistical difference. Three-week HS provoked a significant redistribution of NHE3 out of apical membrane-enriched low-density fractions to higher-density membranes. Specifically, ∼40% of the total NHE3 is located in fractions 1–5 in NS-fed rats, and after HS feeding this falls to 15% along with an increase in NHE3 in higher-density fractions. These findings demonstrate that the redistribution of NHE3 to higher-density membranes corresponds to the retraction of NHE3 out of the body of the apical MV to the base of the MV observed by confocal microscopy (Fig. 2).
Fig. 3.
Density distribution of total NHE3 (A and B) and abundance of phosphorylated NHE3 (NHE3-P; C and D) in rats on 3-wk 0.4% NaCl (n = 5) or 4% NaCl (n = 5). In A, NHE3 immunoreactivity is expressed as % of the total signal in all 12 fractions. In C, arbitrary density values were normalized to the amount of protein loaded on the gradient and then normalized to fraction 6 of NS within each pair for statistical analyses. Typical immunoblots of total NHE3 (B) and NHE3-P at serine 552 (D) from a constant sample volume from each gradient fraction are shown. Values are means ± SD. *P < 0.05 vs. NS, assessed by ANOVA followed by paired Student's t-test.
To examine whether HS diet alters phosphorylation state of NHE3 we used phosphospecific antibodies generated to NHE3 phosphorylated at serine 552 and at serine 605 (19). We could not detect a reproducible signal above background with the anti-PS-605 antibody, so we did not pursue that site of regulation further. As shown in Fig. 3C, HS induced an increase in the abundance of NHE3 phosphorylated at serine 552 (NHE3-PS552) in fractions 6–7 relative to that in NS-fed rats. These fractions are enriched in megalin (Fig. 4C), a marker for the intermicrovillar cleft region. There was no increase in fractions 4–5, which are enriched in villi (45), indicating that HS diet induces an increase in NHE3-PS552 at the base of MV coincident with the redistribution of total NHE3 from the body to the base of MV (Fig. 2, Fig. 3, A and B).
Fig. 4.
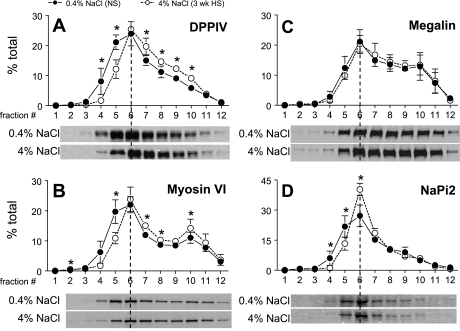
Density distribution of renal cortical DPPIV (A), myosin VI (B), megalin (C), and NaPi-2 (D) in rats on 3-wk 0.4% NaCl (n = 5) or 4% NaCl (n = 5). Typical immunoblots of a constant sample volume from each gradient fraction are shown for each protein. Immunoreactivity is expressed as % of the total signal in all 12 fractions. Values are means ± SD. *P < 0.05 vs. NS, assessed by ANOVA followed by paired Student's t-test.
Effect of 3-wk HS on subcellular distribution of PT DPPIV, myosin VI, NaPi-2, and NHERF-1.
Our group previously demonstrated that DPPIV, a known NHE3 regulator (14), shifted to higher densities during hypertension (27) and angiotensin-converting enzyme (ACE) inhibition (24). We also demonstrated (48) that myosin VI, an unconventional actin-based molecular motor, redistributes with NHE3 to the base of the apical MV during hypertension and ACE inhibition, suggesting that this motor could drive NHE3 retraction. We have compared NHE3 and NaPi-2 redistribution during hypertension or parathyroid hormone (PTH) or ACE inhibitor (ACEI) treatment and found that NaPi-2 redistributes to fractions 6–11 and, by confocal analysis, accumulates in subapical endosomes/lysosomes (46, 47). These findings prompted us to investigate whether the distribution or abundance of these proteins is similarly altered by HS diet.
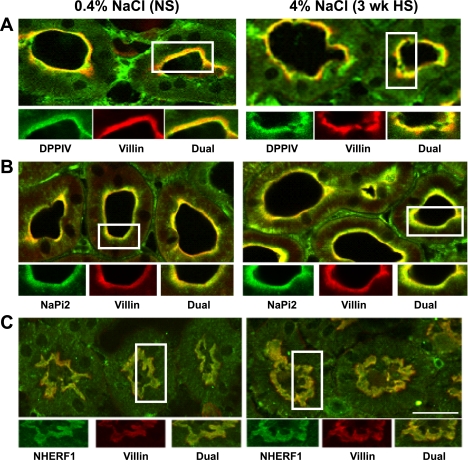
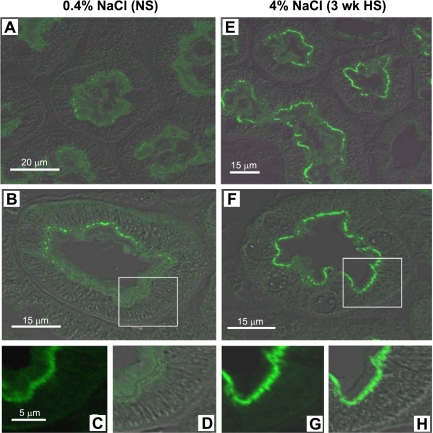
We did not observe any significant change in total abundance of NaPi-2, DPPIV, myosin VI, or NHERF-1 during HS (Fig. 1). Density distribution analysis revealed that 3-wk HS provoked a significant 17% shift of the total DPPIV out of fractions 1–5 into higher-density fractions (Fig. 4A). By confocal microscopy DPPIV did not completely leave the MV (Fig. 5A), suggesting that the redistribution of this very abundant protein was only partial. There was also a shift in myosin VI distribution with HS (Fig. 4B): ∼27% of the total myosin VI is located in fractions 1–5 in NS-fed rats versus only 14% after HS feeding. The redistribution of myosin VI was also carefully investigated by confocal microscopy analysis (Fig. 6). In NS-fed rats, myosin VI is distributed over the whole MV (Fig. 6, A–D), while in HS-fed animals myosin VI is moved to the base of the MV (Fig. 6, E–H). This response is analogous to the redistribution previously observed during hypertension, which we quantified by immunoelectron microscopy (48).
Fig. 5.
Indirect immunofluorescence microscopy of DPPIV (A), NaPi-2 (B), and NHERF-1 (C) distribution in the proximal tubules of rats on 3-wk 0.4% NaCl (NS) or 4% NaCl (HS). The kidneys were fixed as described in methods. The antibodies against DPPIV, NaPi-2, and NHERF-1 were polyclonal and detected with FITC-conjugated goat anti-rabbit secondary antibody, whereas the antibody against villin was monoclonal and detected with Alexa 568-conjugated goat anti-mouse secondary antibody. A: surface sections were double-labeled against DPPIV (green) and villin (red). B: sections were double-labeled against NaPi-2 (green) and villin (red). C: sections were double-labeled against NHERF-1 (green) and villin (red). Bar, 10 μm.
Fig. 6.
Indirect immunofluorescence microscopy and differential interference contrast (DIC) of myosin VI in the proximal tubules of rats on 3-wk 0.4% NaCl (NS; A–D) or 4% NaCl (HS; E–H). The kidneys were fixed as described in methods. Kidneys of each group were sectioned at a thickness of 2 μm and placed side by side on the same object glass to guarantee similar treatment when immunostained and therefore a good basis for comparisons. Sections were labeled with polyclonal anti-myosin VI antibody and then Alexa Fluor 488-conjugated goat anti-rabbit secondary antibody. Low-magnification images from proximal tubules of NS (A)- and HS (E)-fed rats are shown to illustrate overviews. B and F: overlay of immunostaining for myosin VI and DIC on cross sections of proximal tubules in NS and HS, respectively. C, D, G, and H: magnified images from B and F. Same magnification for C, D, G, and H. n = 5/group. In NS-fed rats, myosin VI is distributed over the whole microvilli, while in HS-fed animals myosin VI is moved to the base of the microvilli and the apical cytoplasm.
HS provoked a 13% shift of the brush-border sodium-phosphate transporter NaPi-2 out of fractions 1–5 to higher-density membranes (Fig. 4D). Confocal analysis did not provide evidence for a loss of NaPi-2 from the MV or accumulation in subapical endosomes (Fig. 5B), as we previously observed after PTH or ACE inhibition or during hypertension, indicating that the response to HS diet is distinct from that to these regulators and also that the effect is far smaller in magnitude. The localization of the NaPi-2 regulator protein NHERF-1 was not changed by HS diet (Fig. 5C), providing evidence that HS induces a physical dissociation of NaPi-2 from NHERF-1, as recently reported for the response to PTH (44). The distribution of the scavenger receptor protein megalin, localized to the intermicrovillar cleft, was not significantly altered by HS diet (Fig. 4C).
Effects of 3-wk HS on density distribution and abundance of AT2R and APN.
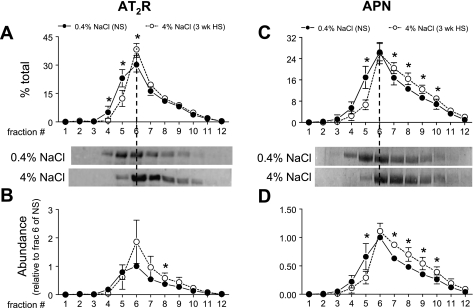
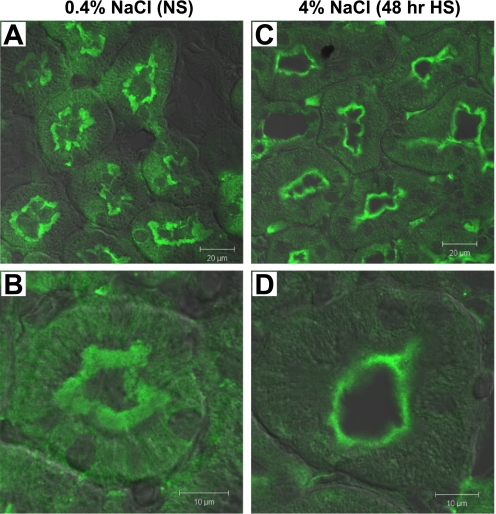
Intrarenal AT2R and APN (which degrades ANG III to ANG IV) are both enriched in PT and postulated to play a role in natriuretic responses (5, 21). We previously demonstrated that APN redistributes to higher densities with ACEI (24). These findings stimulated us to test whether HS diet changes the subcellular distribution or abundance of PT AT2R and APN. As shown in Fig. 7A, 3-wk HS diet induced a 15% shift of AT2R from low-density fractions 1–5 (29% in NS vs. 14% in HS) to higher-density fractions, suggesting that there is a change in the ratio of AT2R in different membrane populations during HS. Three-week HS diet also caused a 45% increase in AT2R total abundance as summarized in Fig. 7B, mostly in the middle fractions 6–8. Confocal immunofluorescence analysis was conducted as an independent strategy to evaluate the localization of AT2R (Fig. 8). With NS, AT2R is present primarily in the brush border, with less and diffuse staining in the basolateral membrane infoldings (Fig. 8, A and B), which is consistent with the previous report that AT2R is localized to both apical and basolateral membranes in PT (16). After 48-h HS, AT2R is retracted from the body to the base of the MV, and there is less AT2R staining in the basolateral membranes compared with NS (Fig. 8, C and D). Overall total AT2R abundance did not seem to change significantly with 48-h HS (Fig. 8, A and C). The detailed redistribution pathway of AT2R in HS, for example, whether AT2R is retracted to subapical vesicles (where it would be inaccessible) or the base of the microvilli (where it could be active), needs to be determined by electron microscopy. Figure 7C shows that HS diet provoked a 15% shift of APN from low-density fractions 1–5 (24% in NS vs. 9% in HS) to higher-density fractions, suggesting that there may be retraction of APN from brush border. HS diet did not cause a significant change in total abundance of APN (Fig. 7D), suggesting that redistribution may be the major mechanism of regulation of APN by HS diet.
Fig. 7.
ANG II type 2 receptor (AT2R) density distribution (A) and abundance (B) and aminopeptidase N (APN) density distribution (C) and abundance (D) in rats on 3-wk 0.4% NaCl (n = 5) or 4% NaCl (n = 5). In A and C, immunoreactivity is expressed as % of the total signal in all 12 fractions. In B and D, arbitrary density values are normalized to the amount of protein loaded on the gradient and then normalized to fraction 6 of NS within each pair for statistical analyses. Typical immunoblots of AT2R and APN from a constant sample volume from each gradient fraction are shown. Values are means ± SD. *P < 0.05 vs. NS, assessed by ANOVA followed by paired Student's t-test.
Fig. 8.
Indirect immunofluorescence microscopy and DIC overlay of AT2R in the proximal tubules of rats on 0.4% NaCl (NS; A and B) or 4% NaCl (48-h HS; C and D). The kidneys were fixed as described in methods. Kidney sections of each group were placed side by side on the same object glass to guarantee similar treatment when immunostained and therefore a good basis for comparisons. Sections were labeled with polyclonal anti-AT2R antibody and then FITC-conjugated goat anti-rabbit secondary antibody. Low-magnification images from proximal tubules of NS (A)- and 48-h HS (C)-fed rats are shown to illustrate overviews. High-magnification images from NS and 48-h HS are shown in B and D, respectively. n = 2/group. In NS-fed rats, AT2R is distributed over the whole microvilli, and there is diffuse AT2R located in basolateral membrane infoldings, while in HS-fed animals, AT2R is moved to the base of the microvilli and there is less apparent basolateral AT2R staining.
Effects of 3-wk HS on density distribution and abundance of NCC.
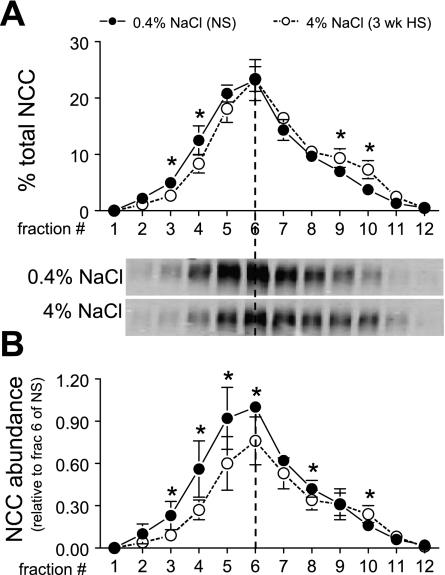
We recently provided evidence (37, 38) for redistribution of DCT NCC from plasma membrane to subapical cytoplasmic vesicles by immunoelectron microscopy during high-salt diet and during ACE inhibition coincident with redistribution from low-density to high-density membranes. In the present study we extended the density gradient analysis of NCC during HS vs. NS by combining it with an analysis of abundance, which decreases during HS diet, to determine whether the NCC abundance decreases in enriched plasma membranes, in subapical membranes, or in both pools. Figure 9A illustrates that 3-wk HS provokes a significant shift of NCC from fractions 2–5 (40% in NS vs. 30% in HS) to fractions 7–11 (36% in NS vs. 46% in HS), confirming our previous report. In Fig. 9B, it is evident that NCC abundance decreases significantly in apical plasma membrane-enriched fractions 3–6, and far less above fraction 6. These results indicate that 3-wk HS caused a dramatic fall in NCC in the apical membrane pool, while the intracellular pool size appears more stable. Whether the decrease in NCC at the apical membrane during HS is due to an increased rate of NCC degradation or decreased recruitment to the apical membrane remains to be determined.
Fig. 9.
NCC density distribution (A) and abundance (B) in rats on 3-wk 0.4% NaCl (n = 5) or 4% NaCl (n = 5). In A, immunoreactivity is expressed as % of the total signal in all 12 fractions. In B, arbitrary density values are normalized to the amount of protein loaded on the gradient and then normalized to fraction 6 of NS within each pair for statistical analyses. Typical immunoblots of NCC from a constant sample volume from each gradient fraction are shown. Values are means ± SD. *P < 0.05 vs. NS, assessed by ANOVA followed by paired Student's t-test.
Effects of 3-wk HS on density distribution and/or abundance of cortical NKCC2, ENaC-β, and NKA α1- and β1-subunits.
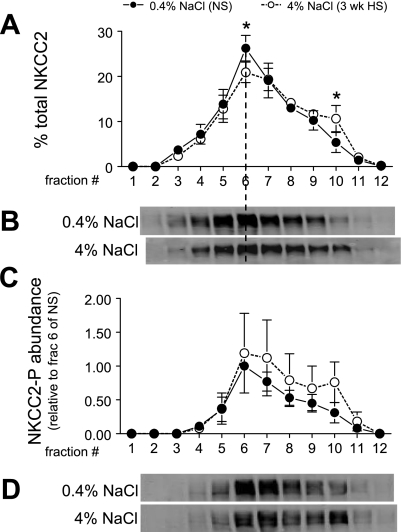
The role of NKCC2 in Na+ homeostasis has been demonstrated by the genetic disorder Bartter syndrome (39), but the role of NKCC2 regulation in natriuresis secondary to HS diet is less clear (7, 41). Studies have demonstrated the importance of trafficking and phosphorylation to the regulation of NKCC2 (13). We assumed, based on our analyses of PT NHE3 and DCT NCC, that a redistribution of NKCC2 out of the apical membranes would be manifest as a shift to higher-density membranes and aimed to investigate whether there was a change in subcellular distribution or phosphorylation of NKCC2 during HS diet. Since only cortex was fractionated on density gradients, the analyses do not include medullary NKCC2. As shown in Fig. 10A, HS diet provoked a small but significant shift of NKCC2 from fractions 1–6 (51% in NS vs. 42% in HS) to higher-density membranes, notably an increase in the endosomal enriched fraction 10. There was no significant change in either density distribution or abundance of phosphorylated NKCC2 (Fig. 10C). A caveat in interpretation of these results is that we cannot conclude that the shift of NKCC2 on density gradients represents an internalization of NKCC2 until it is confirmed by immunomicroscopy, although membrane markers suggest that plasma membranes have a lower density than endosomes or lysosomes (45).
Fig. 10.
Density distribution of total NKCC2 (A and B) and abundance of phosphorylated NKCC2 (NKCC2-P; C and D) in renal cortex of rats on 3-wk 0.4% NaCl (n = 5) or 4% NaCl (n = 5). In A, NKCC2 immunoreactivity is expressed as % of the total signal in all 12 fractions. In C, arbitrary density values are normalized to the amount of protein loaded on the gradient and then normalized to fraction 6 of NS within each pair for statistical analyses. Typical immunoblots of total NKCC2 (B) and NKCC2-P (D) from a constant sample volume from each gradient fraction are shown. Values are means ± SD. *P < 0.05 vs. NS, assessed by ANOVA followed by paired Student's t-test.
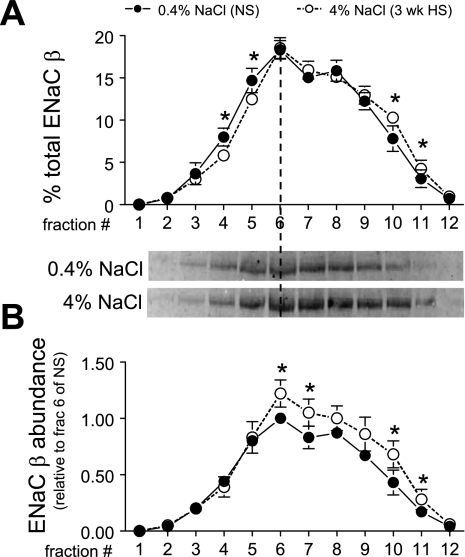
Immunomicroscopy evidence has shown that in CCD cells ENaC-α is localized mainly in a zone near the apical membrane, whereas ENaC-β and ENaC-γ are localized in both apical membrane and intracellular vesicles (15), suggesting subunit trafficking as a potential mechanism for the regulation of ENaC. The regulation of ENaC subunits by dietary salt has been widely studied (9, 25, 41), and this stimulated us to investigate whether HS diet changes the density distribution or abundance. We focused on the density distribution and abundance of ENaC-β, which provided the most reproducible signal. Three-week HS provoked a small but significant 5% shift of ENaC-β from fractions 3–5 to higher-density fractions (Fig. 11A). These results suggest a change in the ratio of ENaC-β between the apical surface and intracellular membranes. The ENaC-β abundance of each fraction (normalized to the total protein loaded onto the gradients) was also analyzed in Fig. 11B. There was no change in ENaC-β abundance in apical membrane-enriched low-density fractions 3–5 in HS versus NS, but there were significant increases in ENaC-β in the intracellular membrane-enriched higher-density fractions. Overall, total ENaC-β abundance increased 21% during HS, but the increase was restricted to the intracellular enriched membranes.
Fig. 11.
Epithelial Na+ channel (ENaC) β-subunit density distribution (A) and abundance (B) in renal cortex of rats on 3-wk 0.4% NaCl (n = 5) or 4% NaCl (n = 5). In A, immunoreactivity is expressed as % of the total signal in all 12 fractions. In B, arbitrary density values are normalized to the amount of protein loaded on the gradient and then normalized to fraction 6 of NS within each pair for statistical analyses. Typical immunoblots of ENaC-β from a constant sample volume from each gradient fraction are shown. Values are means ± SD. *P < 0.05 vs. NS, assessed by ANOVA followed by paired Student's t-test.
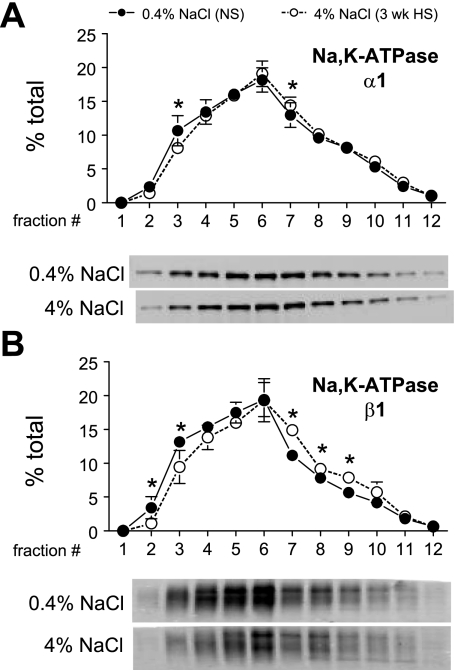
Previous studies suggested that salt loading regulates PT NKA by inhibiting its activity and moving the pumps away from the plasma membranes (36). We aimed to determine whether we could detect a HS diet-induced change in density distribution of renal cortical NKA in this in vivo model. The caveat is that every cell has NKA, including vascular, glomerular, and interstitial cells; however, since NKA activity is very high in PT and along the distal nephron (29) most of the activity will be epithelial in origin. As shown in Fig. 12, A and B, ANOVA analysis indicated that there were significant, albeit small, shifts in both α1- and β1-subunits, respectively, from plasma membrane-enriched lower-density fractions 1–5 to higher-density fractions. These results support the hypothesis that there may be a redistribution of NKA during HS diet, although we have no further information about destination or cell type involved.
Fig. 12.
NKA α1 (A)- and β1 (B)-subunit density distribution in renal cortex of rats on 3-wk 0.4% NaCl (n = 5) or 4% NaCl (n = 5). Typical immunoblots of a constant sample volume from each gradient fraction are shown for each protein. Immunoreactivity is expressed as % of the total signal in all 12 fractions. Values are means ± SD. *P < 0.05 vs. NS, assessed by ANOVA followed by paired Student's t-test.
Effects of overnight HS on abundance and density distribution of Na+ transporters and associated proteins.
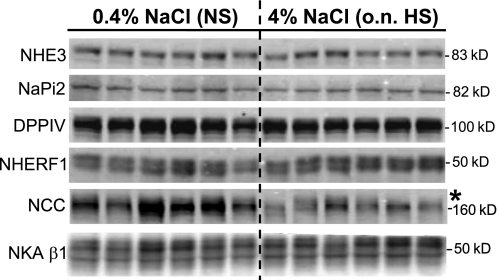
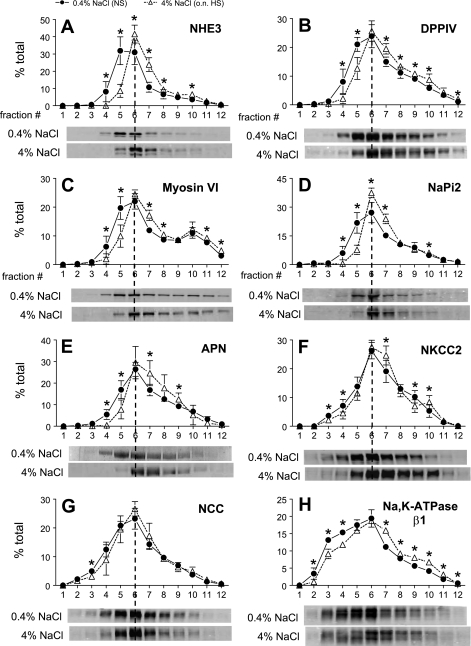
To determine how quickly the responses to HS occur, a group of rats were analyzed after overnight (18 h) HS diet. Basically, we found that the effects of HS on density distribution and abundance of the transporters and associated proteins were complete after 18-h HS. NCC abundance fell 49% compared with NS (Fig. 13), and the NHE3, DPPIV, myosin VI, NaPi-2, APN, NKCC2, NCC, and NKA β1-subunit redistribution responses were also fully evident just after overnight HS (Fig. 14). There was no significant difference between data collected after 18 h and data after 3-wk HS diet (Figs. 3, 4, 7, 9–12; distribution patterns were compared by ANOVA analysis). These results suggest that the kidney fully activates the molecular machinery to adapt to salt loading by 18 h of HS feeding, likely even quicker.
Fig. 13.
Total pool size analysis of renal cortical transporters and associated proteins in rats on 0.4% NaCl (NS) or overnight (o.n.) 4% NaCl (HS). Immunoblots of homogenate samples (total supernatant after low-speed centrifugation) are shown in which each lane represents a sample from an individual rat. Protein loaded/lane adjusted to ensure linearity of the detection system assessed on each blot: 40 μg for NHE3, DPPIV, NHERF-1, and NCC; 20 μg for NaPi-2 and NKA β1-subunit. Apparent molecular mass indicated on right. Proteins were detected and quantified with the Odyssey Infrared Imaging System (Li-COR). *P < 0.05 vs. NS, assessed by unpaired Student's t-test.
Fig. 14.
Density distribution of renal cortical NHE3 (A), DPPIV (B), myosin VI (C), NaPi-2 (D), APN (E), NKCC2 (F), NCC (G), and NKA β1-subunit (H) in rats on 0.4% NaCl (n = 4–5) or overnight 4% NaCl (n = 4–5). Typical immunoblots of a constant sample volume from each gradient fraction are shown for each protein. Immunoreactivity is expressed as % of the total signal in all 12 fractions. Values are means ± SD. *P < 0.05 vs. NS, assessed by ANOVA followed by unpaired Student's t-test.
DISCUSSION
This study aimed to determine the molecular mechanisms responsible for the natriuresis observed after consumption of a HS diet and the time course of the response. Regulation of extracellular Na+ balance, critical for extracellular volume and blood pressure regulation, is accomplished mainly by regulation of renal tubule Na+ reabsorption. The results demonstrate that 3-wk HS provoked a retraction of PT NHE3 and the molecular motor myosin VI from the top to the base of the MV, along with an increase in NHE3 phosphorylation at serine 552. In addition, HS led to shift of a variable fraction of cortical DPPIV, NaPi-2, NKCC2, NCC, ENaC-β, NKA α1- and β1-subunits, AT2R, and APN from low-density membrane fractions to higher-density membrane fractions. The responses to HS were complete after 18-h HS. These results indicate that HS depresses Na+ transport all along the nephron by changing the abundance as well as the distribution of the Na+ transporters and their regulators. The redistribution responses were quite variable, however. The differences between HS and NS at each fraction are plotted in Fig. 15 to illustrate this variability. In the PT, 17% of NHE3 shift from fraction 5 to fractions 6 and 7 and 13% of NaPi-2 shift from fractions 4 and 5 to fraction 6. Further along the nephron the changes are smaller: 5% of NKCC2 shift from fraction 6 to fraction 10, 6% of NCC shift from fractions 3 and 4 to fractions 9 and 10, 4% of ENaC-β shift from fractions 4 and 5 to fractions 10 and 11, 3% of NKA α1-subunits shift from fraction 3 to fraction 7, and 6% of NKA β1-subunits shift from fractions 2 and 3 to fractions 7–9. Although the shifts in density distribution are smaller in distal tubules, we believe that these changes in density gradient distribution may be physiologically relevant. First, the small shifts may reflect a smaller difference in membrane populations in the cell. We have shown directly by immunoelectron microscopy analysis (37) that the small shift in NCC was correlated with a statistically significant redistribution of NCC to subapical vesicles during HS. Immunohistochemistry analysis of other transporters including NKCC2 and ENaC-β would be helpful to reveal whether there are analogous changes in their distribution during HS diet.
Fig. 15.
Summary of difference in the density distribution of renal cortical NHE3, NaPi-2, NKCC2, NCC, ENaC-β, and NKA α1- and β1-subunits between NS and 3-wk HS. Values are means of 5 animals/group. *P < 0.05 vs. NS, assessed by paired Student's t-test.
Na+/H+ exchange is the major route for apical Na+ entry across the PT, and the NHE3 isoform is responsible for virtually all the Na+/H+ exchange activity in this region (2, 3). The importance of NHE3 in PT reabsorption of Na+, fluid, and HCO3− has been demonstrated in studies using NHE3-knockout mice or NHE3 inhibitors (26, 43). Whether NHE3 is also regulated by dietary NaCl has been controversial. NHE3 mRNA and abundance were found to increase during volume contraction induced by salt restriction in one study (11), while other studies reported no change in NHE3 abundance during salt restriction or salt loading (8, 28, 41). Studies measuring NHE3 activity in brush-border membrane (BBM) vesicle have also been inconclusive, with some showing a decrease in NHE3 activity with a HS diet (31) while others report no change in NHE3 activity with changes in dietary NaCl (8, 17). There are at least two potential reasons why changes in NHE3 activity were not evident after HS. First, these studies were conducted in isolated BBM vesicles and NHE3 moves to the base of the brush border, i.e., is not internalized, so there may not be a change in the pool size of NHE3 if the entire BBM is studied. Second, it is possible that non-membrane-bound regulatory factors present in vivo are lost during BBM isolation. We also saw no change in abundance of NHE3 in response to HS diet but observed a redistribution of NHE3 from the top to the base of the MV. We did not measure PT Na+ reabsorption in this study, but in studies in which we observed analogous redistribution (in response to acute hypertension or ACEI treatment) there was significant decrease in PT reabsorption and increased volume flow out of the PT (24, 45). Recently, Thomson et al. (42) reported that feeding rats with 1% NaCl in their drinking water for 1 wk increased late proximal flow rate from ∼14 nl/min to 18 nl/min. They also found that the salt-loaded group had elevated intratubular ANG II levels, which may have had a protective effect to prevent a major rise in late proximal flow rate in response to HS.
Using a phospho-specific anti-NHE3 antibody directed against phosphor-serine 552, we found that HS increased the fraction of NHE3-PS552 in the middensity fractions of the gradient corresponding to the base of the MV domain. This finding is consistent with the work by Kocinsky et al. (20), who demonstrated that NHE3-PS552 localized to the intermicrovillar coated pits region of the brush border, while total NHE3 was found throughout the BBM. They suggested that NHE3-PS552 plays a role in the redistribution to the base of the MV. Interestingly, phosphorylation of NHE3 at serine 552 by PTH does not directly affect NHE3 activity, even though there is a temporal relationship between phosphorylation and transport inhibition (19). These authors concluded that PTH-mediated inhibition of NHE3 may depend on factors that may not be present or functional in the MV vesicles used to assay NHE3 activity.
Transporters exist as multiprotein complexes, and these complexes are important in regulating the activity and/or trafficking of these proteins. The present study revealed that the abundant PT brush-border protein DPPIV is also retracted from the body of the MV during HS diet. Girardi and colleagues (14) reported that DPPIV associates with NHE3 in the MV, DPPIV activity increases NHE3 activity, and DPPIV inhibition in vivo decreases the abundance of NHE3 in the apical MV. The inhibitor of DPPIV also provoked a partial movement of DPPIV protein away from the apical MV. In our study, the redistribution of DPPIV to the base of the MV could not be confirmed by confocal microscopy, which suggests that only a subset of DPPIV redistributes along with NHE3 to the intermicrovillar region. Taken together, these studies are consistent with the hypothesis that during HS NHE3 is retracted from the apical MV to the base of the MV, where transporters are phosphorylated and form complexes with regulatory proteins that reversibly inactivate transporters and decrease PT Na+ reabsorption. An alternative hypothesis is that the “effective” Na+ reabsorption area on the apical surface is reduced when most NHE3 moves to the bottom of the MV.
It is well established that brush-border MV are filled with bundled actin filaments, and evidence suggests that NHE3 can be tethered to the actin via the PDZ domain protein NHERF-1 and ezrin (50). We recently suggested that myosin VI, an unconventional myosin that moves toward the ends of actin pointed toward the center of the cell, could play an active role in moving NHE3 from the body to the base of the MV in the plane of the villar apical membrane. Our quantitative immunoelectron microscopy analysis determined that 50% of the myosin VI was localized to the MV, 30% to the intermicrovillar zone, and 20% to the apical cytoplasmic zone and that there was a significant shift in myosin VI distribution to the base of the MV during acute hypertension (48). In this study HS diet provoked a chronic redistribution of myosin VI from top of the MV to the base, evident by confocal microscopy as well as density distribution, again supporting the hypothesis that this motor protein is important for the redistribution of NHE3.
HS diet also provoked a redistribution of NaPi-2 to higher-density membranes. This redistribution was not evident by confocal microscopy, which indicates that there was only a partial redistribution of NaPi-2 out of the MV in response to HS. In comparison, acute hypertension, PTH, or chronic ACEI treatment provoked internalization of NaPi-2 to endosomes and then lysosomes (46, 47). The results suggest that the signaling machinery activated by HS is distinct from that activated by hypertension, PTH, or ACE inhibition.
Also relevant to the adaptation to HS diet, cortical AT2R and APN both redistributed from low-density to higher-density membranes, and an increase in AT2R total abundance was observed. Intrarenal AT2R is enriched in proximal and distal tubules, where it is reported to antagonize the AT1R-mediated pressor effect of ANG II (5). Hakam and Hussain (16) reported that AT2R is localized in both apical and basolateral membranes and that AT2R is upregulated in obese Zucker rats compared with lean rats and mediates candesartan (an AT1R antagonist)-induced natriuresis. Our immunohistochemistry data revealed that apical AT2R retracted from the body to the base of the MV in response to HS diet. Interestingly, Ishizaka et al. (18) reported that in response to ANG II stimulation AT1R moves to caveolin 1-enriched membrane domain in vascular smooth muscle cells, a response blocked by the AT1R antagonist losartan, suggesting that caveola-AT1R interaction may be important for AT1R signaling. It would be interesting to test whether caveolin is located at the base of the MV in PT and whether caveola-AT2R interaction is important for activation of AT2R. The increase in total abundance of AT2R as well as its retraction to the base of the MV could potentially contribute to natriuresis in response to HS. Padia et al. (34) reported that AT2R mediates natriuresis via ANG III, not ANG II, in AT1R-blocked rats. ANG III is degraded to ANG IV by APN. Intrarenal inhibition of APN augments natriuretic responses to ANG III in AT1R-blocked rats (35). APN is highly expressed in the brush border of PT cells (22). Our results of a shift of APN to higher-density membranes suggest that the abundance of APN in the apical plasma membrane is reduced by HS and suggests that less APN activity could lead to more natriuretic peptide ANG III accumulation, which could activate AT2R and contribute to HS natriuresis. In contrast, Farjah et al. (10) found that 8% NaCl diet increased APN activity and protein in Sprague-Dawley rats, while we saw no change in APN abundance. Perhaps the difference is due to the 4% salt in our HS diet versus 8% salt in theirs.
This study also provided evidence for redistribution of the Na+ transporters beyond the proximal tubule, i.e., from lower- to higher-density membranes on density gradients, including NKCC2, NCC (previously reported), and ENaC-β. The distal nephron is sensitive to aldosterone, which increases cortical NCC and NKA abundance and induces redistribution of ENaC to apical surface from the intracellular stores in renal connecting tubule and CCD (32). We determined that 4% HS diet reduced aldosterone to an undetectable level (37). A lack of aldosterone during HS diet likely contributes to the Na+ transporter responses found in this study. Several studies have detected changes in abundance of distal nephron Na+ transporters in response to a HS diet, related to our findings: 4-wk 2.59% salt diet decreased NCC and ENaC-α abundance and increased ENaC β- and γ-subunits (41), while in a salt repletion study (saline as drinking water for 5 h after salt restriction) all ENaC subunits decreased in abundance (9). Since the precise protocols differ between these and the present study in terms of timing, percent salt, and preparation studied, it is difficult to predict why the outcomes are not consistent in HS feeding.
Previous studies of the effect of salt intake on NKCC2 abundance have not been consistent: chronic oral saline loading increased NKCC2 abundance (7), while 4-wk 2.59% HS diet did not change abundance (41). In agreement with the latter study, we did not see an effect of 3-wk 4% HS diet on NKCC2 abundance. Regarding trafficking of NKCC2 in the cell, Ortiz (33), using rat TAL, showed that cAMP acutely increases the surface expression of NKCC2, and Gimenez and Forbush (13) provided evidence in rodents that phosphorylation of NKCC2 by vasopressin increases NKCC2 distribution in the apical membrane. In this study, HS led to removal of total NKCC2 from low-density apical enriched membrane fractions to higher-density fraction 10 (Fig. 10). The exact destination of the NKCC2 redistribution remains to be determined by immunomicroscopy, but fraction 10 is enriched in endosomal markers, as discussed above. Phosphorylated NKCC2 abundance and distribution did not change significantly during HS, even though it appears that there is an increase in phosphorylated NKCC2 at higher densities during HS.
Loffing et al. (25) found that a 3% salt diet caused a redistribution of ENaC-β and ENaC-γ from apical to intracellular pools, which also reduced ENaC-α apical insertion, thus reducing Na+ reabsorption via ENaC. Our density gradient results are consistent with movement of ENaC-β out of apical membranes to intracellular membranes during HS, although we do not have direct microscopic evidence for internalization of ENaC-β.
The inhibitory effect of HS on NKA has been studied for decades (1). Periyasamy et al. (36) recently showed that 4% NaCl diet for 1 wk induced a redistribution of NKA from plasma membrane-enriched fractions to endosome-enriched fractions as well as a decrease in PT reabsorption. We also observed a significant, albeit subtle, redistribution of NKA α- and β-subunits from plasma membrane-enriched low-density fractions to higher-density membranes, suggesting that redistribution of NKA may play a role in the natriuretic response to HS diet. It has proven difficult to actually verify NKA redistribution in the epithelia of the nephron because of the many deep basolateral infoldings.
In conclusion, this study provides evidence that HS diet provokes a retraction of NHE3 from the top to the base of the MV in the PT, and that phosphorylation of NHE3, by an unidentified kinase, is involved in its redistribution to the base of the MV. The coordinated retraction of actin-based motor myosin VI from the top to the base of the MV suggests a functional role for this motor in redistributing the NHE3. On a more general level, the results indicate that HS diet reduces Na+ reabsorption by decreasing the abundance of plasma membrane Na+ transporters and their associated regulators along the nephron, primarily by redistribution rather than change in total pool size (only NCC abundance is decreased). These responses were fully active after only overnight HS.
GRANTS
This work was supported by National Institutes of Health Grants DK-34316 and HL-085388 (A. A. McDonough). Confocal microscopy was supported by Core Center Grant DK-48522. K. Pihakaski-Maunsbach was supported by the Danish National Research Foundation (Grundforskningsfonden).
Acknowledgments
We thank Donald Marsh and Robert Farley for a critical review of the results and manuscript.
The costs of publication of this article were defrayed in part by the payment of page charges. The article must therefore be hereby marked “advertisement” in accordance with 18 U.S.C. Section 1734 solely to indicate this fact.
REFERENCES
- 1.Aperia AC Intrarenal dopamine: a key signal in the interactive regulation of sodium metabolism. Annu Rev Physiol 62: 621–647, 2000. [DOI] [PubMed] [Google Scholar]
- 2.Azuma KK, Balkovetz DF, Magyar CE, Lescale-Matys L, Zhang Y, Chambrey R, Warnock DG, McDonough AA. Renal Na+/H+ exchanger isoforms and their regulation by thyroid hormone. Am J Physiol Cell Physiol 270: C585–C592, 1996. [DOI] [PubMed] [Google Scholar]
- 3.Biemesderfer D, Pizzonia J, Abu-Alfa A, Exner M, Reilly R, Igarashi P, Aronson PS. NHE3: a Na+/H+ exchanger isoform of renal brush border. Am J Physiol Renal Fluid Electrolyte Physiol 265: F736–F742, 1993. [DOI] [PubMed] [Google Scholar]
- 4.Brown D, Lydon J, McLaughlin M, Stuart-Tilley A, Tyszkowski R, Alper S. Antigen retrieval in cryostat tissue sections and cultured cells by treatment with sodium dodecyl sulfate (SDS). Histochem Cell Biol 105: 261–267, 1996. [DOI] [PubMed] [Google Scholar]
- 5.Carey RM Cardiovascular and renal regulation by the angiotensin type 2 receptor: the AT2 receptor comes of age. Hypertension 45: 840–844, 2005. [DOI] [PubMed] [Google Scholar]
- 6.Cowley AW Genetic and nongenetic determinants of salt sensitivity and blood pressure. Am J Clin Nutr 65: 587S–593S, 1997. [DOI] [PubMed] [Google Scholar]
- 7.Ecelbarger CA, Terris J, Hoyer JR, Nielsen S, Wade JB, Knepper MA. Localization and regulation of the rat renal Na+-K+-2Cl− cotransporter, BSC-1. Am J Physiol Renal Fluid Electrolyte Physiol 271: F619–F628, 1996. [DOI] [PubMed] [Google Scholar]
- 8.Eladari D, Leviel F, Pezy F, Paillard M, Chambrey R. Rat proximal NHE3 adapts to chronic acid-base disorders but not to chronic changes in dietary NaCl intake. Am J Physiol Renal Physiol 282: F835–F843, 2002. [DOI] [PubMed] [Google Scholar]
- 9.Ergonul Z, Frindt G, Palmer LG. Regulation of maturation and processing of ENaC subunits in the rat kidney. Am J Physiol Renal Physiol 291: F683–F693, 2006. [DOI] [PubMed] [Google Scholar]
- 10.Farjah M, Washington TL, Roxas BP, Geenen DL, Danziger RS. Dietary NaCl regulates renal aminopeptidase N: relevance to hypertension in the Dahl rat. Hypertension 43: 282–285, 2004. [DOI] [PubMed] [Google Scholar]
- 11.Fisher KA, Lee SH, Walker J, Dileto-Fang C, Ginsberg L, Stapleton SR. Regulation of proximal tubule sodium/hydrogen antiporter with chronic volume contraction. Am J Physiol Renal Physiol 280: F922–F926, 2001. [DOI] [PubMed] [Google Scholar]
- 12.Flemmer AW, Gimenez I, Dowd BF, Darman RB, Forbush B. Activation of the Na-K-Cl cotransporter NKCC1 detected with a phospho-specific antibody. J Biol Chem 277: 37551–37558, 2002. [DOI] [PubMed] [Google Scholar]
- 13.Gimenez I, Forbush B. Short-term stimulation of the renal Na-K-Cl cotransporter (NKCC2) by vasopressin involves phosphorylation and membrane translocation of the protein. J Biol Chem 278: 26946–26951, 2003. [DOI] [PubMed] [Google Scholar]
- 14.Girardi AC, Fukuda LE, Rossoni LV, Malnic G, Reboucas NA. Dipeptidyl peptidase IV inhibition downregulates Na+-H+ exchanger NHE3 in rat renal proximal tubule. Am J Physiol Renal Physiol 294: F414–F422, 2008. [DOI] [PubMed] [Google Scholar]
- 15.Hager H, Kwon TH, Vinnikova AK, Masilamani S, Brooks HL, Frokiaer J, Knepper MA, Nielsen S. Immunocytochemical and immunoelectron microscopic localization of alpha-, beta-, and gamma-ENaC in rat kidney. Am J Physiol Renal Physiol 280: F1093–F1106, 2001. [DOI] [PubMed] [Google Scholar]
- 16.Hakam AC, Hussain T. Renal angiotensin II type-2 receptors are upregulated and mediate the candesartan-induced natriuresis/diuresis in obese Zucker rats. Hypertension 45: 270–275, 2005. [DOI] [PubMed] [Google Scholar]
- 17.Holtback U, Aperia A, Celsi G. High salt alone does not influence the kinetics of the Na+-H+ antiporter. Acta Physiol Scand 148: 55–61, 1993. [DOI] [PubMed] [Google Scholar]
- 18.Ishizaka N, Griendling KK, Lassegue B, Alexander RW. Angiotensin II type 1 receptor: relationship with caveolae and caveolin after initial agonist stimulation. Hypertension 32: 459–466, 1998. [DOI] [PubMed] [Google Scholar]
- 19.Kocinsky HS, Dynia DW, Wang T, Aronson PS. NHE3 phosphorylation at serines 552 and 605 does not directly affect NHE3 activity. Am J Physiol Renal Physiol 293: F212–F218, 2007. [DOI] [PubMed] [Google Scholar]
- 20.Kocinsky HS, Girardi AC, Biemesderfer D, Nguyen T, Mentone S, Orlowski J, Aronson PS. Use of phospho-specific antibodies to determine the phosphorylation of endogenous Na+/H+ exchanger NHE3 at PKA consensus sites. Am J Physiol Renal Physiol 289: F249–F258, 2005. [DOI] [PubMed] [Google Scholar]
- 21.Kotlo K, Hughes DE, Herrera VL, Ruiz-Opazo N, Costa RH, Robey RB, Danziger RS. Functional polymorphism of the Anpep gene increases promoter activity in the Dahl salt-resistant rat. Hypertension 49: 467–472, 2007. [DOI] [PubMed] [Google Scholar]
- 22.Kotlo K, Shukla S, Tawar U, Skidgel RA, Danziger RS. Aminopeptidase N reduces basolateral Na+-K+-ATPase in proximal tubule cells. Am J Physiol Renal Physiol 293: F1047–F1053, 2007. [DOI] [PubMed] [Google Scholar]
- 23.Laemmli UK Cleavage of structural proteins during the assembly of the head of bacteriophage T4. Nature 227: 680–685, 1970. [DOI] [PubMed] [Google Scholar]
- 24.Leong PK, Devillez A, Sandberg MB, Yang LE, Yip DK, Klein JB, McDonough AA. Effects of ACE inhibition on proximal tubule sodium transport. Am J Physiol Renal Physiol 290: F854–F863, 2006. [DOI] [PubMed] [Google Scholar]
- 25.Loffing J, Pietri L, Aregger F, Bloch-Faure M, Ziegler U, Meneton P, Rossier BC, Kaissling B. Differential subcellular localization of ENaC subunits in mouse kidney in response to high- and low-Na diets. Am J Physiol Renal Physiol 279: F252–F258, 2000. [DOI] [PubMed] [Google Scholar]
- 26.Lorenz JN, Schultheis PJ, Traynor T, Shull GE, Schnermann J. Micropuncture analysis of single-nephron function in NHE3-deficient mice. Am J Physiol Renal Physiol 277: F447–F453, 1999. [DOI] [PubMed] [Google Scholar]
- 27.Magyar CE, Zhang Y, Holstein-Rathlou NH, McDonough AA. Proximal tubule Na transporter responses are the same during acute and chronic hypertension. Am J Physiol Renal Physiol 279: F358–F369, 2000. [DOI] [PubMed] [Google Scholar]
- 28.Masilamani S, Wang X, Kim GH, Brooks H, Nielsen J, Nielsen S, Nakamura K, Stokes JB, Knepper MA. Time course of renal Na-K-ATPase, NHE3, NKCC2, NCC, and ENaC abundance changes with dietary NaCl restriction. Am J Physiol Renal Physiol 283: F648–F657, 2002. [DOI] [PubMed] [Google Scholar]
- 29.McDonough AA, Magyar CE, Komatsu Y. Expression of Na+-K+-ATPase alpha- and beta-subunits along rat nephron: isoform specificity and response to hypokalemia. Am J Physiol Cell Physiol 267: C901–C908, 1994. [DOI] [PubMed] [Google Scholar]
- 30.Miyata N, Park F, Li XF, Cowley AW Jr. Distribution of angiotensin AT1 and AT2 receptor subtypes in the rat kidney. Am J Physiol Renal Physiol 277: F437–F446, 1999. [DOI] [PubMed] [Google Scholar]
- 31.Moe OW, Tejedor A, Levi M, Seldin DW, Preisig PA, Alpern RJ. Dietary NaCl modulates Na+-H+ antiporter activity in renal cortical apical membrane vesicles. Am J Physiol Renal Fluid Electrolyte Physiol 260: F130–F137, 1991. [DOI] [PubMed] [Google Scholar]
- 32.Nielsen J, Kwon TH, Frokiaer J, Knepper MA, Nielsen S. Maintained ENaC trafficking in aldosterone-infused rats during mineralocorticoid and glucocorticoid receptor blockade. Am J Physiol Renal Physiol 292: F382–F394, 2007. [DOI] [PubMed] [Google Scholar]
- 33.Ortiz PA cAMP increases surface expression of NKCC2 in rat thick ascending limbs: role of VAMP. Am J Physiol Renal Physiol 290: F608–F616, 2006. [DOI] [PubMed] [Google Scholar]
- 34.Padia SH, Howell NL, Siragy HM, Carey RM. Renal angiotensin type 2 receptors mediate natriuresis via angiotensin III in the angiotensin II type 1 receptor-blocked rat. Hypertension 47: 537–544, 2006. [DOI] [PubMed] [Google Scholar]
- 35.Padia SH, Kemp BA, Howell NL, Siragy HM, Fournie-Zaluski MC, Roques BP, Carey RM. Intrarenal aminopeptidase N inhibition augments natriuretic responses to angiotensin III in angiotensin type 1 receptor-blocked rats. Hypertension 49: 625–630, 2007. [DOI] [PubMed] [Google Scholar]
- 36.Periyasamy SM, Liu J, Tanta F, Kabak B, Wakefield B, Malhotra D, Kennedy DJ, Nadoor A, Fedorova OV, Gunning W, Xie Z, Bagrov AY, Shapiro JI. Salt loading induces redistribution of the plasmalemmal Na/K-ATPase in proximal tubule cells. Kidney Int 67: 1868–1877, 2005. [DOI] [PubMed] [Google Scholar]
- 37.Sandberg MB, Maunsbach AB, McDonough AA. Redistribution of distal tubule Na+-Cl− cotransporter (NCC) in response to a high-salt diet. Am J Physiol Renal Physiol 291: F503–F508, 2006. [DOI] [PubMed] [Google Scholar]
- 38.Sandberg MB, Riquier AD, Pihakaski-Maunsbach K, McDonough AA, Maunsbach AB. ANG II provokes acute trafficking of distal tubule Na+-Cl− cotransporter to apical membrane. Am J Physiol Renal Physiol 293: F662–F669, 2007. [DOI] [PubMed] [Google Scholar]
- 39.Simon DB, Karet FE, Hamdan JM, DiPietro A, Sanjad SA, Lifton RP. Bartter's syndrome, hypokalaemic alkalosis with hypercalciuria, is caused by mutations in the Na-K-2Cl cotransporter NKCC2. Nat Genet 13: 183–188, 1996. [DOI] [PubMed] [Google Scholar]
- 40.Skott O Body sodium and volume homeostasis. Am J Physiol Regul Integr Comp Physiol 285: R14–R18, 2003. [DOI] [PubMed] [Google Scholar]
- 41.Song J, Hu X, Shi M, Knepper MA, Ecelbarger CA. Effects of dietary fat, NaCl, and fructose on renal sodium and water transporter abundances and systemic blood pressure. Am J Physiol Renal Physiol 287: F1204–F1212, 2004. [DOI] [PubMed] [Google Scholar]
- 42.Thomson SC, Deng A, Wead L, Richter K, Blantz RC, Vallon V. An unexpected role for angiotensin II in the link between dietary salt and proximal reabsorption. J Clin Invest 116: 1110–1116, 2006. [DOI] [PMC free article] [PubMed] [Google Scholar]
- 43.Vallon V, Schwark JR, Richter K, Hropot M. Role of Na+/H+ exchanger NHE3 in nephron function: micropuncture studies with S3226, an inhibitor of NHE3. Am J Physiol Renal Physiol 278: F375–F379, 2000. [DOI] [PubMed] [Google Scholar]
- 44.Weinman EJ, Biswas RS, Peng Q, Shen L, Turner CL, EX, Steplock D, Shenolikar S, Cunningham R. Parathyroid hormone inhibits renal phosphate transport by phosphorylation of serine 77 of sodium-hydrogen exchanger regulatory factor-1. J Clin Invest 117: 3412–3420, 2007. [DOI] [PMC free article] [PubMed] [Google Scholar] [Retracted]
- 45.Yang L, Leong PK, Chen JO, Patel N, Hamm-Alvarez SF, McDonough AA. Acute hypertension provokes internalization of proximal tubule NHE3 without inhibition of transport activity. Am J Physiol Renal Physiol 282: F730–F740, 2002. [DOI] [PubMed] [Google Scholar]
- 46.Yang LE, Leong PK, McDonough AA. Reducing blood pressure in SHR with enalapril provokes redistribution of NHE3, NaPi2, and NCC and decreases NaPi2 and ACE abundance. Am J Physiol Renal Physiol 293: F1197–F1208, 2007. [DOI] [PubMed] [Google Scholar]
- 47.Yang LE, Maunsbach AB, Leong PK, McDonough AA. Differential traffic of proximal tubule Na+ transporters during hypertension or PTH: NHE3 to base of microvilli vs. NaPi2 to endosomes. Am J Physiol Renal Physiol 287: F896–F906, 2004. [DOI] [PubMed] [Google Scholar]
- 48.Yang LE, Maunsbach AB, Leong PK, McDonough AA. Redistribution of myosin VI from top to base of proximal tubule microvilli during acute hypertension. J Am Soc Nephrol 16: 2890–2896, 2005. [DOI] [PubMed] [Google Scholar]
- 49.Yang SS, Morimoto T, Rai T, Chiga M, Sohara E, Ohno M, Uchida K, Lin SH, Moriguchi T, Shibuya H, Kondo Y, Sasaki S, Uchida S. Molecular pathogenesis of pseudohypoaldosteronism type II: generation and analysis of a Wnk4(D561A/+) knockin mouse model. Cell Metab 5: 331–344, 2007. [DOI] [PubMed] [Google Scholar]
- 50.Yun CH, Lamprecht G, Forster DV, Sidor A. NHE3 kinase A regulatory protein E3KARP binds the epithelial brush border Na+/H+ exchanger NHE3 and the cytoskeletal protein ezrin. J Biol Chem 273: 25856–25863, 1998. [DOI] [PubMed] [Google Scholar]


