Abstract
Weak polyelectrolytes tethered to cylindrical surfaces are investigated using a molecular theory. These polymers form a model system to describe the properties of aggrecan molecules, which is one of the main components of cartilage. We have studied the structural and thermodynamical properties of two interacting aggrecans with a molecular density functional theory that incorporates the acid-base equilibrium as well as the molecular properties: including conformations, size, shape, and charge distribution of all molecular species. The effect of acidity and salt concentration on the behavior is explored in detail. The repulsive interactions between two cylindrical-shaped aggrecans are strongly influenced by both the salt concentration and the pH. With increasing acidity, the polyelectrolytes of the aggrecan acquire charge and with decreasing salt concentration those charges become less screened. Consequently the interactions increase in size and range with increasing acidity and decreasing salt concentration. The size and range of the forces offers a possible explanation to the aggregation behavior of aggrecans and for their ability to resist compressive forces in cartilage. Likewise, the interdigitation of two aggrecan molecules is strongly affected by the salt concentration as well as the pH. With increasing pH, the number of charges increases, causing the repulsions between the polymers to increase, leading to a lower interdigitation of the two cylindrical polymer layers of the aggrecan molecules. The low interdigitation in charged polyelectrolytes layers provides an explanation for the good lubrication properties of polyelectrolyte layers in general and cartilage in particular.
INTRODUCTION
Weak polyelectrolytes tethered to cylindrical surfaces of nanometer-size diameters are found in a variety of biological and synthetic systems. A cylindrical surface can be another polymer chain, a carbon nanotubes, or a protein molecule. The latter example is of particular biological interest, because polysaccharides tethered to a protein chain provide a model system to describe the properties of aggrecan, which is one of the most abundant components of cartilage (1–3). The main function of aggrecan in cartilage is to resist compressive forces (2,4). The loss of aggrecan macromolecules in cartilage is an important feature of joint diseases, such as rheumatoid arthritis and osteoarthritis (5,6). Further, aggrecan molecules in the extracellular matrix of articular cartilage contribute to the lubrication properties of cartilage (7,8).
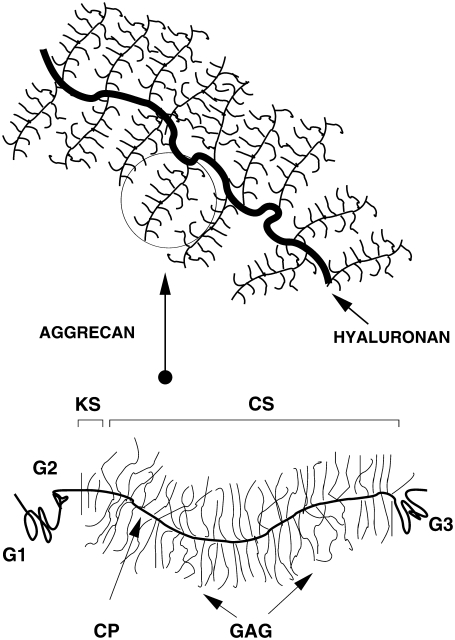
An aggrecan molecule contains ∼100 chondroitin sulfate-glycosaminoglycans (CS-GAGs) chains covalently bound to a 300 kDa linear protein chain that has a contour length of ∼400 nm (9). Aggrecan consists primarily of these CS-GAGs, each having 20–60 disaccharides, but it also contains a smaller number of keratan sulfate glycosaminoglycans and other oligosaccharides (see Fig. 1). The number of GAG side chains per unit length or grafting density as well as the length of the side chains vary with type, age, disease, depth in cartilage, and anatomical site of cartilage (5,6,10–13). However, typical values are between 0.25 and 0.5 nm−1 (9). Each repeat unit of the chondroitin side chains possesses one sulfonic and one carboxylic group. Therefore the GAG side chain is a weak polyelectrolyte molecule, because depending on pH and salt concentration of the environment these acid groups can regulate their charge state. Under physiological conditions, the GAG chains are mostly charged. These negative charges of the disaccharides of the aggrecan molecules create the osmotic environment, through their counterions, that is responsible for the extremely high osmotic swelling pressure of cartilage (7). Thus, aggrecans provide cartilage with its osmotic properties, which gives cartilage its ability to resist compressive loads and determines its mechanical properties (4).
FIGURE 1.
Schematic drawing representing the aggrecan molecule and the proteoglycan aggregate of aggrecans and hyaluronan. The labels denote the GAG side chains and core protein (CP: core protein, CS: chondroitin sulfate, and KS: keratan sulfate). The G1, G2, and G3 are globular domains. The G1 is involved in the binding of aggrecan to hyaluronan. Drawing adapted from Ng et al. (9).
Atomic force microscopy (AFM) and electron-microscopy experiments (9,14–16) have revealed that aggrecan is a (stiff) cylindrical-shaped molecule. The cylindrical morphology of aggrecan is reminiscent of a polymer “bottle brush” molecule (17–19). In the extracellular matrix, aggrecan molecules self-assemble into large supramolecular complexes. These proteoglycan aggregates are composed of ∼100 aggrecans which are noncovalently linked to a high molecular weight hyaluronan polymer (12,20–23). The shape of the aggregate also resembles a polymer bottle brush, albeit a very large one, with a mass up to 4 MDa. The size of aggregate combined with the collagen network allows the aggrecan to be retained in cartilage. A schematic drawing of the aggregate is presented in Fig. 1.
Given the cylindrical shape of aggrecan, the molecule can be described as a cylindrical tethered polymer layer. Hence, the investigation of aggrecans has similarities to the study of colloidal brushes. For example, the theoretical approach we employ is an extension of a molecular theory recently applied to study the dispersion of polymer-coated carbon nanotubes—an example of cylindrical neutral polymer layers (24). The main focus of this study is the behavior of aggrecan. However, the study of aggrecan may also be relevant to understand the behavior of carbon nanotubes tethered with polyelectrolytes.
Other examples of relevant related tethered polymer objects are colloids or metal particles grafted with polymers, polymer bottle brushes, and “hairy” cylinders or nanorods (25–29). The latter are diblock copolymers which form hexagonally packed cylinders in the melt state. When dispersed in water, they form hairy cylindrical structures (30,31). Recently, synthetic cylindrical polyelectrolyte brushes have been prepared to mimic the properties of aggrecan macromolecules (32). The polymer analog was also recently used by Zhulina and Leermakers (33,34) to theoretically study the equilibrium structure of individual neurofilaments, which have a structure similar to that of aggrecan or polymer bottle brushes. They employed the numerical self-consistent field theory of Scheutjens and Fleer (35), which was originally developed to study polymers near interfaces.
There are only a few theoretical investigations devoted to understanding the interactions of GAG chains and aggrecan at the molecular level. For example, computer simulations (36,37) of single and multiple CS-GAG chains have been performed to determine the osmotic pressure of CS-GAG solutions. Other theoretical investigations adopted a coarse-grained description of the aggrecan molecules. Continuum Poisson-Boltzmann cell models have been applied to describe the properties of CS-GAG chains and aggrecan molecules (15,38–42). Likewise, the elasticity of cartilage has been calculated based on a Flory-type description of the CS-GAG chains (43). In these studies, the molecular details of the aggrecan are largely ignored or drastically simplified. For example, the polymer nature of the polysaccharide was ignored, and the charge distribution was held fixed. A more refined description of the interactions between these cylindrical-shaped molecules needs to take into account the conformations and charge distribution of the polymer chains of which the aggrecan molecule is made up. This study is devoted to understanding the interactions of aggrecans based on a molecular description of the molecules and how the repulsive interaction among the aggrecans still allow the self-assemble of aggrecans in proteoglycan aggregates.
The theoretical approach we apply is a molecular theory developed for tethered polymers and recently extended to study the dispersion of polymer-coated carbon nanotubes (24,44) and the behavior of weak polyelectrolytes tethered to planar surfaces (45–49). The theory has been shown to provide very good agreement with experimental observations (46,50,51). Most relevant for our investigation here, the theoretical predictions of the layer thickness of a polyacrylic acid layer were in quantitative agreement with experiments (46,52,53). This ability of the theory to properly predict experimental quantities in polymeric systems that can change their properties depending on the bulk pH and solution ionic strength gives us confidence that the essential features for the system investigated in this work are properly accounted for.
In previous work, we described the differences in the molecular packing of tethered polyelectrolytes as a function of surface geometry (48). In this work, the theoretical framework developed in Nap et al. (48) will be extended and applied to the specific case of model aggrecans and their interactions. Namely, under a variety of different conditions, we study the interactions between two nanometer-sized cylindrical surfaces tethered with weak polyelectrolytes, i.e., model polysaccharides.
The work is organized as follows. First, we introduce the parameters describing the system and follow with a presentation of the theory, emphasizing points that are relevant for our application here. This is followed by a section containing representative calculations of the structure and interactions between tethered cylindrical polymer layers and the role of pH, salt concentration of the solution, grafting density, and polymer length. We end with concluding remarks in which we relate our findings to the behavior of aggrecan.
THEORETICAL APPROACH
We employ a molecular theory that explicitly includes the molecular details of every species in the system, i.e., the conformations, size, shape, and charge distribution of every molecular type is explicitly accounted for.
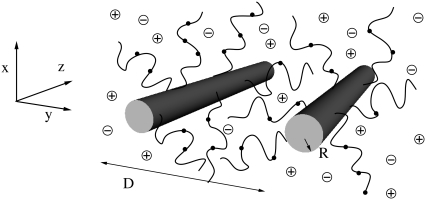
We consider the interactions between two aggrecan macromolecules. The aggrecans are modeled as polymers end-tethered to rigid cylinders. We refer to this cylindrical-shaped layer of polymers as an “aggrecan-like” molecule or simple “aggrecan”. The cylindrical surface of these aggrecan-like molecules has a radius R = 0.5 nm and a length L. They are positioned with their long axes parallel to each other and separated by a distance D, as schematically illustrated in Fig. 2. The distance D is measured from the centers of the cylinders. For a sufficiently long cylinder,  we can ignore end effects. The aggrecans have each Np end-tethered polymer molecules, and each polymer chain has np segments. The number of polymer chains per unit length or line density is denoted by σl and equals Np/L. The aggrecan molecules are immersed in an aqueous solution containing monovalent salt, e.g., NaCl, that is assumed to be completely dissociated. The solution also contains protons (H+) and hydroxyl ions (OH −) arising from the acid-base equilibrium of the chargeable groups on the polymer chains, the water, and the added acid (or base). To simplify the presentation of the theory, we consider only one type of chargeable group
 |
(1) |
FIGURE 2.
Cartoon illustrating the theoretical model employed. D is the distance from the centers of the cylinders. The dots on the polymer chains represent dissociated groups. The radius is not to scale.
However the extension of the theory to include multiple acidic species is straightforward. In the above reaction, AH corresponds to one acidic group on the polymer. Finally, we limit ourselves to good solvent conditions. The bulk solution is characterized by a salt concentration, c, and a fixed pH. Using the above assumptions yields the following free energy (24,44,46,48,49):
 |
(2) |
The first two terms describe the conformational entropy of the tethered polysaccharides. The indexes L and R label the two aggrecan molecules. P(αi) is the probability of finding a polymer chain in a conformation αi. Given this probability distribution function, any thermodynamic or average structural quantity related to the polymer layers can be computed. The following three terms in the free energy correspond to the position-dependent mixing (translational) entropy of the water (solvent), coions, and counterions, respectively. The next two terms describe the mixing entropy and the standard free energy,  of the protons and hydroxyl ions. ρi (x, y) denotes the density of molecules of species i = w, Na+, Cl−, H+, OH−, and vw is the volume of a water molecule. The eighth term in Eq. 2 is related to the acid-base equilibrium. It describes the entropy of mixing associated with the charged and uncharged states of the saccharides in the polymer chains (54). The
  are the standard chemical potentials of the different molecules involved in the acid-base reaction. 〈ρp (x, y)〉 is the average polymer monomer density and is given by
 |
(3) |
where n(x, y; α) is the number of polymer segments of a given polymer conformation α found in area element [x, y] × [x + dx, y + dx]. In the free energy expression, f (x, y) represents the ratio between the number of charged saccharide units and the total number of polymer monomers at (x, y):  The last term in Eq. 2 accounts for the electrostatic contribution to the free energy, with ψ (x, y) denoting the electrostatic potential at (x, y), ɛ corresponds to the dielectric constant, and 〈ρq(x, y)〉 being the total charge density at (x, y) given by
 |
(4) |
where qi is the charge of molecule of type i, with  and
and  and qw = 0, where e is the elementary charge. The dielectric constant is taken to be that for water, ɛ /ɛ0 = 78.5, where ɛ0 is the dielectric constant of vacuum. Intermolecular excluded volume interactions are accounted for by assuming that the system is incompressible at every position. Namely, we have the following packing constrains for all (x, y),
 |
(5) |
where 〈φp(x, y)〉 = 〈ρp(x, y)〉vp is the polymer volume fraction, with vp being the volume of one polymer segment. The other φis correspond to the volume fractions of the nonpolymer constituents of the system: the solvent molecules, the cations, the anions, the protons, and the hydroxyl ions, respectively:
 |
(6) |
The π(x, y) corresponds to the Lagrange multipliers enforcing the packing constraints, and they are related to the osmotic pressure in (x, y). Namely, they represent the repulsive potential field due to the excluded volume interactions. Qi ensures that the probability distribution function is properly normalized. For the degree of dissociation we obtain
 |
(7) |
where  is a constant that is related to the equilibrium constant of the low molecular acid in bulk solution, which is given, and Ka = [A−][H+]/[AH]. Observe that this bulk equilibrium constant has units of molarity, whereas the
  is dimensionless. Expressing the equilibrium constant Ka in terms of the standard chemical potentials gives Ka = C exp(−βΔG0), where the C is another constant, introduced to maintain consistence of units, and equal to the molarity of the solvent (water) (48,49,55).
Variation of the free energy with respect to the electrostatic potential yields the Poisson equation
 |
(8) |
whose boundary conditions are
 |
(9) |
Here  is the unit vector normal to the cylinder. The second boundary condition is applicable only for a closed cylinder. For open cylinders, i.e., carbon nanotubes, the second boundary condition is not needed.
The expressions for the densities of cations and anions respectively are
 |
(10) |
 |
(11) |
and the volume fraction of the protons, hydroxyl ions, and solvent (which are all assumed to have the same volume vw) are given by
 |
(12) |
 |
(13) |
 |
(14) |
The unknowns in Eqs. 3, 6, and 10–14 are the Lagrange multipliers or pressure fields and the electrostatic potential. Application of the theory to systems of interest requires determining these unknowns. This is accomplished by substituting the volume fractions into the packing constraint and the Poisson equation (24,56). After discretizing space, Eqs. 5 and 8 yield a set of coupled nonlinear equations, which are solved numerically. The input necessary to solve those equations are the polymer line density σl, the bulk pH, the bulk salt concentration c, the equilibrium constant Ka, the distance D between the cylinders, and the set of polymer conformations. A three-state rotational isomeric state model is used to generate a representative set of 106 self-avoiding conformations by a simple sampling Monte Carlo algorithm. The segment length of the polymer-chains is l = 0.5 nm, and the volume of one polymer segment (saccharide unit) is taken to be vp = 0.11 nm3. The volume of the other molecules are  and
and  For a given chain length, the set of conformations is generated once, and the same set is used for all calculations. The set of nonlinear coupled equations is solved by standard numerical methods and, depending on the distance between the cylinders, involves between 1800 and 4900 coupled equations.
For more details on the theoretical derivation, numerical methodology, and examples on the ability of the theory to properly predict the behavior of related experimental systems, see, for example, reviews Nap et al. (48) and Szleifer and Carignano (51,56) and references therein.
RESULTS
Behavior of one aggrecan
First we describe the behavior of a single aggrecan or weak polyelectrolytes end-tethered to one cylindrical surface (48). The description of the behavior of one single aggrecan molecule is essential for understanding the interactions between two aggrecans. The behavior of weak polyelectrolytes end-tethered to a cylindrical surface can be conveniently summarized by considering the average height of the tethered polymer layer as a function of pH and salt concentration. A suitable measure for that height is the first moment of the polymer density profile, which is defined as follows:
 |
(15) |
where r denotes the radial coordinate perpendicular to the cylindrical surface of radius R, and G(r) is a geometrical factor equal to r/R (48,51,57).
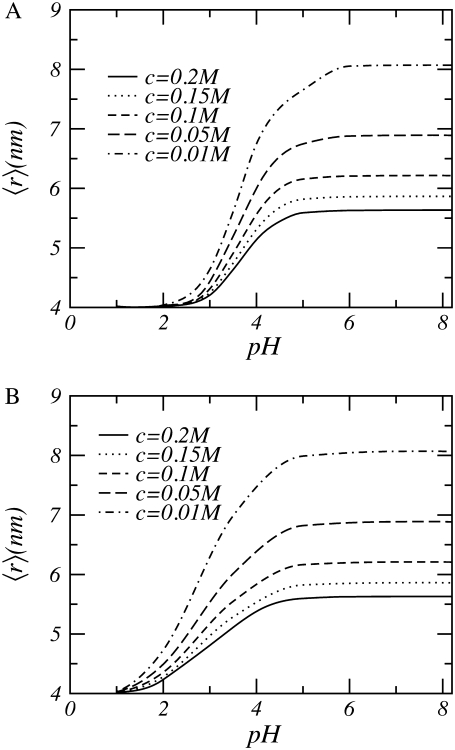
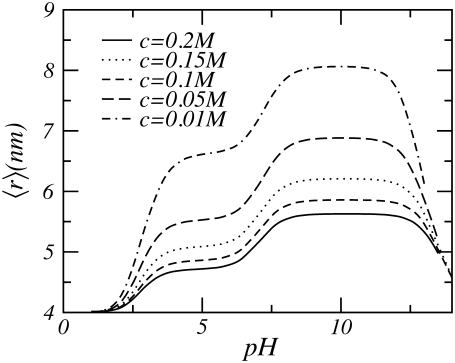
In Fig. 3 the thickness of the polymer layer as a function of pH for a variety of salt concentrations is depicted. For low pHs the thickness remains constant and is unaffected by changes in the salt concentration. Raising the pH results in an increase of the height of the polymer layer. At these higher pH values, the thickness of the layer is also affected by changes in the salt concentration; with decreasing salt concentration the thickness increases. At high pH, the thickness of the polymer layer does not increase anymore; however, it is still influenced by the salt concentration.
FIGURE 3.
Height of polysaccharides grafted to a cylindrical surface as a function of bulk pH. (A) A bulk equilibrium constant pKa = 3.5. (B) The polymer segments have two alternating equilibrium constants of pKa = 2 and pKa = 3.5. In both cases, the polymer length is n = 50 and the line density σl = 0.25 nm−1. The radius of the cylinder is R = 0.5 nm.
For low pH, the local acid-base equilibrium is shifted almost completely toward the uncharged state. Consequently, the polyelectrolyte behaves similarly to a neutral polymer (57,58). Increasing the pH, thus decreasing the concentration of [H+], results in a shift of the acid-base equilibrium toward the charged state. As the weak polyelectrolytes become charged, the electrostatic repulsions cause the polymers to stretch and the layer thickness increases, as can be observed in Fig. 3. At high bulk pH, almost all acid groups have acquired charges; consequently, changing the pH has no additional effect on the thickness of the polymer layer.
The effect of salt on the layer thickness is as follows. At high salt concentrations, the ions screen the electrostatic repulsions. Reduction of the salt concentration leads to an increase in the electrostatic interactions, causing the polymers to stretch and resulting in an increase in the height of the tethered layer. A further decrease of the salt concentration leads to a further reduction of the electrostatic screening but also to a decrease in the number of charged groups because the salt ions not only control the strength and range of the electrostatic interactions but also regulate the amount of charge on the polymers. Salt concentration and pH influence the acid-base equilibrium. At low salt concentrations, the number of counterions is so small that the protons also act as counterions.
To compensate for the small number of counterions, the number of protons increases, thereby shifting the acid-base equilibrium toward the uncharged state. Thus, lowering the salt concentration leads to a reduction of the interaction energy due to the decharging of the polyelectrolytes. Simultaneously, there is an increase in the range and strength of electrostatic repulsions caused by the diminishing screening. When the first tendency prevails, the height of the polymer layer as a function of the salt concentration passes through a maximum. Our results presented in Fig. 3 show that in the range of salt concentrations investigated we do not observe this maximum, although the decharging of the polyelectrolytes is seen. However, for similar planar systems, the maximum is observed (see Nap et al. (48)), consistent with scaling theory, self-consistent mean field predictions, and computer simulations (48,49,59–67).
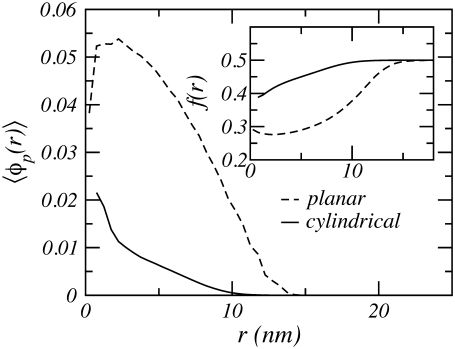
The lack of a maximum is a result of the geometry of the tethering surface and its nanometer size radius, as discussed in detail in Nap et al. (48). The effect of geometry is illustrated in Fig. 4, which shows the polymer volume fraction for weak polyelectrolytes tethered to a cylindrical and a planar surface. The polymer density of the cylindrical polymer layer is much lower than that of the planar layer, because the volume available to the polymer chains tethered to the cylindrical surface increases with the distance from the surface whereas the available volume remains constant in a planar geometry. The inset of the figure shows the degree of dissociation or fraction of charged groups. It is clear from the figure that the degree of dissociation depends on the distance from the surface and the surface geometry. The number of charges of the polyelectrolytes is higher for the cylindrical layer than for the planar case. This is because the local acid-base equilibrium shifts toward the uncharged state with increasing polymer density. The reason is that a larger volume fraction of polymer results in larger electrostatic repulsions, and to compensate for these increased repulsions the charge is regulated by shifting the equilibrium toward the uncharged state. Therefore, the cylindrical layer has more charges on its polyelectrolytes because the local polymer density is smaller compared to that of an equivalent planar layer. This fact has important consequences; for example, one cannot infer the behavior of the interactions between two cylindrical polymer layers from those between two planar polymer layers, as will be shown below.
FIGURE 4.
Polymer density as a function of the distance from a cylindrical or a planar surface. Polymer chain length is n = 50, pH = pKa = 3.5, and a bulk salt concentration c = 0.1 M. The radius of the cylindrical surface is R = 0.5 nm. The line density for the cylinder is σl = 0.25 nm−1, which is equivalent to the surface density for the planar surface of σa = 0.08 nm−2. The inset shows the local degree of dissociation. r corresponds to radial distance for the cylindrical surface and to the perpendicular distance for the planar surface.
The results of Fig. 3 A correspond to polyelectrolytes which have only one type of acidic group. Aggrecan, however, consists of polysaccharides with two different types of acidic groups: one sulfonic and one carboxylic group per repeat unit. In Fig. 3 B, we also show the behavior of molecules having two different types of acidic groups. The acidic groups are distributed in an alternating fashion: a segment with a higher pKa is followed by a segment with a lower pKa, which in turn is followed by a segment with a higher pKa. The bulk acid constants of those groups correspond to the carboxylic and sulfonic groups in aggrecan and have a value of pKa = 2 and 3.5, respectively (15). Comparing the height curves of the monoacidic polyelectrolyte with a pKa = 3.5 to a diacidic polyelectrolyte shows comparable behavior. At high pH, the behavior is identical. However for the range pH = 2–3, where the transition to a larger layer thicknesses occurs, the behavior is different. The transition region is broader for polyelectrolytes having both carboxylic and sulfonic groups than those having only carboxylic groups.
Under similar conditions the acid-base equilibrium of the sulfonic group is shifted more to the charged state than the acid-base equilibrium of the carboxylic group. This is because the equilibrium constant of the sulfonic group is larger than that of the carboxylic group. Thus, at low pH, polyelectrolytes having sulfonic and carboxylic groups will have more charges than polyelectrolytes consisting solely of carboxylic groups and therefore are slightly more stretched. Hence, the transition region broadens. At high pH, the difference in the amount of dissociation becomes negligible as almost all groups are charged, and hence the heights for both polyelectrolyte layers coincide.
The equilibrium constants for the carboxylic and sulfonic groups are relatively close together; hence, the effect of having two distinct equilibrium constants instead of one is small, unless the pH is in the range of pKa. On the other hand, when the equilibrium constants are very far apart, the change in behavior is very large. Examples for pKa = 2.5 and pKa = 7 is shown in Fig. 5. The value of pKa = 7 is chosen to maximize the effect. The polyelectrolyte layer now exists in distinguishable separated states: neutral, partially charged, and fully charged. At low pH, the polyelectrolyte is neutral. With increasing pH of the solution, the acid groups belonging to the smaller pKa become charged (partially charged). Subsequently, the acids groups with a higher pKa also acquire charge (fully charged). For pH ≳ 12 the layer thickness decreases again. An increase of the pH requires the addition of base, NaOH, to the solution. Thus an increase in pH is accompanied by an increase of the counterion, Na+, concentration. For very high pH, the effect of these extra counterions becomes noticeable as their concentration becomes comparable to the counterion concentration arising from the salt solution (NaCl). Thus, the ionic strength increases and the electrostatic repulsions become screened, resulting in a collapse of the polymer layer. This collapse is caused solely by the screening of the electrostatic interactions as the polymers remain fully charged. The same behavior also applies to weak polyelectrolytes with one type of acidic group (48). However for clarity, the full pH range was not shown in Fig. 3.
FIGURE 5.
Polymer height as a function of the pH for a cylindrical polyelectrolyte layer. The polymer segments have two alternating acid groups. Each acid has an equilibrium constant of pKa = 2.5 and pKa = 7, respectively. The polymer length is n = 50, the line density σl = 0.25 nm−1, and the radius R = 0.5 nm.
When the two acids have comparable bulk equilibrium constants, as do aggrecan molecules, the polyelectrolyte behaves similarly to polyelectrolytes having only one type of acid. Therefore, all the results below are for a polyelectrolyte having only one type of acid, which has a bulk equilibrium constant of pKa = 3.5.
Interactions between two aggrecans
The free energy per unit length as a function of the distance between two parallel cylinders end-tethered with weak polyelectrolyte or aggrecans has been calculated for a number of different conditions.
We first recall the behavior of neutral cylindrical layers (see Shvartzman-Cohen et al. (24)). When the distance between the cylindrical polymer layers is larger than the thickness of the polymer layer, they do not interact. Reducing the distance such that the two polymer layers feel each other leads to entropic repulsions due to the excluded volume interactions of the polymer chains and the expulsion of solvent molecules (osmotic repulsions). The range and strength of the repulsions increase with increasing length or grafting density of the tethered polymer chains (24).
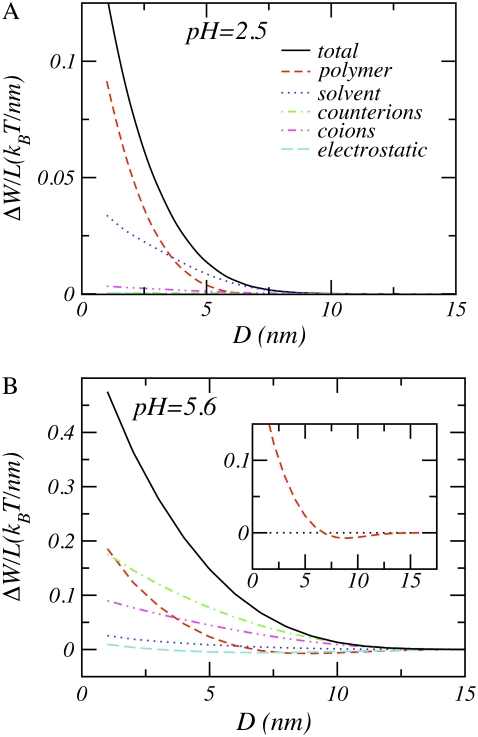
Consider now the interactions between model aggrecans. Fig. 6 shows the total free energy and its individual contributions for a low and a high pH value. The polysaccharides in low pH environments have a very low degree of dissociation. Consequently, they behave similarly to their neutral counterparts. The most important contributions originate from the entropic repulsions of the polymer and the osmotic pressure of the solvent molecules; all other free energy contributions are negligible in comparison, as expected for a neutral polymer. On the other hand, in high pH environments, the aggrecans behave rather differently from neutral polymers. Increasing the pH of the solution leads to significant changes in both the strength and the range of the interactions.
FIGURE 6.
The total and individual contributions to the free energy per unit length as a function of the distance between the aggrecans (see Eq. 2) for n = 25, σl = 0.1 nm−1, pKa = 3.5, c = 0.1 M, and R = 0.5 nm. (A) pH = 2.5. (B) pH = 5.6. The free energy contributions of the protons, hydroxyl ions, and the chemical equilibrium reaction have been omitted. On the size of the graph, their values are too small to be visible. The inset of the right-hand panel shows the free energy contribution arising from the polymer conformational degree of freedom.
As described above, an increase of the bulk pH results in a large amount of charge on the polymer chain. These charges attract counterions and repel coions, confining the counterions within the polymer layer and expelling the coions. The counterion confinement induces a large loss in mixing entropy. Similarly, the coions lose mixing entropy. The loss of mixing entropy due to the confinement of the counterions is the largest contribution to the overall repulsion, as seen in Fig. 6. However other free energy contributions are not small in comparison. Particularly, the mixing entropy of the coions, the conformational entropy of the polymer chains, and the mixing entropy of the solvent are of the same order of magnitude as the loss of entropy of the counterions. Moreover, at very small separations of the cylinders, the loss of conformation entropy of the polymer becomes the leading contribution. This indicates that the increase of the repulsion cannot be solely attributed to the counterion confinement. Instead, the repulsions arise from a subtle interplay between the mixing entropy of the ions, the conformation entropy of the polymer chains, and the solvent osmotic pressure. Their relative contributions are also strongly distance dependent.
The delicate interplay between the forces can be exemplified by considering the conformational entropy of the polymers. The conformational entropy arising from the polymers, also displayed in the inset of Fig. 6 for clarity, has a small but distinct minimum. The reason for the occurrence of this minimum is as follows. In high pH environments, the polysaccharides are more stretched than their neutral counterparts due to the charges on the molecule. Reducing the separation between the two cylinders such that polyelectrolytes tethered to one of the cylinders can interact with polyelectrolytes tethered to the opposing cylinder results in a local increase of the polymer density. This increase of the polymer density causes a shift of the local acid-base equilibrium toward the uncharged state, and the local degree of dissociation drops. Thus, there are fewer charges on the polysaccharides that are located between the cylinders, resulting in less extended conformations and leading to an increase in the conformational entropy. However, at smaller separations, the excluded volume interactions become dominant, leading to a loss of conformational entropy. The gain in conformational entropy at intermediate separations is completely offset by the loss of entropy associated with counterion confinement, leading to a net repulsion. The total free energy is repulsive over the entire range of salt concentrations, pH values, and distances between the molecules investigated.
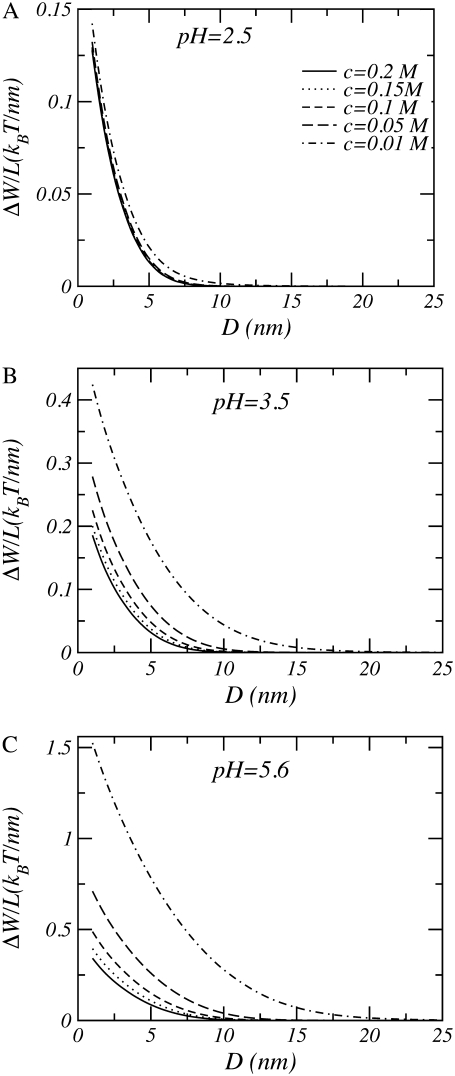
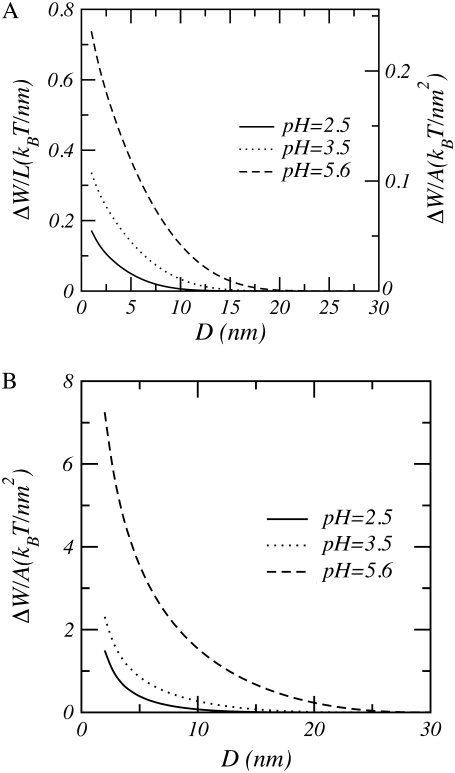
Fig. 7 shows the role of pH and salt concentration on the interaggrecan interactions. At low bulk pHs (i.e., pH = 2.5), changes in salt concentration have almost no effect upon range and strength of the interactions. Aggrecan in low pH environments has a very small amount of charge, and consequently the system behaves as if it were neutral. As argued above, the free energy change in neutral and almost neutral systems are primarily driven by changes in the entropic repulsions of the polymers and the osmotic pressure of the solvent. Therefore, changing the salt concentration has an almost negligible effect on the size of the interactions. With increasing bulk pH, the size and range of the repulsions increases. Similarly, with decreasing salt concentration, the strength and range of the interactions increases. When the polymers acquire charges, the loss of mixing entropy due to the confinement of the counterions will be the dominant contribution to the interactions; this will cause an increase in range as well as strength of the repulsions. It is important to emphasize that the interaction scales shown in Fig. 7 are very different, providing a quantitative idea of the effect of pH and ionic strength. For example, for physiological salt concentrations the strength of the repulsions increases by a factor of 3 by changing the pH from 2.5 to 5.6. An even more dramatic change is predicted for lower salt concentrations. Note that the value for the high bulk pH is 5.6 and was used because it commonly occurs in experiments (68), as it corresponds to an unbuffered water solution.
FIGURE 7.
Free energy per unit length as a function of distance between model aggrecans. (A) pH = 2.5. (B) pH = 3.5. (C) pH = 5.6. In all cases n = 25, σl = 0.1 nm−1, R = 0.5 nm, and pKa = 3.5.
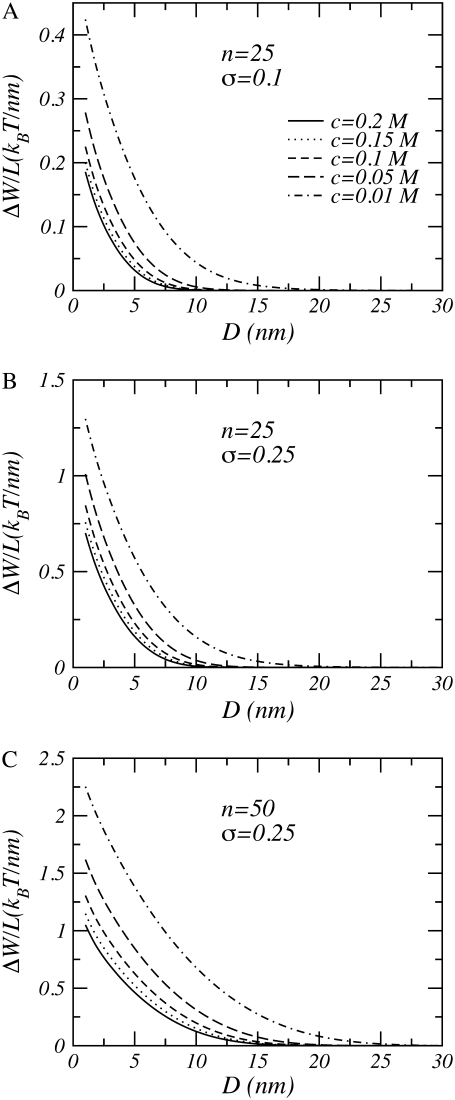
Fig. 8 illustrates the effect of grafting density and polymer length on the interactions. Going from A to B, the grafting density is increased, and in C the polymer chain length is doubled. Increasing the grafting density leads to an increase in the strength of the repulsions, whereas increasing the polymer length leads to an increase in both range and strength of the interactions.
FIGURE 8.
Free energy per unit length as a function of distance between model aggrecans. (A) n = 25 and σ = 0.1 nm−1. (B) n = 25 and σl = 0.25 nm−1. (C) n = 50 and σl = 0.25 nm−1. In all cases pKa = 3.5, pH = 3.5, and R = 0.5 nm.
To explore the differences due to the surface geometry, we display in Fig. 9 the interactions between model polysaccharides tethered to two cylinders as well as two planar surfaces. All variables and environmental parameters are identical except for the geometry, which has two important effects. First, the repulsion between polyelectrolytes tethered on cylinders is much weaker than that for the corresponding planar case under identical conditions (see right-hand scale of Fig. 9). Thus, the energetic cost to bring the cylinders to a distance D from each other is much lower than that of the corresponding planar system. Second, the interactions between two polymers tethered to planar surfaces diverge at small separations, whereas they remain finite for cylinders. As a result, the two cylindrical surfaces can be brought into contact with each other.
FIGURE 9.
Free energy per unit length as a function of distance for (A) cylindrical and (B) planar surfaces with n = 50, pKa = 3.5, c = 0.1 M, and a grafting density of σa = 0.032 nm−2. The radius of the cylinder is R = 0.5 nm; hence the number of polymers per unit length or line density is σl = 0.1 nm−1. For the cylinder, the left-hand scale is the free energy per unit length and the right-hand axis gives the free energy per unit area which is needed for the comparison with that of the planar surface.
These effects are due to the ability of the polymers to avoid overcrowding in the intersurface region by adopting conformations such that most polymer segments are not in the region between the cylinders. The polymers fold toward the “back” of the cylinders and avoid direct contact with polymers belonging to the opposing cylindrical surface. This has been confirmed experimentally for other curved surfaces, i.e., nanometer-sized spheres (26). Polymer chains grafted to the planar surface do not have this degree of freedom and experience larger excluded volume, osmotic repulsions, and counterion confinement. At a short separation between planar surfaces, all available volume is filled, and hence further reduction of the separation causes the free energy to diverge.
Structural properties
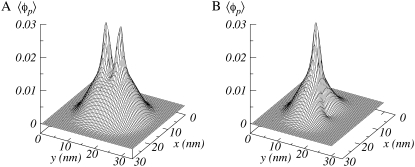
Fig. 10 presents a typical volume fraction profile of the polymers for cylinders at a relatively short separation. At this distance, both polymer layers strongly interact with each other. The polymer volume fraction is lower in the intertube region and higher at the opposing sides of the cylinders. The polymers have moved out of the intertube region to avoid overcrowding. To illustrate this effect in more detail, we also show the corresponding polymer density belonging to only one cylinder. The polymer segments are asymmetrically distributed around the cylindrical surface and preferentially located outside the intertube region.
FIGURE 10.
Polymer volume fraction (A) and polymer fraction belonging to one cylinder (B). The distance between the cylinders D = 4 nm, n = 50, σl = 0.25 nm−2, pH = 3.5, pKa = 3.5, c = 0.1 M, and R = 0.5 nm.
The polymer density profiles reveal that the polymers avoid overcrowding by adopting conformations such that most polymer segments are not within the intertube region. This effect can be quantified by considering the overlap the polymers experience with polymers tethered to the opposing surface. We define the overlap as the integral of the product of the polymer densities belonging to the two aggrecan molecules,
 |
(16) |
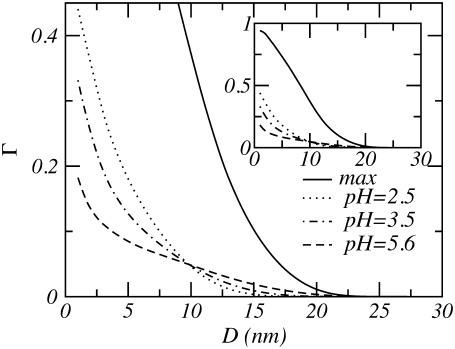
normalized by the square of polymer density belonging to one aggrecan molecule. The L and R label the individual aggrecan-like molecules. The overlap or interdigitation is normalized such that its value is between 0 and 1. In Fig. 11, the overlap for several bulk pHs is presented. For comparison, we also show the overlap which two aggrecan-like molecules have in the absences of any interactions between the molecules. This situation corresponds to the maximum possible interdigitation and is shown as the solid curve. Fig. 11 reveals that the amount of interdigitation is much lower than its geometrical maximum. This indicates that a large number of the polymers, under the influence of the excluded volume and electrostatic repulsions, try to avoid each other by adopting conformations that reduce the number of energetically unfavorable contacts. This quantifies the move of the polymers out of the intertube region, as the density profiles have shown. Note that the interdigitation is small but not zero, meaning that a finite number of polymers remain within the intertube region.
FIGURE 11.
Polysaccharides interdigitation as a function of the distance between the two cylinders, for n = 50, σl = 0.25 nm−1, pKa = 3.5, and c = 0.1 M. The solid curves labeled “max” correspond to the maximum possible overlap. The inset shows the total size of the maximal overlap.
The interdigitation of the polymer layers is influenced by the pH of the solution. As a function of pH, the curves show a crossover behavior. For increasing pH, the overlap at small separations drops considerably, whereas the overlap becomes nonzero for larger separations.
This behavior is in agreement with the previously outlined behavior of cylindrical polyelectrolyte layers. High pH values induce charges on the polyelectrolytes, which subsequently stretch. Hence the cylindrical polymer layers overlap at larger distances. At shorter separations between the aggrecans, the polymers will experience compressive forces. By adopting conformations that avoid overcrowding in the intertube region, the overall repulsions are reduced. With increasing pH, electrostatic forces will start to contribute to the overall compressive forces. With additional stretching of the chain and lowering of the amount of overlap, the polymer chains are farther “away” from each other, thereby partially reducing the amount of compressive forces.
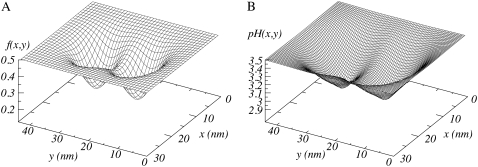
The inhomogeneous distribution of the polymer chains results in a varying local degree of dissociation, pH, and ion density. We present in Fig. 12 the local degree dissociation f(x, y) and pH(x, y) for a bulk pH = 3.5 and a bulk salt concentration of c = 0.01 M. Depending on the position, the fraction of charges varies between 0.2 and 0.5. Close to the cylindrical surface, where the polymer density is highest, the degree of dissociation is at its lowest. For a higher bulk pH of 5.6, the fraction of charged segments approaches 1 (f > 0.9). The pH also shows large local variations. For the case shown in Fig. 12, the local pH varies from 3.5 in the bulk to 2.9 close to the cylindrical surface. For higher bulk pH and decreasing salt concentrations, larger variation can be achieved; around the order of one unit, and in planar geometries even larger pH changes can be obtained—up to a factor of two units (48).
FIGURE 12.
Local degree of dissociation (A) and pH (B) for a distance between the two cylinders of D = 14 nm, for n = 50, σl = 0.25 nm−1, pH = 3.5, pKa = 3.5, and c = 0.01 M.
The results presented here show a large inhomogeneous spatial distribution of degree of dissociation, local pH, polymer density, ion densities, and electrostatic potential. Moreover, all these distributions and their spatial variation will change when the distance between the aggrecan molecules is altered. These changes are also reflected in the change in overlap versus separation of the aggrecan molecules, as shown in Fig. 11, and they demonstrate the strong coupling that exists between the different interactions and the local chemical equilibrium.
Relevance and concluding remarks
This study provides a detailed description of the interactions and structural organization of two aggrecan molecules. The interactions between the two aggrecans or more generic two-cylinder surfaces end-tethered with weak polyelectrolytes are shown to be strongly coupled to bulk salt concentration, pH, and polymer density. The salt concentration tunes the electrostatic interactions and regulates the charging of the polymers. Moreover, the geometry of the polymer layer and chemical composition profoundly influences the interactions and structural properties of the aggrecan molecules.
In the following, we relate our theoretical findings to experimental observations on the behavior of aggrecan and its aggregate in cartilage. The role of aggrecan in cartilage is to withstand large compressive forces. This is done by generating a large osmotic pressure originating from the charges of the polymer side chains and the counterions. We found that the interactions between two aggrecan molecules are indeed strongly repulsive, thus confirming the physical picture and moreover putting it on a firm molecular basis. The size of the repulsions between two tethered cylinders at a separation of 10 nm is ∼ΔW/L = 0.1 kBT/nm (see Fig. 9). This results in a net repulsion of the order of 40 kBT for aggrecan molecules with a typical length of 400 nm. It is this very large repulsion that enables cartilage to resist compressive forces.
The calculations also provide insight into the assembly of the aggrecans. The interactions between individual aggrecans are repulsive. These repulsive forces have to be overcome for the aggrecans to be retained in cartilage. Therefore aggrecans aggregate with hyaluronic acid into large supramolecular complexes. A schematic cartoon of such an aggregate is depicted in Fig. 1. The formation of an aggregate proceeds in two steps. First, the G1-globular domain of the aggrecan binds noncovalently to the hyaluronic acid, leading to the initial formation of the aggregate. Second, a small protein (∼45 kDa) called a “link protein” forms a ternary complex with the G1-domain and the hyaluronan, strengthening the aggrecan-hyaluronan bond. The link-protein enhances the thermal stability of the aggregates and prevents dissociation under physiological conditions. However without link-protein, binding between aggrecan and hyaluronan still occurs. For aggrecan to bind to hyaluronic acid, the system has to overcome the repulsive forces between the aggrecan molecules. We have computed the repulsive forces between two aggrecan molecules as a function of its separation. Therefore, knowledge of the binding energy can be used to provide us with an estimation of the average separation distance between the aggrecans and, hence, with the optimal structure of the proteoglycan aggregate.
Experiments have reported that aggrecan-hyaluronan binding has a dissociation constant of the order of KD = 10−7 (69–71). Taking a value of KD = 2.5 10−7 (71) results in a binding energy of ΔGB = −15.2 kBT. For an aggrecan to bind to the hyaluronic acid, the binding energy needs to exceed the repulsive interactions between the aggrecans, i.e., − ΔGB ≥ ΔW(D). We assume that the repulsive forces between the aggrecans during aggregation are primary controlled by the pair interactions of two aggrecan molecules. Then, we can use our calculations to obtain the minimal distance of separation of the aggrecans within an aggregate. For an aggrecan of a typical length of 400 nm, this results in a maximum repulsive free energy per unit length of ΔW/L = 0.038 kBT/nm, which leads to a minimal separation of D = 20.5 nm. This number was obtained for an aggrecan molecule having GAG chains with n = 50 segments, a grafting line density of σl = 0.25 nm−1, a bulk pH = 5.6, and a physiological ionic strength of c = 0.1 M. For a lower grafting line density of σl = 0.1 nm−1, the minimal distance reduces to D = 14.5 nm. Changing the pH or salt concentration of the solution leads to significant changes in the spacing, as can be inferred from the free energy curves (Figs. 7–9). Likewise, increasing the density of chains or increasing the length of the polysaccharides increases the range and strength of the interactions and as a result the spacing of the aggrecan molecules in the aggregates. Note also that the overall length of the aggrecan molecule will influence the spacing between the aggrecan. Longer molecules have large separations. Finally, adding link protein increases the binding energy, which will shorten the separation distance, in agreement with experimental observations (23).
Experiments indicate that the average distance between individual aggrecan monomers in proteoglycan aggregates is around 15–40 nm (12,13,23,72,73), with lower values of 12–17 nm and larger values up to 60–100 nm. The large variation is due to a difference in length of the glycosaminoglycan side chains as a function of age, location in cartilage, anatomical site of the cartilage, and the environment (pH and salt concentration) in which the aggregates are studied. Another contributing factor is the fact that measurements are usually performed on reconstituted aggregates. Aggrecans and hyaluronic acid are individually extracted from cartilage and then reassembled. In the experimental technique of microscopy or AFM, the aggregate is deposited on a substrate, thereby extending the conformation of the aggregate. This also influences the measured average spacing. Based on these observations, it is proposed that the average spacing in cartilage is smaller than the measured values; values of 20 nm have been suggested (23).
The values for the computed spacings are within the range of observed values. More importantly, at the computed spacings the interpenetration of the aggrecan molecules is low (Γ ≲ 0.003). Low interdigitation implies that the frictional and sliding forces between aggrecan molecules are small. These phenomena may contribute to the good lubricating propriety of joints (i.e., cartilage), and it also can explain the low frictional forces observed for polyelectrolyte layers (8,74–77). Also, for the found spacings, the molecules are relatively far apart; they just touch each other. However a reduction of the separation by just a few nanometers results in a large (two- to fourfold) increase in the repulsive energy, as the molecules start to interact with each other. Thus, by positioning the molecules at each others' outer perimeter, they are ideally located to fulfill the task of withstanding compressive forces.
All above conclusions on the spacing of aggrecans within an aggregate and lubrication properties of aggrecan are based on the computed interactions between two aggrecans. In a dilute aggrecan solution, we can ignore the simultaneous interactions between more than two aggrecan molecules, and the interactions are properly described by the computed pair interactions. However, in denser solutions such as cartilage (∼10% wt aggrecan), interactions beyond the pair interactions—that is, simultaneous interactions between more than two molecules—may become more important and should be included to accurately describe the solution. However, as the computed spacing are within the range of observed values, we have at least described the dominant part of the aggregation behavior.
Other proteoglycans such as versican and brevican have a structure similar to aggrecan (78). Although they have different globular domains, they all have a large extended glycosaminoglycan (GAG) domain, albeit of different lengths. Therefore, our results for aggrecans are also applicable to these other groups of proteoglycans.
In the work presented here, we have assumed that the cylindrical surface is rigid. Although this is approximately true for aggrecan molecules, future investigations should allow the possibility of bending the surface. Bending can be incorporated along the lines of Feuz et al. (79).
Theoretically, the molecular details of the polysaccharides are included through the conformations of the chains. The charging of polymers chains is considered via a position-dependent acid-base equilibrium, which is coupled to the conformation of the chains and all the electrostatic and nonelectrostatic nonlocal interactions. We did not consider any quantum mechanical or molecular details of the ions beyond their size, shape, and charge. All the ionic species were treated on a similar level. However, different ions will have different solvation structures in water, and more particular protons have been shown to have anomalous diffusion dynamics (80). It would be interesting to investigate such quantum mechanical effects on the dynamics and interactions of aggrecan molecules. However, such an investigation is beyond the scope of this work. Furthermore, it is not clear how to incorporate specific quantum effects into coarse-grained models of the type of the presented molecular theory. We believe that most of the equilibrium properties predicted for the aggrecans are valid based on our previous studies on other weak polyelectrolytes. For example, the predicted thickness of poly(acrylic acid) and the structure and electrochemical properties of redox-modified poly(allyl amine)-coated electrodes were shown to be in excellent agreement with experimental observations (46,53,81).
Finally, another important conclusion is that interactions between polymer tethered cylinders are strongly influence by the nanometer-sized radius of the cylinders. The interactions between planar surfaces are very different. Hence, the behavior of nanometer curved surfaces cannot be inferred from interactions between similar planar surfaces, because the forces are strongly influenced by the geometry. Therefore, explicit consideration of the molecular organization and the coupling between geometry, charge distribution, and polymer density is necessary for the interpretation of experimental observations such as AFM.
Acknowledgments
We thank Lin Han and Profs. Christine Ortiz and Alan Grodzinsky for assistance and helpful discussions.
The research was supported by National Science Foundation-Nanoscale Interdisciplinary Research Team (grant No. 0403903).
Editor: Steven D. Schwartz.
References
- 1.Roughley, P. J. 2006. The structure and function of cartilage proteoglycans. Eur. Cell. Mater. 12:92–101. [DOI] [PubMed] [Google Scholar]
- 2.Vertel, B. M., and A. R. Ratcliffe. 2000. Aggrecan. In Proteoglycans: Structure, Biology, and Molecular Interactions. R. V. Iozzo, editor. Marcel Dekker, New York. 343–377.
- 3.Roughley, P. J., and E. R. Lee. 1994. Cartilage proteoglycans: structure and potential functions. Microsc. Res. Tech. 28:385–397. [DOI] [PubMed] [Google Scholar]
- 4.Maroudas, A. 1976. Balance between swelling pressure and collagen tension in normal and degenerate cartilage. Nature. 260:808–809. [DOI] [PubMed] [Google Scholar]
- 5.Saxne, T., A. Glennas, T. K. Kvien, K. Melby, and D. Heinegård. 1993. Release of cartilage macromolecules into the synovial fluid in patients with acute and prolonged phases of reactive arthritis. Arthritis Rheum. 36:20–25. [DOI] [PubMed] [Google Scholar]
- 6.Hardingham, T. 1998. Chondrotin sulfate and joint disease. Osteoarthritis Cartilage. 6:3–5. [DOI] [PubMed] [Google Scholar]
- 7.Papagiannopoulos, A., T. Waigh, T. Hardingham, and M. Heinrich. 2006. Solution structure and dynamics of cartilage aggrecan. Biomacromolecules. 7:2162–2172. [DOI] [PubMed] [Google Scholar]
- 8.Klein, J. 2006. Molecular mechanisms of synovial joint lubrication. Proc. Inst. Mech. Eng. Part J. 220:691–710. [Google Scholar]
- 9.Ng, L., A. J. Grodzinsky, P. Patwari, J. Sandy, A. Plaas, and C. Ortiz. 2003. Individual cartilage aggrecan macromolecules and their constituent glycosaminoglycans visualized via atomic force microscopy. J. Struct. Biol. 143:242–257. [DOI] [PubMed] [Google Scholar]
- 10.Bayliss, M. T., D. Osborne, S. Woodhouse, and C. Davidson. 1999. Sulfation of chondroitin sulfate in human articular cartilage. The effect of age, topographical position, and zone of cartilage on tissue composition. J. Biol. Chem. 274:15892–15900. [DOI] [PubMed] [Google Scholar]
- 11.Plaas, A. H. K., L. A. West, S. Wong-Palms, and F. R. T. Nelson. 1998. Glycosaminoglycan sulfation in human osteoarthritis. Disease-related alterations at the non-reducing termini of chondroitin and dermatan sulfate. J. Biol. Chem. 273:12642–12649. [DOI] [PubMed] [Google Scholar]
- 12.Buckwalter, J. A., P. J. Roughley, and L. C. Rosenberg. 1994. Age-related changes in cartilage proteoglycans: quantitative electron microscopy studies. Microsc. Res. Tech. 28:398–408. [DOI] [PubMed] [Google Scholar]
- 13.Buckwalter, J. A., K. E. Kuettner, and E. J.-M. Thonar. 1985. Age-related changes in articular cartilage proteoglycans: electron microscopic studies. J. Orthop. Res. 3:251–257. [DOI] [PubMed] [Google Scholar]
- 14.Ng, L., A. J. Grodzinsky, J. Sandy, A. Plaas, and C. Ortiz. 2004. Persistence length of cartilage aggrecan macromolecules measured via atomic force microscopy. Macromol. Symp. 214:1–4. [Google Scholar]
- 15.Seog, J., D. Dean, A. H. K. Plaas, S. Wong-Palms, A. J. Grodzinsky, and C. Ortiz. 2002. Direct measurement of glycosaminoglycan intermolecular interactions via high-resolution force spectroscopy. Macromolecules. 35:5601–5615. [Google Scholar]
- 16.Mörgelin, M., M. Paulsson, A. Malmström, and D. Heinegård. 1989. Shared and distinct structural features of interstitial proteoglycans from different bovine tissues revealed by electron microscopy. J. Biol. Chem. 264:12080–12090. [PubMed] [Google Scholar]
- 17.Zhang, M., and A. H. E. Müller. 2005. Cylindrical polymer brushes. J. Polym. Sci., Part A: Polym. Chem. 43:3461–3481. [Google Scholar]
- 18.Saariaho, M., O. Ikkala, I. Szleifer, I. Erukhimovich, and G. ten Brinke. 1997. On lyotropic behavior of molecular bottle-brushes: a Monte Carlo computer simulation study. J. Chem. Phys. 107:3267–3276. [Google Scholar]
- 19.Sheiko, S. S., O. V. Borisov, S. A. Prokhorova, and M. Moller. 2004. Cylindrical molecular brushes under poor solvent conditions: microscopic observation and scaling analysis. Eur. Phys. J. E. 13:125–131. [DOI] [PubMed] [Google Scholar]
- 20.Buckwalter, J. A., and L. C. Rosenberg. 1982. Electron microscopic studies of cartilage proteoglycans. Direct evidence for the variable length of the chondroitin sulfate-rich region of proteoglycan subunit core protein. J. Biol. Chem. 257:9830–9839. [PubMed] [Google Scholar]
- 21.Mörgelin, M., M. Paulsson, D. Heinegård, U. Aebi, and J. Engel. 1995. Evidence of a defined spatial arrangement of hyaluronate in the central filament of cartilage proteoglycan aggregates. Biochem. J. 307:595–601. [DOI] [PMC free article] [PubMed] [Google Scholar]
- 22.Buckwalter, J. A., A. R. Poole, A. Reiner, and L. C. Rosenberg. 1982. Immunoferritin binding to proteoglycan monomers. An electron microscopic study. J. Biol. Chem. 257:10529–10532. [PubMed] [Google Scholar]
- 23.Kanh, A., A. D. Taitz, L. A. Pottenger, and G. M. Alberton. 1994. Effect of like protein and free hyaluronic acid binding region on spacing of proteoglycans in aggregates. J. Orthop. Res. 12:612–620. [DOI] [PubMed] [Google Scholar]
- 24.Shvartzman-Cohen, R., E. Nativ-Roth, E. Baskaran, Y. Levi-Kalisman, I. Szleifer, and R. Yerusalmi-Rozen. 2004. Selective dispersion of single-walled carbon nanotubes in the presence of polymers: the role of molecular and colloidal length scales. J. Am. Chem. Soc. 126:14850–14857. [DOI] [PubMed] [Google Scholar]
- 25.Mei, Y., and M. Ballauff. 2005. Effect of counterions on the swelling of spherical polyelectrolyte brushes. Eur. Phys. J. E. 16:341–349. [DOI] [PubMed] [Google Scholar]
- 26.Wittemann, A., M. Drechsler, Y. Talmon, and M. Ballauff. 2005. High elongation of polyelectrolyte chains in the osmotic limit of spherical polyelectrolyte brushes: a study by cryogenic transmission electron microscopy. J. Am. Chem. Soc. 127:9688–9689. [DOI] [PubMed] [Google Scholar]
- 27.Guo, X., and M. Ballauff. 2000. The spatial dimensions of colloidal brushes as determined by dynamic light scattering. Langmuir. 16:8719–8726. [Google Scholar]
- 28.Rosenfeld, S., A. Wittemann, M. Ballauff, E. Breininger, J. Bolze, and N. Dingenouts. 2004. Interaction of proteins with spherical polyelectrolytes brushes in solutions studied by small-angle x-ray scattering. Phys. Rev. E Stat. Nonlin. Soft Matter Phys. 70:061403. [DOI] [PubMed] [Google Scholar]
- 29.Guo, X., and M. Ballauff. 2001. Spherical polyelectrolyte brushes: comparison between annealed and quenched brushes. Phys. Rev. E. 64:051406. [DOI] [PubMed] [Google Scholar]
- 30.Bendejacq, D., M. Joanicot, and V. Ponsinet. 2005. Pearling instabilities in water-dispersed copolymer cylinders with charged brushes. Eur. Phys. J. E. 17:83–92. [DOI] [PubMed] [Google Scholar]
- 31.Hamley, I. W. 2005. Nanoshells and nanotubes from block copolymers. Soft Matter. 1:36–43. [DOI] [PubMed] [Google Scholar]
- 32.Lienkamp, K., L. Noé, M. Breniaux, I. Lieberwirth, F. Groehn, and G. Wegner. 2007. Synthesis and characterization of end-functionalized cylindrical polyelectrolyte brushes from poly(styrene sulfonate). Macromolecules. 40:2486–2502. [Google Scholar]
- 33.Zhulina, E. B., and F. A. M. Leermakers. 2007. A self-consistent field analysis of the neurofilament brush with amino-acid resolution. Biophys. J. 93:1421–1430. [DOI] [PMC free article] [PubMed] [Google Scholar]
- 34.Zhulina, E. B., and F. A. M. Leermakers. 2007. Effect of the ionic strength and pH on the equilibrium structure of a neurofilament brush. Biophys. J. 93:1452–1463. [DOI] [PMC free article] [PubMed] [Google Scholar]
- 35.Fleer, G. J., M. A. Cohen Stuart, J. M. H. M. Scheutjens, T. Cosgrove, and B. Vincent. 1993. Polymers at Interfaces. Chapman and Hall, London.
- 36.Bathe, M., G. C. Rutledge, A. J. Grodzinsky, and B. Tidor. 2005. Osmotic pressure of aqueous chondroitin sulfate solution: a molecular modeling investigation. Biophys. J. 89:2357–2371. [DOI] [PMC free article] [PubMed] [Google Scholar]
- 37.Bathe, M., G. C. Rutledge, A. J. Grodzinsky, and B. Tidor. 2005. A coarse-grained molecular model for glycosaminoglycans: application to chondroitin, chondroitin sulfate and hyaluronic acid. Biophys. J. 88:3870–3887. [DOI] [PMC free article] [PubMed] [Google Scholar]
- 38.Bathe, M., A. J. Grodzinsky, B. Tidor, and G. C. Rutledge. 2004. Optimal linearized Poisson-Boltzmann theory applied to the simulation of flexible polyelectrolytes in solution. J. Chem. Phys. 121:7557–7561. [DOI] [PubMed] [Google Scholar]
- 39.Buschmann, M. D., and A. J. Grodzinsky. 1995. A molecular model of proteoglycan-associated electrostatic forces in cartilage mechanics. J. Biomech. Eng. 117:179–192. [DOI] [PubMed] [Google Scholar]
- 40.Dean, D., J. Seog, C. Ortiz, and A. J. Grodzinsky. 2003. Molecular-level theoretical model for electrostatic interactions within polyelectrolyte brushes: applications to charged glycosaminoglycans. Langmuir. 19:5526–5539. [Google Scholar]
- 41.Jin, M., and A. J. Grodzinsky. 2001. Effect of electrostatic interactions between glycosaminoglycans on the shear stiffness of cartilage: a molecular model and experiments. Macromolecules. 34:8330–8339. [Google Scholar]
- 42.Seog, J., D. Dean, B. Rolauffs, T. Wu, J. Genzer, A. H. K. Plaas, A. J. Grodzinsky, and C. Ortiz. 2005. Nanomechanics of opposing glycosaminoglycan macromolecules. J. Biomech. 38:1789–1797. [DOI] [PubMed] [Google Scholar]
- 43.Kovach, I. 1996. A molecular theory of cartilage viscoelasticity. Biophys. Chem. 59:61–73. [DOI] [PubMed] [Google Scholar]
- 44.Nap, R., and I. Szleifer. 2005. Control of carbon nanotube-surface interactions: the role of grafted polymers. Langmuir. 21:12072–12075. [DOI] [PubMed] [Google Scholar]
- 45.Carignano, M. A., and I. Szleifer. 2002. Adsorption of model charged proteins on charged surfaces with grafted polymers. Mol. Phys. 100:2993–3003. [Google Scholar]
- 46.Wu, T., J. Genzer, P. Gong, I. Szleifer, P. Vlček, and V. Šubr. 2004. Behavior of surface-anchored poly(acrylic acid) brushes with grafting density gradients on solid substrates. In Polymer Brushes. R. Advicula, W. Brittain, K. Caster, and J. Rühe, editors. Wiley & Sons, New York. 287–315.
- 47.Gong, P., and I. Szleifer. 2006. Interactions between charged surfaces and functionalized grafted polymer layers. Ind. Eng. Chem. Res. 45:5466–5476. [Google Scholar]
- 48.Nap, R., P. Gong, and I. Szleifer. 2006. Weak polyelectrolytes tethered to surfaces: effect of geometry, acid-base equilibrium and electrical permittivity. J. Polym. Sci. Part B: Polym. Phys. 44:2638–2662. [Google Scholar]
- 49.Gong, P., J. Genzer, and I. Szleifer. 2007. Phase behavior and charge regulation of weak polyelectrolyte grafted layers. Phys. Rev. Lett. 98:018302. [DOI] [PubMed] [Google Scholar]
- 50.Fauré, M. C., P. Bassereau, M. A. Carignano, I. Szleifer, Y. Gallot, and D. Andelman. 1998. Monolayers of diblock copolymer at the air-water interface: the attractive monomer-surface case. Eur. Phys. J. B. 3:365–375. [Google Scholar]
- 51.Szleifer, I., and M. A. Carignano. 1996. Tethered polymer layers. Adv. Chem. Phys. 96:165–260. [Google Scholar]
- 52.Wu, T., P. Gong, I. Szleifer, P. Vlček, V. Šubr, and J. Genzer. 2007. Behavior of surface-anchored poly(acrylic acid) brushes with grafting density gradients on solid substrates: 1. Experiment. Macromolecules. 40:8756–8764. [Google Scholar]
- 53.Gong, P., T. Wu, J. Genzer, and I. Szleifer. 2007. Behavior of surface-anchored poly(acrylic acid) brushes with grafting density gradients on solid substrates: 2. Theory. Macromolecules. 40:8765–8773. [Google Scholar]
- 54.Raphael, E., and J. Joanny. 1990. Annealed and quenched polyelectrolyte. Europhys. Lett. 13:623–628. [Google Scholar]
- 55.Longo, G., and I. Szleifer. 2005. Ligand-receptor interactions in tethered polymer layers. Langmuir. 21:11342–11351. [DOI] [PubMed] [Google Scholar]
- 56.Szleifer, I., and M. A. Carignano. 2000. Tethered polymer layers: phase transitions and reduction of protein adsorption. Macromol. Rapid Commun. 21:423–448. [Google Scholar]
- 57.Carignano, M. A., and I. Szleifer. 1995. Structural and thermodynamic properties of end-grafted polymers on curved surfaces. J. Chem. Phys. 102:8662–8669. [Google Scholar]
- 58.Murat, M., and G. S. Grest. 1991. Polymers end-grafted onto a cylindrical surface. Macromolecules. 24:704–708. [Google Scholar]
- 59.Israëls, R., F. A. M. Leermakers, G. J. Fleer, and E. B. Zhulina. 1994. Charged polymeric brushes: structure and scaling relations. Macromolecules. 27:3249–3261. [Google Scholar]
- 60.Israëls, R., F. A. M. Leermakers, and G. J. Fleer. 1994. On the theory of grafted weak polyacids. Macromolecules. 27:3087–3093. [Google Scholar]
- 61.Lyatskaya, Y. V., F. A. M. Leermakers, G. J. Fleer, E. B. Zhulina, and T. M. Birshstein. 1995. Analytical self-consistent-field model of weak polyacid brushes. Macromolecules. 28:3562–3569. [Google Scholar]
- 62.Fleer, G. J. 1996. Polyelectrolyte brushes and polyelectrolyte adsorption layers. Ber. Bunsenges. Phys. Chem. 100:936–942. [Google Scholar]
- 63.Currie, E. P. K., A. B. Sieval, G. J. Fleer, and M. A. Cohen Stuart. 2000. Polyacrylic acid brushes: surface pressure and salt-induced swelling. Langmuir. 16:8324–8333. [Google Scholar]
- 64.Naij, A., C. Seidel, and R. R. Netz. 2006. Theoretical approaches to neutral and charged polymers. Adv. Polym. Sci. 198:149–183. [Google Scholar]
- 65.Holm, C., J. F. Joanny, K. Kremer, R. R. Netz, P. Reineker, C. Seidel, T. A. Vilgis, and R. Winkler. 2004. Polyelectrolyte theory. Adv. Polym. Sci. 166:67–111. [Google Scholar]
- 66.Ahrens, H., S. Förster, and C. A. Helm. 1998. Charged polymer brushes: counterion incorporation and scaling relations. Phys. Rev. Lett. 81:4172–4175. [Google Scholar]
- 67.Csajka, F. S., R. R. Netz, C. Seidel, and J. Joanny. 2001. Collapse of polyelectrolyte brushes: scaling, theory and simulations. Eur. Phys. J. E. 4:505–513. [Google Scholar]
- 68.Dean, D., L. Han, C. Ortiz, and A. J. Grodzinsky. 2005. Nanoscale conformation and compressibility of cartilage aggrecan using microcontact printing and atomic force microscopy. Macromolecules. 38:4047–4049. [Google Scholar]
- 69.Watanabe, H., S. C. Cheung, N. Itano, K. Kimata, and Y. Yamada. 1997. Identification of hyaluronan-binding domains of aggrecan. J. Biol. Chem. 272:28057–28065. [DOI] [PubMed] [Google Scholar]
- 70.Olin, A. I., M. Mörgelin, T. Sasaki, R. Timpl, D. Heinegård, and A. Aspberg. 2001. The proteoglycans aggrecan and versican form networks with fibulin-2 through their lectin domain binding. J. Biol. Chem. 276:1253–1261. [DOI] [PubMed] [Google Scholar]
- 71.Kahmann, J. D., R. O'Brien, J. M. Werner, D. Heinegård, J. E. Ladbury, I. D. Campbell, and A. J. Day. 2000. Localization and characterization of the hyaluronan-binding site on the Link module from human TSG-6. Structure. 8:763–774. [DOI] [PubMed] [Google Scholar]
- 72.Buckwalter, J. A., L. C. Rosenberg, and L. H. Tang. 1984. The effect of link protein on proteoglycan aggregate structure. An electron microscopic study of the molecular architecture and dimensions of proteoglycan aggregates reassembled from the proteoglycan monomers and link proteins of bovine fetal epiphyseal cartilage. J. Biol. Chem. 259:5361–5363. [PubMed] [Google Scholar]
- 73.Kahn, A., L. A. Pottenger, F. M. Phillips, and R. W. Viola. 1991. Evidence of proteoglycan/proteoglycan interactions within aggregates. J. Orthop. Res. 9:777–786. [DOI] [PubMed] [Google Scholar]
- 74.Raviv, U., S. Giasson, N. Kampf, J.-F. Gohy, R. Jérôme, and J. Klein. 2003. Lubrication by charged polymers. Nature. 425:163–165. [DOI] [PubMed] [Google Scholar]
- 75.Gong, J. P., and Y. Osada. 2002. Surface friction of polymer gels. Prog. Polym. Sci. 27:3–38. [Google Scholar]
- 76.Gong, J. P. 2006. Friction and lubrication of hydrogels—its richness and complexity. Soft Matter. 2:544–552. [DOI] [PubMed] [Google Scholar]
- 77.Lee, S., and N. D. Spencer. 2008. Sweet, hairy, soft, and slippery. Science. 319:575–576. [DOI] [PubMed] [Google Scholar]
- 78.Iozzo, R. V. 2000. Proteoglycans: Structure, Biology, and Molecular Interactions. Marcel Dekker, New York.
- 79.Feuz, L., F. A. M. Leermakers, M. Textor, and O. Borisov. 2005. Bending rigidity and induced persistence length of molecular bottle brushes: a self-consistent field theory. Macromolecules. 38:8891–8901. [Google Scholar]
- 80.Smondyrev, A. M., and G. A. Voth. 2002. Molecular dynamics simulation of proton transport near the surface of a phospholipid membrane. Biophys. J. 82:1460–1468. [DOI] [PMC free article] [PubMed] [Google Scholar]
- 81.Tagliazucchi, M., E. J. Calvo, and I. Szleifer. 2008. Molecular theory of chemically modified electrodes by redox polyelectrolytes under equilibrium conditions: comparison with experiment. J. Phys. Chem. C. 112:458–471. [Google Scholar]


